


Abstract
Amplified copy number in the plasmepsin II/III genes within Plasmodium falciparum has been associated with decreased sensitivity to piperaquine. To examine this association and test whether additional loci might also contribute, we performed a genome-wide association study of ex vivo P. falciparum susceptibility to piperaquine.
Plasmodium falciparum DNA from 183 samples collected primarily from Cambodia was genotyped at 33716 genome-wide single nucleotide polymorphisms (SNPs). Linear mixed models and random forests were used to estimate associations between parasite genotypes and piperaquine susceptibility. Candidate polymorphisms were evaluated for their association with dihydroartemisinin-piperaquine treatment outcomes in an independent dataset.
Single nucleotide polymorphisms on multiple chromosomes were associated with piperaquine 90% inhibitory concentrations (IC90) in a genome-wide analysis. Fine-mapping of genomic regions implicated in genome-wide analyses identified multiple SNPs in linkage disequilibrium with each other that were significantly associated with piperaquine IC90, including a novel mutation within the gene encoding the P. falciparum chloroquine resistance transporter, PfCRT. This mutation (F145I) was associated with dihydroartemisinin-piperaquine treatment failure after adjusting for the presence of amplified plasmepsin II/III, which was also associated with decreased piperaquine sensitivity.
Our data suggest that, in addition to plasmepsin II/III copy number, other loci, including pfcrt, may also be involved in piperaquine resistance.
Artemisinin-based combination therapies (ACTs) are used worldwide and have contributed to reductions in the malaria burden in many areas. In response to inadequate efficacy of ACTs such as artesunate-mefloquine and artemether-lumefantrine [1, 2], dihydroartemisinin-piperaquine became the drug of choice to treat multidrug-resistant Plasmodium falciparum in regions of Southeast Asia plagued by artemisinin resistance. In addition, dihydroartemisinin-piperaquine is being used in field evaluations of targeted mass treatment to eliminate malaria within the Greater Mekong subregion in hopes of arresting the spread of resistance [3]. However, dihydroartemisinin-piperaquine efficacy rates as low as 46% have been reported in regions of western Cambodia where artemisinin resistance is well established [4–6], and decreased in vitro piperaquine susceptibility has been seen in parasites collected from these areas [7, 8]. These findings suggest the emergence of piperaquine resistance in addition to existing artemisinin resistance, which bodes poorly for the ability to treat P. falciparum in this part of the world.
Molecular assays to detect markers of antimalarial drug resistance are valuable surveillance tools. Mutations within PfKelch13 have been identified and genetically confirmed as markers of resistance to the artemisinins [9–11]. Two recent studies have indicated that copy number variation in the plasmepsin II and III genes, located on chromosome 14 of P. falciparum, may serve as a molecular marker for decreased piperaquine sensitivity [12, 13]; however, other loci may be involved. Using samples collected from Cambodia, we performed a genome-wide association study of ex vivo P. falciparum susceptibility to piperaquine to identify candidate resistance loci. Here we report that in, addition to plasmepsin II/III copy number, other loci are associated with decreased piperaquine sensitivity, including a novel mutation within the pfcrt gene.
METHODS
Study Samples
Samples used in the genome-wide association study were collected from individuals with clinical malaria participating in 1 of the 3 following studies (Supplementary Table 1): (1) a clinical trial of artesunate conducted in Battambang province from 2006–2007 (n = 30) [14]; (2) a malaria survey conducted from 2009–2014 in 8 Cambodian provinces: Battambang, Pailin, Koh Kong, Kampot, Kampong Speu, Oddar Meanchey, Preah Sihanouk, and Preah Vihear (n = 145) [7]; and (3) a single-arm clinical evaluation of artesunate-mefloquine conducted in Kanchanaburi province, Thailand (n = 8). One hundred eighty-three samples had both genotypes and phenotypes available.
Samples used in the validation dataset (n = 53) were collected as part of a therapeutic efficacy study conducted in Oddar Meanchey province that assessed the efficacy of a 3-day course of dihydroartemisinin-piperaquine [5]. In this study, using polymerase chain reaction (PCR) genotyping of P. falciparum msp1, msp2, and glurp, the PCR-adjusted 42-day recrudescence rate was found to be 54% by modified intention-to-treat analysis [5].
Samples were collected under informed consent as approved by the Walter Reed Army Institute of Research and local in-country institutional review boards and were approved for use by the University of Maryland School of Medicine.
Parasite Genotypes
DNA extracted from leukocyte-depleted venous blood was genotyped using a P. falciparum–specific NimbleGen 4.2M probe DNA microarray that types a total of 33716 single nucleotide polymorphisms (SNPs) [15]. One hundred seventeen isolates also underwent whole-genome sequencing using Illumina HiSeq 2000, using 101 base pair–paired end reads, without prior amplification. Illumina sequencing was also performed separately at the University of North Carolina to generate whole-genome sequence data for the 53 additional samples used as a validation dataset [16]. Statistics describing the breadth of genome coverage and read depth for both datasets can be found in Supplementary Table 2. Single nucleotide polymorphism calling for both datasets was performed at University of Maryland following Genome Analysis Toolkit’s best practices [17–19] using Unified Genotyper v3.1.1. Single nucleotide polymorphisms were filtered on phred-based quality score, read depth, strand bias, and mapping quality to generate a high-confidence SNP call set. The SNP array data have been submitted to the National Institutes of Health Gene Expression Omnibus for public access (www.ncbi.nlm.gov/geo/; accession number: GSE100704). Whole genome sequences were submitted to GenBank (accession numbers: SAMN06175892–SAMN06176015).
Phenotype
Ex vivo piperaquine 90% inhibitory concentrations (IC90s) were assessed using a histidine-rich protein-2 enzyme-linked immunosorbent assay (HRP-2 ELISA) as previously described [20, 21]. All assays were performed in the same laboratory at the Armed Forces Research Institute of Medical Science [21]. Piperaquine concentrations in the assay ranged 0.9–674 nM, including a no drug control. In 2013, we began to observe isolates with the ability to grow in the maximum concentration of drug used in the standard range. As a result, starting in 2014, an increased range of piperaquine concentrations (3.4–53905 nM) was used in addition to the standard dilutions. To estimate piperaquine IC90 of parasites that grew in the maximum concentration of drug from the standard range (0.9–674 nM), the curves were replotted by fitting “zero-growth” HRP-2 optical density values at the extrapolated piperaquine concentration of 53905 nM. Dose–response curves for isolates with a range of susceptibilities have been described previously [20, 22]. Ninety percent inhibitory concentration was used as the phenotype because it was better correlated with treatment outcome in our validation dataset and in other studies [20] compared with IC50. A recent article also reported that IC90 values were more reliable than IC50 values when quantifying differences in piperaquine susceptibility [23]. The piperaquine survival assay [8] was not performed on isolates included in this study.
ADMIXTURE Analysis and Single Nucleotide Polymorphism Imputation
ADMIXTURE 1.23 [24] was used to group parasites into subpopulations for the purpose of imputation and to adjust for confounding in the association analysis. The number of subpopulations, K, was varied from 1 to 15, with 10 replicate runs per K. Cross-validation errors were used to determine the appropriate K. Parasites clustered into 6 subpopulations. Ancestry values were used from the replicate with the greatest log-likelihood, and isolates were assigned to a subpopulation based on their greatest ancestry value (Supplementary Figure 1).
Beagle version 3.3.2 [25] was used to impute missing SNP calls for all isolates included in the genome-wide association analysis. Missing SNP calls were not imputed for whole-genome sequences in the fine-mapping analysis of genomic regions identified in the genome-wide association analysis. A 2-step approach was applied to impute the missing genotypes. Parasites with 100% ancestry values in each subpopulation were imputed within that subpopulation, and these imputed “pures” were used as a reference set to impute admixed parasites. A genotype probability of 90% was used to call an imputed SNP.
Quality Control
The proportion of missing SNP calls was plotted by SNP and by sample. Invariant nucleotide positions across 183 samples, SNPs with >40% missing calls, and samples with >40% missing calls were excluded before analysis. These criteria resulted in the removal of 28253 SNPs (23271 invariant SNPs and 4982 with a high proportion of missing calls) and 30 samples. An additional 2751 SNPs with minor allele frequency <5% were removed before analysis. After quality control, the final genome-wide association analysis included 2712 SNPs and 153 samples.
Correspondence Between Genetic Subpopulations
A hierarchical clustering approach using a proportional distance matrix, performed on previously published P. falciparum sequences from Cambodia [26] (Dwivedi et al, submitted), was used to determine the correspondence between genetic subpopulations in this study and those from the Dwivedi study. A total of 2474 SNPs from 320 samples (153 from this study and 167 from the Dwivedi study) were used in the analysis. Dwivedi and colleagues have shown that stable clusters can be obtained with as few as 1000 SNPs. The correspondence between the subpopulations is shown in Supplementary Figures 2 and 3.
Regression
Genome-wide mixed model association (GEMMA) [27] was used to estimate the association between each SNP and log10-transformed piperaquine IC90 (treated as a continuous variable), adjusting for genetic subpopulation, the presence of mutations in the kelch13 gene, and the first 3 principal components of a principal components analysis. Principal components were estimated from a matrix of pair-wise sample identity-by-state metrics [28]. An identity-by-state allele-sharing matrix was included as a random effect to account for the correlation between genetically similar individuals that results from population structure. The GEMMA method was used to estimate coefficients and P values. A Bonferroni threshold (0.05/number of SNPs analyzed) was used to evaluate genome-wide significance. Quantile-quantile plots for P values were used to assess the robustness of modeling approaches in minimizing false-positive results due to population structure or other confounding.
Random Forests
Random forest analyses [29] were done using the randomForest package [30] of the R statistical computing environment [31]. Because there is not an explicit way to control for confounding due to population structure in random forests, analysis was performed within the genetic subpopulation containing most parasites with the highest IC90 values (subpopulation 2, n = 22). The number of variables tested at each split ranged 323–1097, and the number of trees in the forest was 100000. The importance of each SNP in predicting log-transformed piperaquine IC90 (treated as a continuous variable) was assessed based on the percentage increase in mean-squared error.
Linkage Disequilibrium
The program Haploview [32] was used to determine linkage disequilibrium (LD) around SNPs associated with piperaquine susceptibility in genome-wide analyses. Linkage disequilibrium windows were defined to include all SNPs upstream and downstream of the associated SNP or mutation of interest up to but not including the next SNP with minor allele frequency (MAF) > 0.05 and R2 < 0.3. For associated SNPs, LD windows (Supplementary Table 3) were defined within parasites with the highest IC90 values (ie, log10 IC90 > 3.0) in genetic subpopulation 2 to avoid false LD estimates due to population structure.
Gene Copy Number Analysis
Copy number variation was assessed across the 117 samples for which whole-genome sequences were generated. Raw paired-end sequences from each sample were aligned against the P. falciparum 3D7 (PlasmoDB version 24) reference sequence using bowtie2 (version 2.2.4) [33]. For each sample, we calculated the number of reads that overlap known coding sequence intervals based on the P. falciparum 3D7 reference annotation general feature format file. The overlapping reads for each sample were normalized by mean coverage of the sample. Gene coverage in P. falciparum telomeric and internal hypervariable repeat regions [34] was excluded. Linear regression was used to model normalized coverage of P. falciparum core genes as a function of log-transformed piperaquine IC90. To estimate the number of copies of the plasmepsin II and III genes within samples with whole genome sequence data, copy number variations across chromosome 14 were determined by applying a previously described procedure [34].
Association With Treatment Outcome
Cox proportional hazards was used to model the time to P. falciparum recurrence in individuals with a given mutation (eg, PfCRT F145I or amplified plasmepsin II/III copy number) compared with those without that mutation in the independently sequenced validation dataset. Hazard ratios (HRs) and 95% confidence intervals (CIs) were estimated using SAS v.9.3.
RESULTS
A total of 183 samples had both SNP array data and ex vivo phenotypes available (Supplementary Table 1). After quality control, a total of 2712 SNPs and 153 samples were included in the final genome-wide association analysis. Of these 153 samples, 117 successfully underwent whole-genome sequencing for use in fine-mapping and copy number variation analyses.
Phenotype Distribution
The distribution of log-transformed piperaquine IC90s is shown in Figure 1 (Supplementary Table 4). Parasites with the highest IC90s clustered into the same genetic subpopulation (subpopulation 2, n = 22). Parasites from subpopulation 2 corresponded with the artemisinin-resistant KH2.2 subpopulation from a study conducted by Dwivedi and colleagues (Dwivedi et al, submitted) (Supplementary Figure 2). No parasites from this study corresponded with the artemisinin-sensitive ancestral Southeast Asian subpopulation KH1.1 from the Dwivedi study (Supplementary Figure 3).
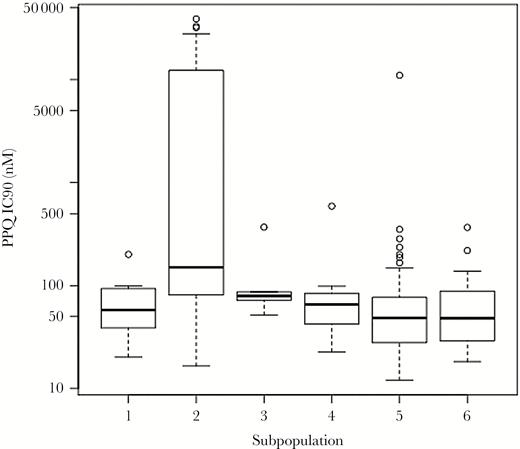
Distribution of piperaquine 90% inhibitory concentrations (IC90) by genetic subpopulation. Parasites in the genome-wide analysis grouped into 6 genetic subpopulations. Most parasites with elevated piperaquine IC90s grouped together in genetic subpopulation 2 (n = 22). Abbreviations: IC90, 90% inhibitory concentration; PPQ, piperaquine.
Genome-Wide Associations
Ten SNPs on chromosomes 6, 10, 11, 12, and 14 achieved genome-wide significance in linear mixed models of the association between each SNP on the array and piperaquine IC90 (Figure 2). The random forests analysis identified an SNP on chromosome 11 as the best predictor of piperaquine IC90 (MAL11:1816380), with SNPs on chromosomes 7, 8, 9, 10, and 14 also being among the top predictors of log-transformed IC90 (Figure 3). All SNPs from the array that were associated with piperaquine susceptibility are shown in Supplementary Table 5.
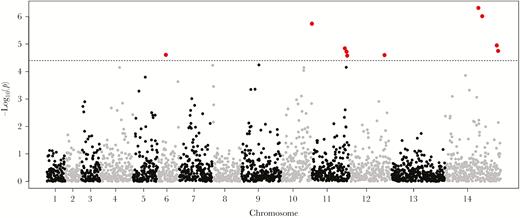
Manhattan plot of the association between genome-wide parasite genotypes and piperaquine 90% inhibitory concentrations (IC90). Linear mixed models were used to estimate the association between single nucleotide polymorphisms (SNPs) on the DNA microarray and a continuous measure of log-transformed piperaquine IC90 (n = 153). The SNPs achieving genome-wide significance are shown in red. The SNPs on chromosomes 6, 10, 11, 12, and 14 were significantly associated with the phenotype. The SNP in PfCRT encoding the F145I mutation was not included in the microarray and was only detected by whole-genome sequencing.
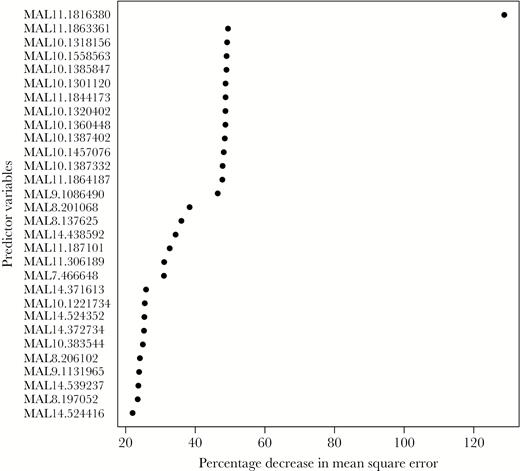
Random forest variable importance plot identifying loci from the DNA microarray that best predict piperaquine 90% inhibitory concentrations (IC90). Random forests were used to identify loci that were the best predictors of a continuous measure of log-transformed piperaquine IC90 in samples from genetic subpopulation 2 (n = 22). The single nucleotide polymorphisms (SNPs) showing the greatest percentage increase in mean squared error (x-axis) are the best predictors of the phenotype. The SNPs on chromosomes 7, 8, 9, 10, 11, and 14 were the top predictors of log-transformed IC90.
Fine-Mapping Using Whole-Genome Sequences
Regions of LD are defined for each SNP in Supplementary Table 5 (Supplementary Table 3). From these regions of the genome, all SNPs identified in parasites that underwent whole-genome sequencing were included in linear mixed models of the association between log-transformed piperaquine IC90 and each locus. Nineteen SNPs, many of which were in perfect LD with each other, achieved genome-wide significance and had a positive coefficient (ie, the nonreference allele was associated with the phenotype) (Table 1). These loci included the SNP encoding a mutation at position 145 within the pfcrt gene (F145I), SNPs within a large region of chromosome 10, and SNPs on chromosomes 9 and 14. Based on gene ontology classification in PlasmoDB, only 1 gene in Table 1, pfcrt, has a predicted function related to drug response, transport, or hemoglobin metabolism.
Single Nucleotide Polymorphisms Associated With Piperaquine 90% Inhibitory Concentrations in Fine-Mapping Analysis of Whole-Genome Sequence Data
| SNP | Gene (mutation) | P value |
|---|---|---|
| MAL7:404010 | PF3D7_0709000 (Chloroquine resistance transporter, F145I) | 3.61E-07 |
| MAL9:1233153 | PF3D7_0930800 (Conserved membrane protein, T2490I) | 3.61E-07 |
| MAL9:1233160 | PF3D7_0930800 (Conserved membrane protein, 2492S) | 3.61E-07 |
| MAL9:1279569 | PF3D7_0932100 (Conserved membrane protein, intronic) | 3.61E-07 |
| MAL9:1279572 | PF3D7_0932100 (Conserved membrane protein, intronic) | 3.61E-07 |
| MAL10:1318156 | PF3D7_1032900 (RNA polymerase II–associated protein 1, 932L) | 8.75E-07 |
| MAL10:1343706 | PF3D7_1033500 (WD repeat-containing protein 70, I687M) | 3.61E-07 |
| MAL10:1351775 | PF3D7_1033800 (Plasmepsin VII, intronic) | 3.61E-07 |
| MAL10:1362218 | PF3D7_1034100 (Conserved protein, 118G) | 3.61E-07 |
| MAL10:1369153 | PF3D7_1034400 (Flavoprotein subunit of succinate dehydrogenase, Q13K) | 3.61E-07 |
| MAL10:1372810 | PF3D7_1034500 (Conserved protein, C651Y) | 3.61E-07 |
| MAL10:1391842 | PF3D7_1035100 (Probable protein, D133A) | 3.61E-07 |
| MAL10:1392054 | PF3D7_1035100 (Probable protein, S204R) | 3.61E-07 |
| MAL10:1400026 | PF3D7_1035300 (Glutamate-rich protein, P278S) | 3.61E-07 |
| MAL10:1401296 | PF3D7_1035300 (Glutamate-rich protein, S701F) | 3.61E-07 |
| MAL10:1506404 | PF3D7_1038000 (Antigen UB05, 51I) | 3.61E-07 |
| MAL10:1546332 | PF3D7_1038400 (Gametocyte-specific protein,) | 3.61E-07 |
| MAL10:1552425 | PF3D7_1038600 (Exported protein, H210R) | 3.61E-07 |
| MAL14:408912 | PF3D7_1410300 (WD repeat-containing protein, 2717P) | 3.61E-07 |
Linear mixed models were used to estimate the association between single nucleotide polymorphisms (SNPs) identified in regions of the genome in linkage disequilibrium with loci from Supplementary Table S5 and a continuous measure of log-transformed piperaquine 90% inhibitory concentrations (IC90) in samples that underwent whole-genome sequencing. The SNP corresponding to PfCRT F145I is shown in bold text and was the only locus with gene ontology terms suggesting a function in hemoglobin metabolism, drug response, or transport.
Abbreviation: SNP, single nucleotide polymorphism.
Copy Number Analysis
Linear regression was used to model normalized read coverage of P. falciparum core genes as a function of log-transformed piperaquine IC90 in samples for which whole-genome sequence was available (n = 117). Read coverage of 2 genes on chromosome 14, plasmepsin II and III, showed the strongest association with piperaquine IC90 (Figure 4). Read coverage of the pfmdr1 gene was not significantly associated with piperaquine IC90 after accounting for multiple comparisons (P = .01).
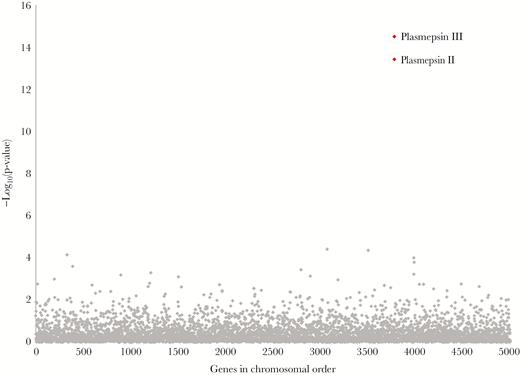
Association between gene copy number and piperaquine 90% inhibitory concentrations (IC90). Linear regression was used to model normalized coverage of Plasmodium falciparum core genes in 117 whole-genome sequences as a function of log-transformed piperaquine IC90 (treated as a continuous variable). Normalized coverage of the plasmepsin II/III genes showed the strongest association with piperaquine IC90 (P values indicated in red).
Validation Dataset
To validate the observed associations, we examined sequences generated from parasites collected during a study evaluating the therapeutic efficacy of dihydroartemisinin-piperaquine (n = 53) [5]. In this independent dataset, the unadjusted hazard of P. falciparum recurrence in patients with parasites containing >1 copy of the plasmepsin II gene (n = 34) compared with patients with a single copy of this gene was 5.59 (95% CI = 1.30–24.06) (Table 2). The unadjusted hazard of recurrence in patients with parasites having the PfCRT 145I mutation (n = 13) compared with those with the wildtype F145 was 5.12 (95% CI = 2.10–12.49). The association between PfCRT 145I remained significant after adjusting for parasites having >1 copy of plasmepsin II and log-transformed parasitemia at diagnosis (adjusted HR = 4.61; 95% CI = 1.73–12.28) (Table 2). In this dataset, all but 4 parasites had a PfKelch13 propeller mutation, such that the presence of a PfKelch13 mutation was not significantly associated with recurrence and not included in the final model.
Cox Proportional Hazards Models of Time to Plasmodium falciparum Recurrence
| Variable | Hazard ratio (95% CI) | P value |
|---|---|---|
| Plasmepsin II >1 | 5.59 (1.30–24.06) | .02 |
| PfCRT 145I | 5.12 (2.10–12.49) | .0003 |
| Plasmepsin II >1 | 4.14 (.89–19.37) | .07 |
| PfCRT 145I | 4.61 (1.73–12.28) | .002 |
| Parasitemia at diagnosis | 1.53 (1.00–2.36) | .051 |
| Variable | Hazard ratio (95% CI) | P value |
|---|---|---|
| Plasmepsin II >1 | 5.59 (1.30–24.06) | .02 |
| PfCRT 145I | 5.12 (2.10–12.49) | .0003 |
| Plasmepsin II >1 | 4.14 (.89–19.37) | .07 |
| PfCRT 145I | 4.61 (1.73–12.28) | .002 |
| Parasitemia at diagnosis | 1.53 (1.00–2.36) | .051 |
Abbreviation: CI, confidence interval.
In addition, the mean piperaquine IC90 was significantly greater in parasites with both the PfCRT 145I mutation and multiple copies of plasmepsin II, compared with parasites with amplified plasmepsin II and without 145I (linear regression, P = .03) and compared with parasites with a single copy of plasmepsin II and without 145I (linear regression, P = .0001) (Figure 5; Supplementary Table 6). The PfCRT 145I mutation only occurred in parasites with amplified plasmepsin II/III.
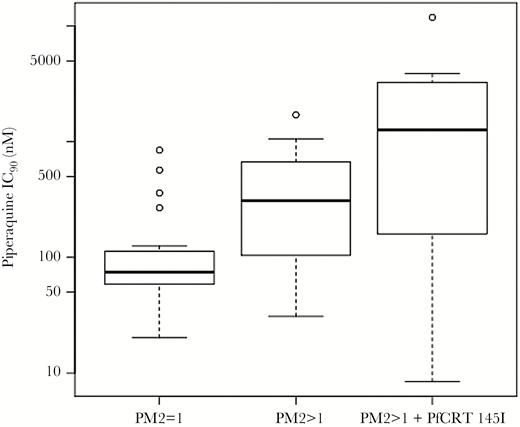
Distribution of piperaquine 90% inhibitory concentrations (IC90) among parasites with different combinations of amplified plasmepsin II copy number and PfCRT 145I. Box plots indicate the distribution of piperaquine IC90 in parasites from the validation data set (n = 53) in the following groups: parasites with a single copy of plasmepsin II and without the PfCRT 145I mutation (left), parasites with >1 copy of plasmepsin II and without PfCRT 145I (center), and parasites with >1 copy of plasmepsin II and with PfCRT 145I (right). The PfCRT 145I mutation only occurred in parasites with amplified plasmepsin II copy number. Abbreviation: IC90, 90% inhibitory concentration.
PfCRT and Other Mutations
Within both the fine-mapping and validation datasets, 46 infections contained parasites with multiple copies of the plasmepsin II/III genes, 64% of which did not have the 145I mutation, and 36% of which did have the 145I mutation. In addition, the PfCRT 145I mutation only occurred on a Dd2 PfCRT background (ie, in parasites with mutations at positions 75, 326, 356, and 371), and all parasites with 145I showed a single haplotype in SNPs flanking and in LD with the pfcrt gene (Supplementary Figure 4). All parasites with PfCRT 145I had the 580Y mutation at the kelch13 locus, whereas 85% (n = 23/27) of parasites with amplified plasmepsin II/III but without 145I had 580Y. The PfCRT 97Y and 97L mutations [8] were observed in 4 and 2 parasites, respectively, in the fine-mapping dataset. Position 97 was not associated with piperaquine IC90 in linear mixed models (P = .60). The 97Y mutation was not observed, and the 97L mutation was observed only once in parasites within the validation dataset. No parasites in either dataset had mutations at PfCRT positions 343 and 353, positions implicated in a previous study of piperaquine susceptibility conducted in a different region of Cambodia [8].
DISCUSSION
Amplification of plasmepsin II/III is associated with decreased piperaquine sensitivity and may serve as a useful marker for surveillance [12, 13]. We performed a genome-wide association study of ex vivo P. falciparum susceptibility to piperaquine to identify loci that are associated with decreased sensitivity. Single nucleotide polymorphisms on multiple chromosomes were associated with piperaquine IC90 in a genome-wide analysis. Fine-mapping of genomic regions implicated in genome-wide analyses identified multiple SNPs in LD with each other that were significantly associated with piperaquine IC90, including a mutation within the pfcrt gene. This mutation (PfCRT F145I) was associated with P. falciparum recurrence following treatment with dihydroartemisinin-piperaquine after adjusting for the presence of multiple copies of the plasmepsin II gene. Although plasmepsin II/III copy number was associated with piperaquine IC90 and dihydroartemisinin-piperaquine treatment outcome, our data suggest that other loci may also be involved in resistance.
Amato and colleagues recently reported an association between a mutation within an exonuclease on chromosome 13 and piperaquine IC50 [35]. We did not see any evidence of an association between piperaquine IC50 or IC90 and SNPs on chromosome 13 in our genome-wide analysis. We did, however, see some overlap in SNPs identified in the Amato study and regions of the genome identified in our genome-wide analysis, including SNPs on chromosome 12 (MAL12:1787279) and chromosome 14 (MAL14:2385550, MAL14:2395752, and MAL14:2411942). Wang and colleagues [36] also showed an association between piperaquine IC50 and an SNP in a similar region of chromosome 12 (MAL12:1959796), as well as an SNP on chromosome 8 (MAL8:280180) that is in a region of the chromosome identified in our genome-wide analysis. Although these regions of chromosomes 8, 12, and 14 did not show significant associations in our fine-mapping analysis of whole genome sequences, they were identified in multiple studies and thus warrant further investigation.
We observed a large region of LD on chromosome 10 that was associated with piperaquine IC90, both in the regression and random forest analyses. This pattern is consistent with a selective sweep localizing to this region of the genome, which harbors 54 genes (chromosome 10: 1318156–1552425). Of these 54 genes, 9 (PF3D7_1033000, PF3D7_1034000, PF3D7_1034700, PF3D7_1036300, PF3D7_1036400, PF3D7_1036800, PF3D7_1037300, PF3D7_1037500, PF3D7_1038100) had gene ontology terms suggesting a function in hemoglobin metabolism, drug response, or transport, and 1 (PF3D7_1036300, encoding Duffy binding-like merozoite surface protein 2) has been implicated in resistance to halofantrine, mefloquine, and lumefantrine [37]. However, none of these 9 genes had polymorphisms that were significantly associated with piperaquine IC90 in our fine-mapping analysis of whole-genome sequences. This region of the genome is also in LD with PfCRT F145I, so it is not clear which mutations are driving the signal, but it is possible that additional loci within this region of chromosome 10 are contributing to decreased sensitivity.
PfCRT has been implicated in previous studies of piperaquine susceptibility, supporting our evidence that variants of this transporter can contribute to resistance to this chloroquine-like bisquinoline. Specifically, PfCRT 101F was identified in Dd2 parasites exposed to continuous piperaquine pressure that had elevated piperaquine IC50s [38], and this mutation was able to mediate piperaquine resistance in vitro when introduced via gene editing into Dd2 parasites [23]. Mutations at PfCRT positions 97, 343, and 353 have also been associated with decreased piperaquine sensitivity [8]. In our datasets, mutations at PfCRT position 97 were not associated with piperaquine IC90, and no mutations were observed at positions 343 and 353 in either the fine-mapping or validation datasets.
In this study, we only observed the PfCRT 145I mutation in samples collected from Oddar Meanchey province in the years 2013–2014. Because samples were not available from other provinces for these years of the study (Supplementary Table 7), it is not possible for us to determine the distribution of this mutation in other regions of Cambodia, which is a limitation of the study. This mutation was not noted in other studies of piperaquine susceptibility that used clinical samples from Cambodia [12, 13]. Although these studies did not sample isolates from Oddar Meanchey province, they did include isolates from neighboring Preah Vihear province. Future studies will examine the distribution of PfCRT 145I in other geographic regions and its association with dihydroartemisinin-piperaquine treatment efficacy.
The PfCRT 145I mutation was only observed in parasites with amplified plasmepsin II/III copy number, suggesting that perhaps in nature this mutation has only occurred or only attains high frequency on a background of amplified plasmepsin II/III. This observation could suggest that 145I has emerged on a background of resistance and that its association with resistance is not causal. However, this scenario is not supported by the observation that the association between PfCRT 145I and treatment outcome remained significant after adjusting for the presence of amplified plasmepsin II/III. Moreover, the mean piperaquine IC90 was greater in parasites with both amplified plasmepsin II/III and PfCRT 145I compared with parasites with just amplified plasmepsin II/III, suggesting that 145I results in an additional resistance effect beyond that caused by amplified plasmepsin II/III. Experiments to introduce PfCRT 145I into parasites both with and without elevated plasmepsin II/III copy number and to remove this mutation from parasites with elevated copy number will be important for understanding the independent effect of the PfCRT 145I mutation and examining any interaction between this locus and the plasmepsin II/III genes.
Supplementary Data
Supplementary materials are available at The Journal of Infectious Diseases online. Consisting of data provided by the authors to benefit the reader, the posted materials are not copyedited and are the sole responsibility of the authors, so questions or comments should be addressed to the corresponding author.
Notes
Disclaimers. Material has been reviewed by the Walter Reed Army Institute of Research. There is no objection to its presentation and/or publication. The opinions or assertions contained herein are the private views of the author, and are not to be construed as official or as reflecting the views of the US Department of the Army, the US Department of Defense, or the US government. In addition, the contents of this publication do not necessarily reflect the views, opinions, or policies of Uniformed Services University of the Health Sciences.
Financial support. This research was supported by grants from the National Institutes of Health (R01 AI101713 and R01 AI125579 to S. T.-H.); R01 AI089819 to J. J. J.; R01 AI124678, R01 AI109023, R01 AI50234to D. A. F.; and U19AI110820 to C. Fraser [project leader J. C. S.]).
Potential conflicts of interest. All authors: No reported conflicts of interest. All authors have submitted the ICMJE Form for Disclosure of Potential Conflicts of Interest. Conflicts that the editors consider relevant to the content of the manuscript have been disclosed.
References
Author notes
Presented in part: Annual Meeting of the American Society of Tropical Medicine and Hygiene, Philadelphia, Pennsylvania, November 2015. Presentation number: LB-5375.
Present affilation/address: Atreca, Inc., Redwood City, California (E. F. D.); Wellcome Trust Sanger Institute, Hinxton, United Kingdom (C. G. J.); Uniformed Services University of the Health Sciences, Rockville, Maryland (C. A. L.).

