


Abstract
Schistosomiasis japonica remains a major public health and socioeconomic concern in Southeast Asia. Sensitive and accurate diagnostics can play a pivotal role in achieving disease elimination goals.
We previously reported a novel droplet digital polymerase chain reaction (ddPCR) assay targeting the mitochondrial gene nad1 to diagnose schistosomiasis japonica. The tool identified both prepatent and patent infections using Schistosoma japonicum DNA isolated from serum, urine, salivary glands, and feces in a murine model. The assay was validated here using clinical samples collected from 412 subjects resident in an area moderately endemic for schistosomiasis in the Philippines.
S. japonicum DNA present in human stool, serum, urine, and saliva was detected quantitatively with high sensitivity. The capability to diagnose cases of human schistosomiasis using noninvasively collected clinical samples, the higher level of sensitivity obtained compared with the microscopy-based Kato-Katz test, and the capacity to quantify infection intensity have important public health implications for schistosomiasis control and programs targeting other neglected tropical diseases.
This verified ddPCR method represents a valuable new tool for the diagnosis and surveillance of schistosomiasis, particularly in low-prevalence and low-intensity areas approaching elimination and in monitoring where disease emergence or re-emergence is a concern.
Schistosomiasis continues to be a major public health concern in 78 endemic countries. Unlike the African schistosomes, the involvement of reservoir hosts, such as carabao in the Philippines, impacts heavily on the transmission of human disease due to Schistosoma japonicum [1–3]. In the Filipino municipalities of Palapag and Laoang, Northern Samar, human prevalence among endemic barangays (villages) is reported to be between 5% and 50% using the Kato-Katz (KK) thick smear test, but approximately 90% using more sensitive molecular diagnostics [4–6].
Accurate diagnosis is required to monitor the impact of schistosomiasis control programs. Poorly sensitive diagnostic tests will miss infected undiagnosed individuals who contribute to disease transmission and rebound infections [7–9]. Coproparasitological methods have low sensitivity levels, particularly in areas with reduced disease transmission [10–12]. Compared with antibody-based detection assays, circulating cathodic antigen (CCA)-based assays provide improved diagnostic performance, but assay results frequently fluctuate, requiring multiple sample testing to increase sensitivity [13–15].
A number of molecular techniques, including conventional polymerase chain reaction, loop-mediated isothermal amplification, real-time PCR, and droplet digital PCR (ddPCR), can detect schistosome infections [4, 12, 16–18]. Schistosome egg DNA measurement in host clinical samples has been performed using different PCR techniques [4, 18, 19]. To overcome some of the drawbacks of egg DNA detection, assays have been developed that measure Schistosoma cell-free DNA (cfDNA) in human clinical samples [16, 20–23]. DNA-based assays can detect early infections [16, 24, 25] and cfDNA has proven to be a valuable marker for monitoring therapeutic responses against schistosomiasis [21, 24] and for unraveling diagnostic dilemmas, such as those associated with neuroschistosomiasis [26].
We reported the optimization and validation of a novel dual-target ddPCR assay for the diagnosis of schistosomiasis japonica in a murine model using feces, urine, and blood [16, 27]. Here we describe the field application of this assay modified to single target (nad1) detection for the diagnosis of S. japonicum infection in humans from endemic municipalities in Northern Samar, the Philippines where schistosomiasis control is ongoing [5, 6, 28]. The ddPCR assay was tested using feces, serum, urine, and saliva samples, and compared with the KK method.
Methods
Ethics Statement
This study was approved by the QIMR Berghofer Medical Research Institute (QIMRB) Human Ethics Committee and the Ethics Committee of the Research Institute for Tropical Medicine (RITM), Manila. Informed written consent was received from all study participants.
Study Area
A cross-sectional survey was conducted in 2015 in 18 barangays endemic for S. japonicum infection in Laoang and Palapag municipalities, Northern Samar, the Philippines (Figure 1A) to determine human prevalence and infection intensity using KK and ddPCR. The barangays are part of the national schistosomiasis control program in the Philippines [6]. Details of the study population are described elsewhere as part of a hepatic morbidity study conducted since 2012 [5].
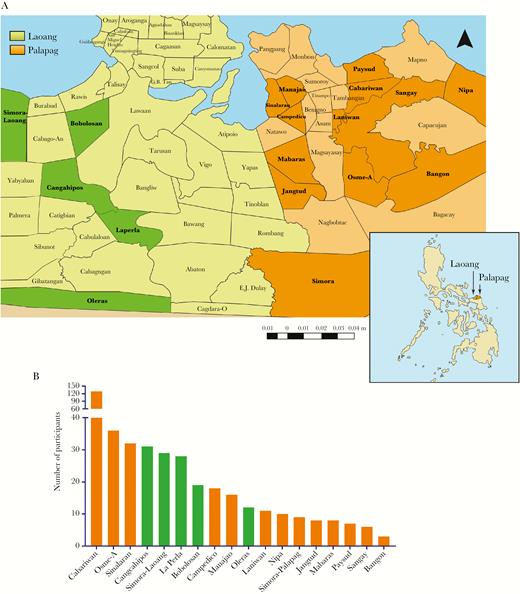
A, Map of the Philippines showing the position of Palapag and Laoang municipalities and the location of the 18 study barangays. (Adapted from a map from Global Administrative Areas: www.gadm.org). B, Distribution of study participants across the 18 barangays.
Sample Collection, Processing, and Storage
Clinical samples (feces, blood, urine, and saliva) were collected from 452 subjects from the 18 barangays (Figure 1B). Age and gender data were collected at sampling. All processed samples were stored at 4°C and transported on wet ice to the RITM, where the samples were stored at −20°C. Subsequently, all samples were transported on dry ice to QIMRB, Australia for DNA isolation and molecular analysis.
Fecal Samples
Individual stools (approximately 10–15 g) were obtained from each participant and placed into id-labeled fecal cups. Two fecal samples were sought from each individual on different days for the KK. The remainder of the first fecal sample (approximately 10 g) was stored at 4°C, after fixing in 80% (v/v) ethanol, and used for DNA analysis.
Blood Samples
Blood samples (10 mL) were collected from each individual and placed into id-labeled serum separation tubes (10-mL silica vacutainers). The bloods were allowed to clot for 30 minutes at room temperature and the samples were then centrifuged at 1500 g for 10 minutes.
Urine Samples
Spot urine samples (30 mL) were collected into id-labeled 50-mL Falcon tubes.
Saliva Samples
Saliva (2 mL) was collected into 5-mL id-labeled centrifuge tubes using the passive drool method.
Fecal Examination: Microscopy
The KK test was performed on all fecal samples. Three microscope slides prepared from each sample were examined under a light microscope by experienced microscopists according to established methods. Individual microscopists were blinded to the results of the other microscopists. Number of S. japonicum eggs per slide was counted and the final egg counts were expressed as eggs per gram (EPG) of feces [4].
DNA Extraction
Genomic DNA isolation of fecal samples was performed using the Maxwell®16 Instrument (Promega, Wisconsin) incorporating the Maxwell®16 LEV Plant DNA kit. For sample preparation, 500 µL of ddH2O was added to each 200 mg of feces, which was then centrifuged at 13000 g for 5 minutes. The resultant supernatant was discarded and 1 g of (0.5 mm) zirconia-silicate beads (BioSpec Products, Oklahoma) and 500 µL of ROSE buffer were added. Samples were then homogenized (6500 g × 40 seconds) using a Precellys® tissue homogenizer (Bertin Technologies, Montigny-le-Bretonneux, France). The homogenate was incubated at 90°C for 10 minutes and centrifuged at 16000 g for 5 minutes. The collected supernatant was added to a Maxwell®16 LEV Plant DNA kit cartridge, placed into the Maxwell®16 robot, and the plant DNA extraction protocol selected. DNA extractions from serum, saliva, and urine were performed using 2 mL of sample with a ChemagicTM360 instrument (PerkinElmer Inc., Massachusetts). DNA concentrations were determined using a PowerWave HT microplate spectrophotometer (BioTek Instruments Inc., Vermont). PCR analysis was performed using DNA concentrations of 50 ng/µL for feces, 25 ng/µL for serum, and 40 ng/µL for urine and saliva. Based on the availability of all 4 types of samples and successful DNA isolation, a total of 412 (of 452) subjects were used in the final analysis.
Droplet Digital PCR Analysis
The PCR primers amplify an 82-bp fragment of the nad1 gene [16, 27, 29]. The assay analyzed DNA from feces (F_ddPCR), serum (SR_ddPCR), urine (U_ddPCR), and saliva (SL_ddPCR). Reaction mixtures (20 µL) comprised 10 µL 1 × ddPCR EvaGreen master mix (Bio-Rad, Hercules), 250 nM (final concentration) of each forward and reverse primers, 2 µL template DNA, and 6 µL ddH2O. The reaction mixes were pipetted into a 96-well twin.tec PCR plate (Eppendorf, Hamburg, Germany) and droplet generation was performed in an AutoDG instrument (Bio-Rad). The generation of droplets resulted in partitioning the 20 µL sample into approximately 20000 nanolitre sized droplets and the twin.tec plate with droplets was then heat sealed with a pierceable foil heat seal (Bio-Rad) using a PX1 PCR Plate Sealer (Bio-Rad) and placed into a thermal cycler (c1000, Bio-Rad). The ddPCR cycling conditions were as follows: enzyme activation for 5 minutes at 95°C, 40 cycles of denaturation at 95°C for 30 seconds, annealing at 60°C for 30 seconds, and extension at 72°C for 30 seconds, followed by a final dye stabilization step at 4°C for 5 minutes and then 95°C for 5 minutes. Negative (no DNA template) controls were used in all assays, as were positive controls containing adult S. japonicum worm DNA. Following PCR amplification, the plate was placed in a QX200 Droplet Reader (Bio-Rad) for droplet reading and analysis. Fluorescence intensity of the negative control was used as the threshold for discrimination between droplets that contained target (positives) and those that did not (negatives), determined using QuantaSoft software version 1.3.2.0 (Bio-Rad) [16, 27].
Target Gene Copy Number Index
The target gene copy number index (CNI) is defined as the number of target gene copies per 100 ng of template DNA. Target gene copy number per 1 µL, of a 20 µL reaction mix, was obtained from the droplet reader results. This was converted to CNI, using the following formula
Statistical Analysis
Data analyses were performed using Microsoft Excel, GraphPad Prism version 7 (GraphPad Software, Inc., California) and R version 3.4.0 (R Foundation, Vienna, Austria) software. Summary measures are expressed as means and 95% confidence intervals (CI). A test sample was considered positive if at least one S. japonicum egg was identified on any KK slide, or if a positive gene copy number was determined by ddPCR [16, 27]. Prevalence for all 5 tests used (KK, F_ddPCR, SR_ddPCR, U_ddPCR, and SL_ddPCR) was calculated from the total study sample. Measures of test accuracy including sensitivity and specificity of all ddPCRs were obtained with the KK as the reference test. These measures were also calculated relative to F_ddPCR, which had the highest sensitivity among all the ddPCRs against the KK. The ddPCR tests were performed independently from the KK and the results were compared only after the ddPCRs had been completed. Kappa statistic was used to test agreement among levels of infection intensity of different tests. Correlations between CNI from the ddPCRs and EPG from the KK test results were tested with Pearson’s correlation coefficiencies, after using the transformation log (Y+1), where ‘Y’ represents the CNI or EPG, to normalize distributions. Mann-Whitney and Kruskal-Wallis tests were used to detect significant differences in infection intensity across age, gender, and barangays. The chi-square (χ2) test was used to test the associations between S. japonicum infection and age, gender, and barangays. Differences among infection prevalences obtained by the different diagnostic approaches were tested using McNemar’s test. A significance level of 5% (P = .05) was used for statistical inference.
RESULTS
Description of Study Population
Fifty-three percent (n = 218) of the study group (n = 412; mean age, 40.3 years; 95% CI, 38.8–41.8) was male. Gender, age, and barangay distribution of participants is shown in Table 1.
Prevalence and Intensity of Infection With Different Diagnostic Tests By Gender, Age, and Barangay Categories
| Variables | Total | KK test | F_ddPCR | SR_ddPCR | U_ddPCR | SL_ddPCR | ||||||||||||||||||||||
| n | % | Positive | Prevalence (%) | Intensity (EPG) | Positive | Prevalence (%) | Intensity (CNI) | Positive | Prevalence (%) | Intensity (CNI) | Positive | Prevalence (%) | Intensity (CNI) | Positive | Prevalence (%) | Intensity (CNI) | ||||||||||||
| % | 95% CI | Mean | 95% CI | % | 95% CI | Mean | 95% CI | % | 95% CI | Mean | 95% CI | % | 95% CI | Mean | 95% CI | % | 95% CI | Mean | 95% CI | |||||||||
| Total study sample | 412 | 100.0 | 108 | 26.2 | 22.0–30.5 | 17.6 | 8.8–26.3 | 307 | 74.5 | 70.3–78.7 | 63.2 | 46.9–79.5 | 277 | 67.2 | 62.7–71.8 | 21.3 | 20.1–22.4 | 196 | 47.6 | 42.8–52.4 | 13.3 | 12.7–13.9 | 105 | 25.5 | 21.3–29.7 | 12.4 | 11.8–12.9 | |
| Gender | Male | 218 | 52.9 | 70 | 32.1 | 25.9–38.3 | 25.3 | 12.2–38.5 | 163 | 74.8 | 69–80.5 | 91.7 | 62.2–121.2 | 147 | 67.4 | 61.2–73.7 | 23.0 | 21.2–24.9 | 108 | 49.5 | 42.9–56.2 | 13.7 | 12.8–14.6 | 61 | 28.0 | 22.0–33.9 | 12.8 | 12.1–13.6 |
| Female | 194 | 47.1 | 38 | 19.6 | 14.0–25.2 | 3.3 | 0.7–5.8 | 144 | 74.2 | 68.1–80.4 | 30.9 | 23.9–37.9 | 130 | 67.0 | 60.4–73.6 | 19.2 | 17.9–20.6 | 88 | 45.4 | 38.4–52.4 | 12.9 | 12.1–13.6 | 44 | 22.7 | 16.8–28.6 | 11.8 | 10.9–12.7 | |
| Age | < 10 y | 25 | 6.1 | 8 | 32.0 | 13.7–50.3 | 47.5 | 0–114.3 | 15 | 60.0 | 40.8–79.2 | 146.3 | 0–308.8 | 14 | 56.0 | 36.5–75.5 | 26.9 | 18.5–35.4 | 11 | 44.0 | 24.5–63.5 | 15.5 | 13.1–17.8 | 7 | 28.0 | 10.4–45.6 | 14.1 | 11.2–17.1 |
| 10–18 y | 40 | 9.7 | 13 | 32.5 | 18.0–47.0 | 50.9 | 0–111.9 | 30 | 75.0 | 61.6–88.4 | 130.1 | 15.9–244.3 | 26 | 65.0 | 50.2–79.8 | 21.3 | 15.7–26.9 | 18 | 45.0 | 29.6–60.4 | 14.9 | 11.1–18.7 | 9 | 22.5 | 9.6–35.4 | 14.6 | 11.9–17.3 | |
| 19–35 y | 50 | 12.1 | 11 | 22.0 | 10.5–33.5 | 12.2 | 0–27.4 | 35 | 70.0 | 57.3–82.7 | 55.0 | 21.2–88.8 | 32 | 64.0 | 50.7–77.3 | 19.8 | 16.4–23.1 | 22 | 44.0 | 30.2–57.8 | 12.3 | 10.7–13.9 | 14 | 28.0 | 15.6–40.4 | 12.6 | 10.9–14.2 | |
| 36–55 y | 231 | 56.1 | 56 | 24.2 | 18.7–29.8 | 11.0 | 5.5–16.4 | 174 | 75.3 | 69.8–80.9 | 51.8 | 36.7–66.8 | 161 | 69.7 | 63.8–75.6 | 21.7 | 20.2–23.1 | 108 | 46.8 | 40.3–53.2 | 13.3 | 12.5–14.0 | 55 | 23.8 | 18.3–29.3 | 12.0 | 11.2–12.8 | |
| >55 y | 66 | 16.0 | 20 | 30.3 | 19.2–41.4 | 5.5 | 0.2–10.7 | 53 | 80.3 | 70.7–89.9 | 44.8 | 28.8–60.8 | 44 | 66.7 | 55.3–78.0 | 18.9 | 16.6–21.1 | 37 | 56.1 | 44.1–68 | 12.7 | 11.5–13.9 | 20 | 30.3 | 19.2–41.4 | 11.8 | 10.5–13.1 | |
| Barangay | Cabariwan | 129 | 31.3 | 23 | 17.8 | 11.2–24.4 | 5.9 | 1.2–10.7 | 88 | 68.2 | 60.2–76.3 | 29.2 | 18.9–39.6 | 79 | 61.2 | 52.8–69.6 | 19.4 | 17.4–21.4 | 55 | 42.6 | 34.1–51.2 | 11.8 | 10.9–12.6 | 34 | 26.4 | 18.8–34 | 12.6 | 11.9–13.4 |
| Osme-A | 36 | 8.7 | 14 | 38.9 | 23.0–54.8 | 8.5 | 0–19.9 | 28 | 77.8 | 64.2–91.4 | 56.6 | 17.9–95.3 | 24 | 66.7 | 51.3–82.1 | 18.4 | 14.8–21.9 | 14 | 38.9 | 23–54.8 | 14.0 | 11.3–16.7 | 8 | 22.2 | 8.6–35.8 | 11.5 | 9.5–13.5 | |
| Sinalaran | 32 | 7.8 | 4 | 12.5 | 1.0–24.0 | 4.8 | 0–11.9 | 23 | 71.9 | 56.3–87.5 | 46.1 | 19.8–72.4 | 25 | 78.1 | 63.8–92.4 | 18.3 | 14.7–21.9 | 22 | 68.8 | 52.7–84.8 | 14.0 | 12.6–15.3 | 8 | 25.0 | 10.0–40.0 | 11.6 | 8.7–14.4 | |
| Cangcahipos | 31 | 7.5 | 22 | 71.0 | 55.0–86.9 | 33.6 | 0–68.9 | 27 | 87.1 | 75.3–98.9 | 177.0 | 53.6–300.5 | 23 | 74.2 | 58.8–89.6 | 27.4 | 21.1–33.7 | 15 | 48.4 | 30.8–66 | 17.1 | 12.8–21.4 | 13 | 41.9 | 24.6–59.3 | 12.2 | 9.4–15.1 | |
| Simora- Laoang | 29 | 7.0 | 10 | 34.5 | 17.2–51.8 | 40.8 | 0–92.3 | 22 | 75.9 | 60.3–91.4 | 132.2 | 24.8–239.5 | 19 | 65.5 | 48.2–82.8 | 26.4 | 20.2–32.6 | 16 | 55.2 | 37.1–73.3 | 14.1 | 11.3–17.0 | 8 | 27.6 | 11.3–43.9 | 14.2 | 11.1–17.3 | |
| La Perla | 28 | 6.8 | 4 | 14.3 | 1.3–27.2 | 6.8 | 0–13.8 | 23 | 82.1 | 68–96.3 | 25.3 | 8.8–41.9 | 20 | 71.4 | 54.7–88.2 | 17.6 | 14.5–20.6 | 14 | 50.0 | 31.5–68.5 | 11.9 | 10.6–13.1 | 7 | 25.0 | 9.0–41.0 | 10.9 | 8.2–13.6 | |
| Bobolosan | 19 | 4.6 | 2 | 10.5 | 0–24.3 | 3.0 | 1.1–4.9 | 15 | 78.9 | 60.6–97.3 | 29.3 | 7.6–51.1 | 10 | 52.6 | 30.2–75.1 | 19.0 | 15.0–22.9 | 8 | 42.1 | 19.9–64.3 | 13.1 | 11.0–15.2 | 5 | 26.3 | 6.5–46.1 | 12.8 | 10.9–14.6 | |
| Campedico | 18 | 4.4 | 7 | 38.8 | 16.4–61.4 | 16.9 | 4.0–29.7 | 13 | 72.2 | 51.5–92.9 | 98.2 | 31.4–20.3 | 13 | 72.2 | 51.5–92.9 | 26.4 | 20.3–32.4 | 11 | 61.1 | 38.6–83.6 | 13.6 | 11.0–16.3 | 5 | 27.8 | 7.1–48.5 | 14.4 | 11.9–16.8 | |
| Manajao | 16 | 3.9 | 2 | 12.5 | 0–28.7 | 27.3 | 0–74.4 | 13 | 81.3 | 62.1–100.4 | 52.2 | 0–117.6 | 11 | 68.8 | 46.0–91.5 | 26.6 | 20.0–33.1 | 9 | 56.3 | 31.9–80.6 | 13.9 | 10.9–16.9 | 3 | 18.8 | 0–37.9 | 11.7 | 7.9–15.5 | |
| Oleras | 12 | 2.9 | 1 | 8.3 | 0–24.0 | 1.0 | _ | 8 | 66.7 | 40–93.3 | 19.7 | 6.9–32.6 | 6 | 50.0 | 21.7–78.3 | 17.2 | 11.9–22.4 | 5 | 41.7 | 13.8–69.6 | 10.6 | 6.7–14.5 | 2 | 16.7 | 0–37.8 | 11.5 | 0–30.6 | |
| Laniwan | 11 | 2.7 | 2 | 18.2 | 0–41.0 | 22.0 | 0–61.2 | 9 | 81.8 | 59–104.6 | 58.4 | 0–128.3 | 10 | 90.9 | 73.9–107.9 | 22.0 | 14.8–29.2 | 5 | 45.5 | 16–74.9 | 13.0 | 9.38–16.6 | 3 | 27.3 | 1.0–53.6 | 13.0 | 5.5–20.5 | |
| Nipa | 10 | 2.4 | 3 | 30.0 | 1.6–58.4 | 5.7 | 1.1–10.2 | 5 | 50.0 | 19–81 | 50.0 | 0–109.9 | 6 | 60.0 | 29.6–90.4 | 21.8 | 16.6–27.0 | 6 | 60.0 | 29.6–90.4 | 13.9 | 7.9–19.8 | 1 | 10.0 | 0–28.6 | 14.0 | _ | |
| Simora– Palapag | 9 | 2.2 | 2 | 22.2 | 0–49.4 | 1.5 | 0.5–2.5 | 5 | 55.6 | 23.1–88 | 25.8 | 0–56.6 | 6 | 66.7 | 35.9–97.5 | 24.2 | 15.1–33.2 | 1 | 11.1 | 0–31.6 | 10.0 | _ | 2 | 22.2 | 0–49.4 | 7.5 | 0–39.3 | |
| Jangtud | 8 | 1.9 | 3 | 37.5 | 4.0–71.0 | 1.3 | 0–4.7 | 8 | 100.0 | _ | 31.5 | 13.6–49.4 | 7 | 87.5 | 64.6–110.4 | 22.6 | 17.7–27.4 | 3 | 37.5 | 4–71 | 17.0 | 0–34.4 | 0 | 0.0 | _ | 0.0 | _ | |
| Mabaras | 8 | 1.9 | 5 | 62.5 | 29.0–96.0 | 39.4 | 0–86.1 | 5 | 62.5 | 29–96 | 334.0 | 0–831.3 | 5 | 62.5 | 29–96 | 34.8 | 18.9–50.7 | 5 | 62.5 | 29–96 | 18.4 | 13.9–22.9 | 3 | 37.5 | 4.0–71.0 | 14.7 | 7.5–21.8 | |
| Paysud | 7 | 1.7 | 1 | 14.3 | 0–40.2 | 1.0 | _ | 6 | 85.7 | 59.8–111.6 | 14.7 | 3.6–25.8 | 6 | 85.7 | 59.8–111.6 | 14.9 | 8.2–21.5 | 4 | 57.1 | 20.5–93.8 | 4.1 | 0.4–7.9 | 2 | 28.6 | 0–62.0 | 14.5 | 0–58.9 | |
| Sangay | 6 | 1.5 | 2 | 33.3 | 0–71.1 | 1.5 | 0.5–2.5 | 6 | 100.0 | _ | 39.8 | 6.6–73.0 | 4 | 66.7 | 28.9–104.4 | 10.2 | 0–20.3 | 2 | 33.3 | 0–71.1 | 14.5 | 0–58.9 | 1 | 16.7 | 0–46.5 | 11.0 | _ | |
| Bangon | 3 | 0.7 | 1 | 33.3 | 0–86.7 | 1.0 | _ | 3 | 100.0 | _ | 63.3 | 0–267.0 | 3 | 100.0 | _ | 16.7 | 4.2–29.2 | 1 | 33.3 | 0–86.7 | 13.0 | _ | 0 | 0.0 | _ | 0.0 | _ | |
Abbreviations: ddPCR, droplet digital polymerase chain reaction; KK, Kato-Katz fecal smear test; F_ddPCR, fecal ddPCR; SR_ddPCR, serum ddPCR; U_ddPCR, urine ddPCR; SL_ddPCR, saliva ddPCR; EPG, eggs per 1 gram of stool; CNI, gene copy number index.
Prevalence and Infection Intensity
S. japonicum prevalence across the 18 barangays was significantly higher when determined by F_ddPCR (74.5%; McNemar’s test, P < .0001), SR_ddPCR (67.2%; McNemar’s test, P < .0001), and U_ddPCR (47.6%; McNemar’s test, P < .0001) than by the KK test (26.2%; 95% CI, 22.0%–30.5%) or SL_ddPCR (25.5%; 95% CI, 21.3%–29.7%) (Table 1).
Infection prevalence determined by the KK was significantly higher among males (χ2, P = .004); infection intensities with KK (Mann-Whitney, P < .0001), F_ddPCR (Mann-Whitney, P < .0001), and SR_ddPCR (Mann-Whitney, P < .019) were also significantly higher among males. However, there were no significant differences between males and females in infection intensity with U_ddPCR or infection prevalence with all 4 ddPCRs.
Infection prevalence was highest in Cangcahipos barangay determined by KK (71.0%; 95% CI, 55.0%–86.9%) and with F_ddPCR (87.1%; 95% CI, 75.3%–98.9%)(Table 1). Infection intensities with F_ddPCR, SR_ddPCR, and U_ddPCR across different barangays varied significantly (Kruskal-Wallis, P < .001). There were no significant variations in prevalence or intensity of infection across age categories (Table 1).
Measures of Test Accuracy
Sensitivity, specificity, negative predictive value and positive predictive value were calculated using KK and F_ddPCR separately as the standard reference test (Figure 2). With KK as the reference, the F_ddPCR and SR_ddPCR tests had high sensitivity (98%; 95% CI, 94%–100% and 94%; 95% CI, 88%–97%, respectively), but low specificity (34%; 95% CI, 29%–39% and 42%; 95% CI, 37%–48%, respectively). The highest specificity using KK as the reference was obtained with the SL_ddPCR (80%; 95% CI, 75%–84%), but it had lower specificity (40%; 95% CI, 31%–49%) than any other test. The sensitivity and specificity of the SR_ddPCR and U_ddPCR were higher when the KK was replaced by the F_ddPCR as reference test (Figure 2). Sensitivity of the SL_ddPCR was lower (26%; 95% CI, 22%–32%) when F_ddPCR was used as the reference, and specificity (77%; 95% CI, 68%–84%) did not change significantly.
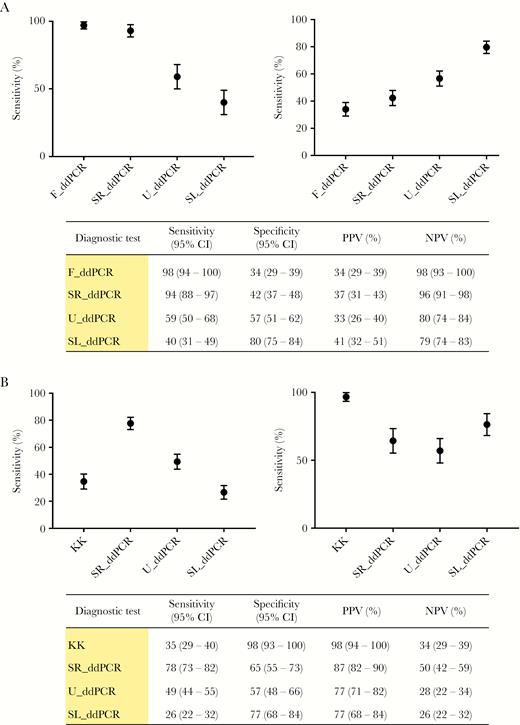
A, Measures of test accuracy with the KK procedure as the reference test. Error bars represent 95% confidence limits. B, Measures of test accuracy using the F_ddPCR as the reference test. Error bars represent 95% confidence limits. Abbreviations: PPV, positive predictive value; NPV, negative predictive value; CI, confidence interval; KK, Kato-Katz fecal smear test; ddPCR, droplet digital polymerase chain reaction; F_ddPCR, fecal ddPCR; SR_ddPCR, serum ddPCR; U_ddPCR, urine ddPCR; SL_ddPCR, saliva ddPCR.
Infection Intensity
The overall average CNI was highest with the F_ddPCR (63.2; 95% CI, 46.9–79.5) and lowest with the SL_ddPCR (12.4; 95% CI, 11.8–12.9) (Figure 3A). The rank order of diagnostic sensitivity and the average CNI of the 4 different body fluids tested with the ddPCRs followed the same order (Figure 3B).
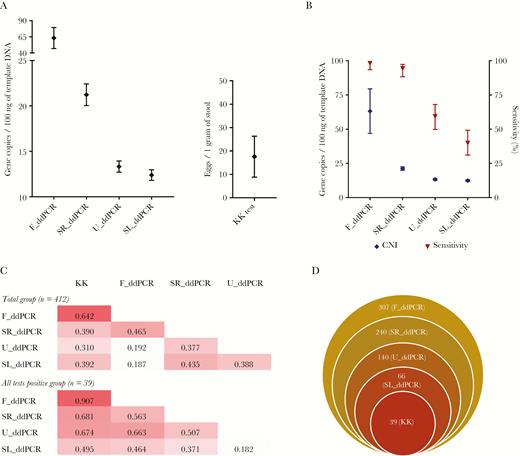
A, Intensity of infection in terms of different ddPCR copy number indices and eggs per gram from the KK test. Error bars represent 95% confidence limits. B, The rank order of the average copy number (CNI) and diagnostic sensitivity (compared to the KK) of the ddPCR tests. Error bars represent 95% confidence limits. C, Correlation matrices between each test analyzed as the total group (n = 412) and as all 5 tests positive group (n = 39). Values represent the Pearson correlation coefficient. D, Stacked Venn diagram showing the agreement of the 5 diagnostic tests. The values indicate the number of positive samples in each category. Abbreviations: ddPCR, droplet digital polymerase chain reaction; KK, Kato-Katz fecal smear test; F_ddPCR, fecal ddPCR; SR_ddPCR, serum ddPCR; U_ddPCR, urine ddPCR; SL_ddPCR, saliva ddPCR.
Categories of Infection Intensity
Based on the World Health Organization (WHO) categorization of schistosome infection severity and previous studies, the cut-off EPGs for low, medium, and high groups were: 1–100, 101–400, and >400 respectively [30, 31]. However, none of the 108 KK-positive cases in this study had an EPG of more than 400. Therefore, the category cut-offs were adjusted (discussed further below) to enable comparison of 3 infection intensity groups as low, medium, and high. The ddPCR intensity category cut-offs were obtained by examining the range of copy number values for each of the F_ddPCR, SR_ddPCR, U_ddPCR, and SL_ddPCR tests within each KK intensity category. For example, within the low KK category the range for F_ddPCR CNI was set as cut-offs for the F_ddPCR low category, and so on for the medium and high categories for each of the ddPCR tests (Tables 2 and 3).
Categories of Infection Intensity By Different Diagnostic Tests
| Test | Infection intensitya | ||
| Low | Medium | High | |
| KK | ≤ 149 | 150–299 | ≥ 300 |
| F_ddPCR | ≤ 699 | 700–1199 | ≥ 1200 |
| SR_ddPCR | ≤ 39 | 40–59 | ≥ 60 |
| U_ddPCR | ≤ 19 | 20–39 | ≥ 40 |
| SL_ddPCR | ≤ 14 | 15–19 | ≥ 20 |
| Test | Infection intensitya | ||
| Low | Medium | High | |
| KK | ≤ 149 | 150–299 | ≥ 300 |
| F_ddPCR | ≤ 699 | 700–1199 | ≥ 1200 |
| SR_ddPCR | ≤ 39 | 40–59 | ≥ 60 |
| U_ddPCR | ≤ 19 | 20–39 | ≥ 40 |
| SL_ddPCR | ≤ 14 | 15–19 | ≥ 20 |
aEggs per 1 gram of stool (EPG) for KK test and target gene copy number per 100 ng of DNA (CNI) for ddPCR. Abbreviations: ddPCR, droplet digital polymerase chain reaction; KK, Kato-Katz fecal smear test; F_ddPCR, fecal ddPCR; SR_ddPCR, serum ddPCR; U_ddPCR, urine ddPCR; SL_ddPCR, saliva ddPCR; CNI, gene copy number index.
Distribution of Test-Positive Cases Across Intensity Categories
| Test | Number of positive cases (%)a | |||
| Low | Medium | High | Total | |
| KK | 105 (25.49) | 2 (0.49) | 1 (0.24) | 108 (26.21) |
| F_ddPCR | 303 (73.54) | 3 (0.73) | 1 (0.24) | 307 (74.51) |
| SR_ddPCR | 253 (61.41) | 22 (5.34) | 2 (0.49) | 277 (67.23) |
| U_ddPCR | 175 (42.48) | 20 (4.85) | 1 (0.24) | 196 (47.57) |
| SL_ddPCR | 85 (20.63) | 17 (4.13) | 3 (0.73) | 105 (25.49) |
aPercentage out of the total (n = 412). Abbreviations: ddPCR, droplet digital polymerase chain reaction; KK, Kato-Katz fecal smear test; F_ddPCR, fecal ddPCR; SR_ddPCR, serum ddPCR; U_ddPCR, urine ddPCR; SL_ddPCR, saliva ddPCR.
Kappa Statistics
Kappa statistics were tested for the total study sample and the subset from which all 5 tests were positive. In each of these 2 categories the intensities (low, medium, and high) from the different tests were compared within the KK, F_ddPCR and SR_ddPCR positive groups (Figure 4). KK and F_ddPCR had the highest agreement on positives. All tests had a higher agreement with F_ddPCR than KK. Agreement of U_ddPCR and SL_ddPCR was higher when compared with SR_ddPCR positives compared with using the KK or F_ddPCR (Figure 4). Moreover, of the 307 F_ddPCR positive cases, 240 (78.2%), 140 (45.6%), 66 (21.5%), and 39 (12.7%) were positive with the SR_ddPCR, U_ddPCR, SL_ddPCR, and KK, respectively (Figure 3D).
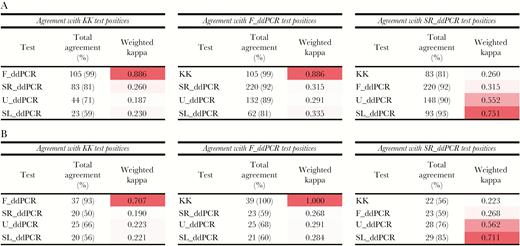
Agreement statistics (Kappa index) of the 5 tests with the KK, F_ddPCR, and SR_ddPCR, based on intensity categories. A, Agreement statistics for the total group (n = 412). B, Agreement statistics for all 5 tests positive group (n = 39). Abbreviations: KK, Kato-Katz fecal smear test; ddPCR, droplet digital polymerase chain reaction; F_ddPCR, fecal ddPCR; SR_ddPCR, serum ddPCR; U_ddPCR, urine ddPCR; SL_ddPCR, saliva ddPCR.
Correlation Analysis
EPG and CNI values were compared by Pearson correlation analysis (Y = log10 [Y+1]) in 2 groups: as the entire study sample (n = 412) and those subjects who were positive with all 5 tests (n = 39). The highest correlation occurred between the KK and F_ddPCR (r = 0.642 all samples; r = 0.907 positive all tests) (Figure 3C). High correlations were obtained for SR_ddPCR with SL_ddPCR, and with U_ddPCR (Figure 3C).
DISCUSSION
Elimination of schistosomiasis, including the prevention of re-emergence, remains a challenge due to limitations in available diagnostics [8, 9, 28, 32–34] so that improved tests are required to monitor schistosomiasis control efforts. Here we verified a ddPCR-based assay and confirmed high human schistosomiasis japonica prevalence in Northern Samar, the Philippines, reported previously using molecular tools [4, 35]. This region is considered moderately endemic for schistosomiasis with a high probability of reinfection of both humans and animals [5, 28, 35]. Ongoing mass drug administration will result in lower levels of infection intensity, making detection of infected individuals difficult by the KK, although transmission will continue [6, 36].
Here we assessed the feasibility of using conveniently obtained clinical samples to detect individuals infected with S. japonicum. Previously, using the murine model of schistosomiasis, we showed the value of a duplex-ddPCR assay incorporating the mitochondrial nad1 gene and the retrotransposon, SjR2. In contrast to SjR2 retrotransposon amplification, the nad1 gene correlated well with parasite burden [16]. Accordingly, we used the nad1 gene as the target for the ddPCR in the clinical validation of the assay as quantification of the infection was an added benefit. The F_ddPCR, SR_ddPCR, and U_ddPCR exhibited higher levels of sensitivity than the KK. Saliva is the most convenient for testing but the SL_ddPCR exhibited a low level of sensitivity, slightly lower than the triplicate KK (Figure 2).
Measures of test accuracies were calculated twice, using the KK and the F_ddPCR as reference tests, as an absolute gold standard for schistosomiasis diagnosis is not available (Figure 2). The KK procedure is often used as the gold standard but it lacks sensitivity and the F_ddPCR exhibited the highest sensitivity among all the ddPCRs using the KK as reference. Specificities of the fecal, serum, and urine ddPCRs were low when the KK was used as the reference test, as sensitive detection of a positive case was considered a false positive by the KK. When F_ddPCR was used as reference test, the SR_ddPCR and U_ddPCR had improved specificity and consistent sensitivity values. The sensitivity of the SL_ddPCR was lower than the KK even when the F_ddPCR was employed as reference, indicating the limitation of using saliva for the detection of parasite cfDNA. The ddPCRs were all performed on a single clinical sample of feces, saliva, serum, or urine from each individual, whereas the KK procedure utilized two separately collected fecal samples each tested in triplicate, emphasizing the logistical inconvenience and, with the exception of the SL_ddPCR, the low sensitivity of the KK compared with the ddPCRs. The significant differences observed between the KK and ddPCRs in diagnostic performance and accuracy highlight the value of developing techniques with appropriate sensitivity. The rank order of diagnostic sensitivity and the average CNI of the 4 ddPCRs followed the same order, which indicates that sensitivity correlated with the distribution of S. japonicum DNA in the different body compartments.
The concept of target gene CNI was introduced here as a direct molecular measure of parasite burden, similar to EPG determined by the KK. As it is possible to determine the absolute target copy number with ddPCR [16, 27], the value can be converted to CNI, which would be an alternative tool for quantification, rather than trying to convert the molecular quantities back to EPG. The CNI value is convenient to apply and is especially important when it comes to analysing ddPCR results obtained with serum, urine, and saliva where the source of S. japonicum parasite DNA would not only originate from eggs deposited in tissues, but also from adult worms and schistosomula, whereas the F_ddPCR detects primarily egg DNA [20]. The highest average CNI was obtained with feces, and the best association was between the F_ddPCR CNI and the KK results, which is likely due to S. japonicum DNA directly isolated from eggs present in feces. The lowest CNI was obtained with S. japonicum DNA present in saliva and this source also resulted in the lowest sensitivity.
The degree of agreement of S. japonicum infection intensity determined by the SR_ddPCR was relatively high with the urine and saliva ddPCRs compared with the F_ddPCR, suggesting an unequal distribution of parasite cfDNA in different body fluids. Because adult schistosomes live in direct contact with blood in the mesenteric veins, it would seem logical to detect higher levels of parasite cfDNA in serum than in urine or saliva. However, the precise mechanisms whereby cfDNA is distributed in different body fluids remain unknown [20]. Therefore, nonfecal ddPCR assays cannot be directly compared with the KK as ddPCR is able to diagnose egg-negative, but infected individuals, and very light infections, while the KK procedure is absolutely dependent on the presence of relatively high numbers of eggs. While morbidity is not significant when infection does not result in eggs, it is extremely important to detect all KK-negative cases in order to reach elimination targets. Assays for cfDNA detection as well as worm antigen-based serological assays will likely play a key role in this regard [9, 16, 20].
A single collection of urine or saliva is more expedient than collecting 2 fecal samples at different times (for the KK) [37], which can affect compliance. Moreover, DNA extraction from filtered urine sediments could further improve the logistics and convenience of the test [38]. Collection of a blood sample is invasive but as this procedure is often required as routine clinical practice for obtaining blood counts and for biochemical analysis, obtaining a serum sample would be relatively convenient. This would be particularly valuable in situations where confirmation of diagnosis is required following clinical suspicion, such as in a returning traveller from a schistosomiasis-endemic area or in the case of emergent schistosomiasis in a previously nonendemic area [39–41]. Further, dry blood spots following a finger prick have been used in molecular analysis, representing a cheaper and less invasive alternative to serum collection [42, 43]. In addition to the current application with S. japonicum, the use of urine in a ddPCR assay would be of value in the diagnosis of Schistosoma haematobium infection as an improvement on current urine-based PCRs [44, 45].
The current ddPCR assay could prove an important tool in community diagnosis as well as in secondary surveys in screening of KK-negative cases. This would also be helpful in assessing the effectiveness of control measures against schistosomiasis in animals, for surveillance of infected snails, and for monitoring environmental sources such as water for the presence of cercariae, similar to other molecular tests used for such purposes [46, 47]. Like most other molecular techniques, ddPCR has some limitations as a routine diagnostic method, including the high overall cost of equipment and reagents, requirement for trained personal, and difficulties in establishing directly in the field. Nevertheless, as this new ddPCR technology matures, these limitations, costs in particular, are likely to reduce [4, 48–50].
In conclusion, the F_ddPCR, SR_ddPCR, and U_ddPCR exhibited high performance in determining S. japonicum infection prevalence, and facilitated the identification of infected individuals from the study area who were KK-negative, highlighting the value of a more sensitive diagnostic method than copromicroscopy. High sensitivity, early diagnosis, the ability to quantify infection intensity, and the capability to use noninvasive clinical samples in the assay have clear practical significance enabling a new tool for improved surveillance and much needed assistance to reach schistosomiasis elimination goals. Despite its current cost, inherent to most molecular diagnostics, this assay provides a valuable tool for detecting low prevalent/intensity infections, for monitoring schistosomiasis control programs, case detection in travellers returning from schistosome-endemic areas, and in animal and environmental surveillance of schistosomiasis.
Notes
Acknowledgements. We sincerely thank the members of the Immunology Laboratory at the Research Institute for Tropical Medicine, Manila, and regional staff from the Palapag and Laoang regions for their support and work, and also all the study participants. We thank Professor Kenneth Beagley, Dr Alison Carey, and Emily Bryan (Institute of Health and Biomedical Innovation, Queensland University of Technology, Brisbane, Australia) for their help with the use of AutoDG™ instrument. We also acknowledge the help of Susan List-Armitage and Nadine Shulz (Scientific services, QIMRB) in using ChemagicTM 360 instrument. We thank Madeleine Flynn, QIMRB, for her help with preparing the map of the study region.
Financial support. This work was supported by the National Health and Medical Research Council (NHMRC) of Australia (grant numbers: ID613671, APP1037304, APP1098244). D.P.M. is the recipient of the grants, and is a NHMRC Senior Principal Research Fellow and Senior Scientist at QIMRB.
Potential conflicts of interest. All authors: No reported conflicts of interest. All authors have submitted the ICMJE Form for Disclosure of Potential Conflicts of Interest. Conflicts that the editors consider relevant to the content of the manuscript have been disclosed.

