


Abstract
Monocytes and monocyte-derived macrophages promote atherosclerosis through increased inflammation and vascular remodeling. This may be especially true in chronic human immunodeficiency virus (HIV) infection.
We examined 778 women (74% HIV+) in the Women’s Interagency HIV Study and 503 men (65% HIV+) in the Multicenter AIDS Cohort Study who underwent repeated B-mode carotid artery ultrasound imaging in 2004–2013. We assessed baseline associations of the serum macrophage inflammation markers soluble (s)CD163, sCD14, galectin-3 (Gal-3), and Gal-3 binding protein (Gal-3BP) with carotid plaque formation (focal intima-media thickness >1.5 mm) over 7 years.
Marker levels were higher in HIV+ persons versus HIV– persons. Presence of focal plaque increased over time: from 8% to 15% in women, and 24% to 34% in men. After adjustment for demographic, behavioral, and cardiometabolic factors, and CRP and interleukin-6, each standard deviation increase in sCD14 was associated with increased plaque formation (risk ratio [RR] 1.24, 95% confidence interval [CI] 1.07–1.43). This pattern was consistentby sex. sCD163 was associated with plaque formation in virally suppressed HIV+ men (RR 1.52, 95% CI 1.04–2.22); Gal-3BP and Gal-3 were not associated with increased plaque.
sCD14 and sCD163 may play important roles in atherogenesis among HIV+ persons.
(.)
Human immunodeficiency virus (HIV)–infected persons have excess cardiovascular disease (CVD) risk [1, 2], in part due to a higher prevalence of traditional CVD risk factors such as cigarette smoking [3]. Even among antiretroviral therapy (ART)–treated virally suppressed persons, CVD risk remains elevated [4, 5], although better HIV and CVD care over time may have diminished the differential risk by HIV serostatus [6]. HIV-specific mechanisms of CVD, including increased inflammation, immune dysregulation, and coagulation, may explain why standard coronary risk prediction equations have underperformed when applied in HIV-infected populations [7, 8]. Higher levels of general inflammatory markers have consistently correlated with CVD burden and clinical CVD among HIV-infected persons [9–13], but the degree to which specific inflammatory and immune processes contribute to HIV-associated CVD has not been clearly established.
Numerous cellular mediators within the innate immune system are instrumental in the development of atherosclerosis. Infiltration of monocytes into arterial walls leads to atherosclerotic plaque [14]. These monocytes differentiate into macrophages, inflammatory dendritic cells, and foam cells, some of which undergo apoptosis and secondary necrosis [15]. The resulting necrotic core makes plaque vulnerable to rupture, leading to atherosclerosis progression and clinical CVD events. Innate immune system perturbations are central to HIV infection; recent studies have found that substantial innate immune activation persists even among persons with ART-induced HIV virologic suppression [16, 17]. For example, levels of serum markers of monocyte and macrophage activation, such as soluble (s) CD14 and sCD163, are increased with HIV infection [18, 19]. These markers, in turn, have been associated with mortality and CVD events among HIV-infected persons in some but not all studies [18–23]. Less is known about the role of galectins in HIV infection. Galectin-3 (Gal-3) is secreted by macrophages; promotes eosinophil, neutrophil, and monocyte adhesion and recruitment, thereby enhancing inflammation [24]; and is a known marker of heart failure prognosis [25]. Gal-3 binding protein (Gal-3BP) is a soluble marker of M1-polarized macrophages [26], which are thought to be associated with inflamed, vulnerable plaques [27]; serum Gal-3BP levels have been found to be elevated in individuals with cancer or HIV infection [28, 29].
In the Women’s Interagency HIV Study (WIHS) and Multicenter AIDS Cohort Study (MACS), we are investigating the roles of circulating biomarkers of macrophage inflammation in a study of carotid artery B-mode ultrasound to measure subclinical CVD. In cross-sectional analyses, higher levels of sCD14, sCD163, and Gal-3BP were associated with greater prevalence of focal carotid artery plaque in women [26], and sCD14 and sCD163 levels were associated with a greater prevalence of coronary artery stenosis in men [30]. In the current study, we assessed the roles of sCD14, sCD163, Gal-3BP, and Gal-3 in the progression of carotid artery atherosclerosis over a 7-year period in these 2 large cohorts. Furthermore, we examined whether these associations persist even after adjusting for levels of markers of systemic inflammation (high-sensitivity C-reactive protein [hsCRP] and interleukin-6 [IL-6]). We also assessed whether the strength of such associations is modified by HIV RNA levels, CD4+ T-cell count, and hepatitis C virus (HCV) infection, because these may interact in the pathogenesis of atherosclerosis. Finally, we determined whether levels of these markers improve the ability to predict new focal plaque formation among HIV-infected individuals compared to the use of traditional CVD risk factors and hsCRP and IL-6 levels alone.
METHODS
Setting and Inclusion Criteria
Participants were from 2 prospective multicenter cohort studies of individuals with or at risk for HIV infection: WIHS and MACS. Details on study design are in the Appendix [31, 32]. Briefly, each study involves semiannual follow-up visits, during which participants undergo similar detailed examinations, specimen collection, and structured interviews. Both WIHS and MACS participants were recruited to participate in a vascular disease substudy, beginning in 2004. The primary exclusion criterion was a history of coronary heart disease. All individuals provided informed consent, and studies were approved by each site’s Institutional Review Board.
Data Collection
Data for the current study were collected at a baseline visit, occurring between 2004 and 2006, and at a substudy follow-up visit that occurred on average 7 years later. Participants underwent high-resolution B-mode carotid artery ultrasound to image 6 locations in the right carotid artery: the near and far walls of the common carotid artery, carotid bifurcation, and internal carotid artery. A standardized protocol was used at all sites [33, 34]. Focal plaque measures were obtained at a centralized reading center (University of Southern California). Coefficients of variation of repeated measurements of intima-media thickness (IMT) at the common carotid artery have been published [34], and replicate image acquisition and interpretation studies were repeated to ensure consistency over time. Demographic, clinical, and laboratory variables were collected using standardized protocols at the semiannual study visits.
Outcome of Interest
To assess the progression of subclinical carotid artery atherosclerosis, we examined the formation of new focal plaque, defined as a dichotomous variable indicating whether there was an increase in the number of measured focal plaques between the baseline and subsequent vascular study visit. We defined a focal plaque as an area with localized IMT >1.5 mm at any of the 6 imaged carotid artery locations [35].
Main Exposures of Interest
Enzyme-linked immunosorbent assay (ELISA) methods were used to measure sCD14, sCD163, Gal-3 (all R&D Systems, Minneapolis, MN), and Gal-3BP (s90K/Mac-2BP; eBioscience, San Diego, CA) from stored frozen serum specimens that had been collected at the core study visit closest to the baseline vascular study visit. All assays were performed at the same facility (University of Vermont) in duplicate on single-assay product lots. Coefficients of variation were <8%, <7%, <8%, and <17% for sCD14, sCD163, Gal-3, and Gal-3BP, respectively.
Other Variables
HIV infection was ascertained by ELISA and confirmed by Western blot. Demographic and behavioral variables included age, race/ethnicity, income, education, current smoking, history of injection drug use, current crack/cocaine and alcohol use, and HCV infection (based on antibody or viral RNA testing). Cardiometabolic risk factors included body mass index (BMI), systolic blood pressure, total and high-density lipoprotein cholesterol, current use of antihypertensive and lipid-lowering medications, history of diabetes mellitus, and estimated glomerular filtration rate (eGFR) [36]. Levels of 2 well-established markers of systemic inflammation, hsCRP and IL-6, were also considered. The marker hsCRP was measured using a nephelometric immunoassay (Quest, Madison, NJ). IL-6 was measured with a multiplex assay by electrochemiluminescence (Meso Scale Discovery, Rockville, MD).
We defined persistent virologic suppression as consistent plasma HIV RNA levels <80 copies/mL (WIHS) or <50 copies/mL (MACS) simultaneous with continuous ART use over the study period [26]. Other HIV characteristics included baseline CD4+ lymphocyte count (500+, 350–499, 200–349, <200 cells/μL), nadir CD4+ count, and baseline HIV RNA level.
Statistical Methods
Within each cohort, we compared characteristics and biomarker levels by HIV serostatus. We used Poisson regression with robust variance estimation to assess new focal plaque formation in the combined HIV-infected and uninfected population based on levels of each biomarker. We log-transformed marker levels that were not normally distributed, and scaled each marker by z score transformation to report results using a common unit. In nested models, we serially adjusted for (1) HIV serostatus, (2) demographic characteristics and behavioral characteristics, (3) hsCRP and IL-6, and (4) cardiometabolic risk factors. We also examined these associations in analyses limited to HIV-infected persons and to virally suppressed HIV-infected persons. We assessed effect modification based on a set of prespecified variables related to viral infection: (1) HIV infection, (2) HIV RNA level at baseline, (3) persistent HIV virologic suppression, (4) CD4+ count at baseline, (5) nadir CD4+ count, and (6) presence of HCV infection. To assess the predictive value of each marker on subclinical carotid artery disease beyond the contribution of traditional CVD risk factors and hsCRP and IL-6 levels, we determined C-statistics based on logistic regression.
Models were first developed within each cohort. After comparing the directionality of associations in cohort-specific analyses, we combined cohorts when results were qualitatively similar. We confirmed the validity of combining cohorts by assessing the cohort-covariate interaction terms. We report both cohort-specific and combined results.
Analyses were conducted using SAS 9.3 and R 3.1.0 software. We determined statistical significance by a 2-sided P value <.05. We used IVEware software to implement multiple imputation (5 imputation datasets) based on multivariate sequential regression to account for the 1.2% of values that were missing [37].
RESULTS
Participant Characteristics
There were 778 WIHS women (73% HIV infected) and 535 MACS men (68% HIV infected) who completed the follow-up phase of the carotid artery substudy. After we excluded 32 individuals because serum specimens were unavailable, 1 281 remained. Median follow-up time to assess new focal plaque was 6.5 years for women and 7 for men. Median age at the baseline vascular study visit was higher in men (48 years) than in women (40) (Table 1). HIV-infected and uninfected groups were generally similar, although HIV-infected participants were more likely to have previously injected drugs and be coinfected with HCV. The majority of HIV-infected individuals reported using highly active ART at baseline. WIHS women were more likely to be of black race or Hispanic ethnicity than MACS men (91% vs 34%). At baseline, WIHS women were more likely than men to report current smoking (47% vs 32%), have higher BMI (median 28.3 vs 25.4 kg/m2), and to have a history of diabetes (20% vs 9%). MACS men had higher systolic blood pressures (median 123 vs 115 mmHg) and total cholesterol (median 194 vs 175 mg/dL), and were more likely to use lipid-lowering medications (26% vs 5%). The presence of focal carotid artery plaque increased from 8% at baseline to 15% after follow-up in WIHS women and from 24% to 34% in MACS men, and the formation of new plaque was greater in both groups among HIV-infected participants than among uninfected participants.
Study Population Characteristics, by Cohort and HIV Sserostatus
| Characteristic | Women’s Interagency HIV Study (WIHS) | Multicenter AIDS Cohort Study (MACS) | ||
|---|---|---|---|---|
| HIV+ (N = 571) % or median (IQR) | HIV– (N = 207) % or median (IQR) | HIV+ (N = 335) % or median (IQR) | HIV– (N = 168) % or median (IQR) | |
| Demographic characteristics | ||||
| Age at baseline vascular study visit, years (median, IQR) | 40 (35–46) | 40 (34–46) | 47 (44–52) | 51 (46–56) |
| Race/ethnicity | ||||
| Black (non-Hispanic) | 60 | 67 | 32 | 23 |
| Hispanic | 30 | 26 | 4 | 7 |
| White (non-Hispanic) | 8 | 6 | 58 | 68 |
| Other | 2 | 1.5 | 6 | 2 |
| Income | ||||
| <$30000/year | 85 | 85 | 50 | 38 |
| ≥$30000/year | 15 | 15 | 50 | 63 |
| Education (at study entry) | ||||
| Did not complete high school | 43 | 34 | 9 | 4 |
| Completed high school | 28 | 33 | 14 | 13 |
| Some college or completed college | 28 | 32 | 56 | 44 |
| Attended/completed graduate school | 1 | 1 | 22 | 39 |
| Behavior-related characteristics | ||||
| History of injection drug use | 27 | 23 | 8 | 3 |
| Current crack/cocaine use | 6 | 15 | 15 | 9 |
| Current alcohol use | ||||
| Abstainer | 55 | 39 | 21 | 10 |
| Light (<3 drinks/week, WIHS; 1–3, MACS) | 35 | 41 | 56 | 51 |
| Moderate (3–13 drinks/week, WIHS; 4–13 MACS) | 8 | 13 | 20 | 29 |
| Heavier (≥14 drinks/week) | 2 | 7 | 3 | 10 |
| History of hepatitis C infection | 30 | 22 | 16 | 7 |
| Metabolic risk factors | ||||
| Current smoker | 45 | 55 | 35 | 26 |
| Body mass index, kg/m2 (median, IQR) | 27.8 (24.3–32.1) | 30.8 (25.5–37.7) | 25.0 (22.6–28.0) | 25.9 (23.5–28.2) |
| Systolic blood pressure, mmHg (median, IQR) | 115 (106–126) | 116 (107–128) | 122 (115–131) | 125 (117–132) |
| Total cholesterol, mg/dL (median, IQR) | 175 (149–201) | 179 (155–204) | 188 (162–219) | 200 (176–229) |
| HDL cholesterol, mg/dL (median, IQR) | 46 (37–57) | 52 (43–65) | 42 (35–52) | 49 (42–56) |
| Current use of antihypertensive medications | 19 | 15 | 23 | 21 |
| Current use of lipid-lowering medications | 6 | 2 | 30 | 18 |
| History of diabetes | 19 | 25 | 11 | 7 |
| HIV-specific characteristics | ||||
| Baseline CD4+ T-cell count, cells/µL (median, IQR) | 450 (289–657) | 529 (364–698) | ||
| Baseline HIV-1 viral load, copies/mL (median, IQR) | 180 (80–6700) | 40 (40–1230) | ||
| Undetectable baseline HIV-1 viral load | 45 | 63 | ||
| History of clinical AIDS | 35 | 12 | ||
| Highly active ART use in past 6 months | 68 | 80 | ||
| Cumulative exposure of ART, years (median, IQR)a | 4 (3–6.5) | 5.8 (3.4–7.7) | ||
| of PIs, years (median, IQR) | 2.5 (0.5–5) | 4.0 (0.2–6.8) | ||
| of NNRTIs, years (median, IQR) | 1.5 (0–3) | 2.0 (0.3–4.6) | ||
| of NRTIs, years (median, IQR) | 6 (3–9) | 7.5 (4.7–10.1) | ||
| Nadir CD4+ T-cell count before ART use, cells/µL (median, IQR)a | 281 (160–413) | 280 (156–393) | ||
| Outcome-related characteristics | ||||
| Presence of plaque at baseline | 8 | 8 | 24 | 24 |
| Presence of plaque after follow-up | 16 | 10 | 36 | 30 |
| Formation of new focal plaque(s) during study (median 1 plaque, IQR: 1–2) | 12 | 8 | 26 | 15 |
All characteristics assessed at baseline unless otherwise noted.
Abbreviations: ART, antiretroviral therapy; HIV, human immunodeficiency virus; IQR, interquartile range; NNRTI, non-nucleoside reverse transcriptase inhibitor; NRTI, nucleoside reverse transcriptase inhibitor; PI, protease inhibitor.
aAmong those using ART at baseline.
Monocyte and Macrophage Markers
Overall, levels of sCD14, sCD163, Gal-3BP, and Gal-3 were moderately correlated (Spearman’s r range, 0.22—0.54) with sCD163 and Gal-3BP having the highest pairwise correlation (r = 0.56 in WIHS women, 0.44 in MACS men). Each marker was also correlated with hsCRP and IL-6, but in general these correlations were weak (range 0.04—0.17 with hsCRP, 0.19—0.22 with IL-6). Marker levels were higher among women than men, with the exception of sCD14 levels, which were similar in each cohort.
Table 2 shows the median levels of sCD14, sCD163, Gal-3BP, Gal-3, hsCRP, and IL-6 by HIV serostatus, both within each cohort and combined. In unadjusted comparisons combining both cohorts, HIV-infected participants had significantly higher levels of each biomarker compared with HIV-uninfected participants (all P < .05). In analyses stratified by cohort, these significant associations persisted, except for levels of Gal-3 for which an association with HIV was apparent only among MACS men. Among HIV-infected participants, the levels of each marker were moderately correlated at baseline with CD4+ count (range –0.09 to –0.31) and HIV RNA level (range 0.05–0.39), with the strongest correlations with each reported for sCD163.
Levels of Serum Markers of Inflammation, by Cohort and HIV Serostatus
| Serum Markers | Women’s Interagency HIV Study (WIHS) | Multicenter AIDS Cohort Study (MACS) | WIHS and MACS Combined | ||||||
|---|---|---|---|---|---|---|---|---|---|
| HIV+ (N = 571) | HIV– (N = 207) | HIV+ (N = 335) | HIV– (N = 168) | HIV+ (N = 906) | HIV–(N = 375) | ||||
| Median (IQR) | Median (IQR) | P Value | Median (IQR) | Median (IQR) | P Value | Median (IQR) | Median (IQR) | P Value | |
| Soluble CD14 (ng/mL) | 2,061 (1,702–2,421) | 1,657 (1,463–1,972) | <.001 | 2,117 (1,790–2,416) | 1,678 (1,516–1,890) | <.001 | 2,084 (1,746–2,417) | 1,664 (1,472–1,934) | <.001 |
| Soluble CD163 (ng/mL) | 903 (657–1,180) | 628 (485–855) | <.001 | 727 (523–1,001) | 576 (454–726) | <.001 | 838 (600–1,129) | 604 (475–809) | <.001 |
| Galectin-3 binding protein (μg/mL) | 11.8 (7.0–20.2) | 8.0 (5.4–14.3) | <.001 | 6.3 (4.0–10.5) | 4.2 (2.7–5.8) | <.001 | 9.3 (5.5–16.8) | 5.7 (3.6–9.9) | <.001 |
| Galectin-3 (ng/mL) | 8.9 (7.3–11.6) | 8.9 (7.1–10.7) | .23 | 8.5 (7.1–10.4) | 8.1 (6.8–9.7) | .04 | 8.7 (7.2–10.9) | 8.4 (6.9–10.2) | .01 |
| High-sensitivity C-reactive protein (μg/mL) | 2.2 (0.8–5.3) | 3.3 (0.9–7.4) | .005 | 1.2 (0.6–2.8) | 1.0 (0.5–1.8) | .04 | 1.8 (0.7–4.3) | 1.8 (0.8–5.2) | .43 |
| Interleukin-6 (pg/mL) | 0.9 (0.6–1.5) | 1.0 (0.7–1.7) | .07 | 0.9 (0.6–1.5) | 0.8 (0.5–1.3) | .03 | 0.9 (0.6–1.5) | 0.9 (0.6–1.5) | .80 |
Abbreviations: HIV, human immunodeficiency virus; IQR, interquartile range.
Association of Monocyte and Macrophage Marker Levels with New Focal Plaque Formation
In unadjusted comparisons combining WIHS and MACS, participants with new focal plaque formation had significantly higher levels of sCD163 (P = .03) and sCD14 (P < .0001) at baseline (but not Gal-3BP or Gal-3) than participants without new plaque formation (Supplementary Table 1). While the unadjusted association of Gal-3BP levels with plaque formation was not statistically significant in combined analyses, the associations were significant when stratified by cohort (P = .04 in men; P = .005 in women). sCD163 was more strongly associated with new focal plaque formation in MACS men (P = .0004) than in WIHS women (P = .16).
Figure 1 shows the association of each marker with new focal plaque formation in serially adjusted models. In general, there was an increased risk of new focal plaque formation with increased levels of each marker, but the associations became attenuated as additional confounders were added to the regression models. After we controlled for HIV serostatus, demographic and behavioral characteristics, levels of hsCRP and IL-6, and cardiometabolic risk factors, only sCD14 remained significantly associated with new focal plaque formation (risk ratio [RR] 1.24 per each z score increase in sCD14, 95% CI 1.07–1.43) (Table 3). This association remained in analyses limited to each cohort, albeit with marginal statistical significance in men (WIHS: RR 1.33, 95% CI 1.04–1.71; MACS: RR 1.19, 95% CI 0.98–1.44). The association between sCD163 levels and new focal plaque formation was nearly statistically significant among MACS men (RR 1.26, 95% CI 0.99–1.61) but close to null among WIHS women. Neither Gal-3BP nor Gal-3 levels were associated with new focal plaque formation in fully adjusted analyses, either in combined or cohort-stratified analyses. Supplemental Figure 1 shows findings when regression models were limited to HIV-infected participants only, demonstrating similar associations as the overall study population. With further restriction to virally suppressed HIV-infected persons at baseline, a significant association of sCD163 with new focal plaque progression became apparent in men (RR 1.52, 95% CI 1.04–2.22) but not women (RR 1.02, 95% CI 0.64–1.61).
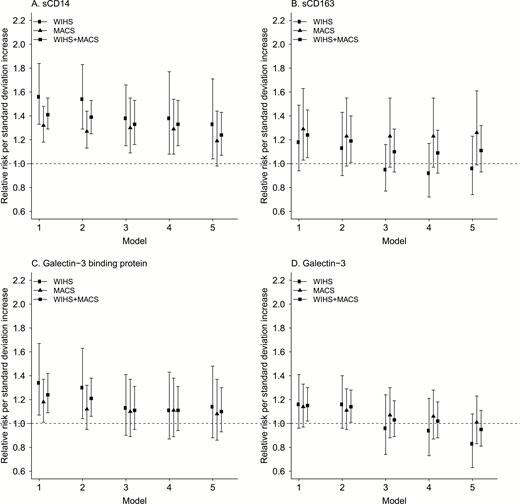
Associations between monocyte/macrophage marker levels and formation of new focal carotid artery plaque formation, overall and by cohort, for sCD14 (A), sCD163 (B), galectin-3 binding protein (C), and galectin-3 (D). Symbols represent relative risk and error bars represent 95% confidence intervals. Model 1 unadjusted; Model 2 adjusted for HIV serostatus; Model 3 additionally adjusted for age, race/ethnicity, income, education, study site, current smoking, current crack/cocaine use, current alcohol use, history of injection drug use, and history of hepatitis C virus infection; Model 4 additionally adjusted for hsCRP and IL-6; Model 5 additionally adjusted for body mass index, systolic blood pressure, total and HDL cholesterol, use of antihypertension or anticholesterol medications, history of diabetes, eGFR.
Abbreviations: eGFR, estimated glomerular filtration rate; HDL, high-density lipoprotein; hsCRP, high-sensitivity C-reactive protein; IL-6, interleukin-6.
Adjusted Associations Between Monocyte/Macrophage Markers and Formation of New Focal Carotid Artery Plaque, Overall and by Cohort
| Cohort and Marker | Risk Ratio (95% CI)a | P Value |
|---|---|---|
| Women’s Interagency HIV Study (WIHS), N events/total | 86 / 778 | … |
| Soluble CD14 | 1.33 (1.04–1.71) | .03 |
| Soluble CD163 | 0.96 (0.74–1.23) | .72 |
| Galectin-3 binding protein | 1.14 (0.88–1.48) | .31 |
| Galectin-3 | 0.83 (0.63–1.08) | .16 |
| Multicenter AIDS Cohort Study (MACS), N events/total | 112 / 503 | … |
| Soluble CD14 | 1.19 (0.98–1.44) | .08 |
| Soluble CD163 | 1.26 (0.99–1.61) | .06 |
| Galectin-3 binding protein | 1.08 (0.86–1.37) | .50 |
| Galectin-3 | 1.01 (0.83–1.23) | .91 |
| WIHS and MACS combined, N events/total | 198 / 1,281 | … |
| Soluble CD14 | 1.24 (1.07–1.43) | .005 |
| Soluble CD163 | 1.11 (0.93–1.32) | .23 |
| Galectin-3 binding protein | 1.10 (0.93–1.30) | .27 |
| Galectin-3 | 0.95 (0.81–1.11) | .51 |
Model adjusted for HIV serostatus, age, race/ethnicity, education, income, study site, history of injection drug use, crack/cocaine use, current smoking, current alcohol use, history of HCV, hsCRP, IL-6, body mass index, systolic blood pressure, total and HDL cholesterol, use of antihypertension or anticholesterol medications, history of diabetes, eGFR.
Abbreviations: CI, confidence interval; eGFR, estimated glomerular filtration rate; HCV, hepatitis C virus; HDL, high-density lipoprotein; HIV, human immunodeficiency virus; hsCRP, high-sensitivity C-reactive protein; IL-6, interleukin-6.
aRisk ratio represents the increased risk of new focal plaque formation per standard deviation increase in each biomarker. Standard deviations determined using untransformed values for sCD14 and galectin-3 and log2-transformed values for sCD163 and galectin-3 binding protein.
We examined the same associations after grouping marker levels into quartiles instead of analyzing them as Z-scores (Supplementary Table 2). Higher quartiles of sCD14 were significantly associated with new focal plaque progression in both cohorts, and higher quartiles of sCD163 were significantly associated with new focal plaque formation among MACS men.
In fully-adjusted models, neither hsCRP nor IL-6 levels were associated with new plaque formation, either in combined or cohort-stratified analyses (Supplementary Table 3).
Effect Modification by Viral Parameters
In cohort-stratified analyses, we assessed effect modification of the association between levels of each biomarker and new focal plaque formation for a set of virus-related parameters determined a priori. Among these parameters, there was suggestive evidence of an interaction based on concurrent HCV infection observed for sCD163 among women (P = .049). A stronger association between sCD163 and new plaque formation was observed among HIV/HCV-coinfected women compared to women with neither infection. We did not find a similar interaction in men (P = .47).
Predictive Ability of Monocyte and Macrophage Marker Levels
We assessed the added value of each marker in predicting plaque formation beyond the inclusion of traditional CVD risk factors and hsCRP and IL-6 levels, 2 well-established markers of systemic inflammation often used in CVD risk prediction models. While levels of each marker individually improved the prediction of plaque formation to some extent, improvement in model discrimination reached statistical significance for sCD14 only (C-statistic 0.775 vs 0.766; P = .049) (Table 4). Including all 4 markers simultaneously also statistically significantly improved the model discrimination compared with none of these markers (C-statistic 0.777 vs 0.766; P = .03), but the added benefit compared with including sCD14 alone was not statistically significant (P = .41). Similar findings were observed when assessing the role of these markers in cohort-stratified models and in models limited to HIV-infected participants, although differences did not reach statistical significance.
Receiver Operator Characteristic Results With Addition of Monocyte/Macrophage Marker Levels to Risk Prediction Models of New Focal Carotid Artery Plaque Formation
| HIV-Infected Participants: C-statistic (95% CI) | All Participants: C-statistic (95% CI) | |||||
|---|---|---|---|---|---|---|
| WIHS | MACS | WIHS and MACS | WIHS | MACS | WIHS and MACS | |
| Model without monocyte/macrophage markers | 0.807 (0.757–0.858) | 0.731 (0.669–0.792) | 0.773 (0.735–0.812) | 0.795 (0.749–0.842) | 0.721 (0.668–0.775) | 0.766 (0.732–0.800) |
| Models with monocyte/macrophage markers | ||||||
| Including soluble CD14 | 0.809 (0.759–0.860) | 0.744 (0.684–0.805) | 0.780 (0.741–0.818) | 0.802 (0.755–0.848) | 0.734 (0.681–0.787) | 0.775 (0.741–0.809)a |
| Including soluble CD163 | 0.807 (0.756–0.858) | 0.734 (0.673–0.796) | 0.773 (0.735–0.812) | 0.795 (0.749–0.842) | 0.731 (0.679–0.784) | 0.767 (0.733–0.801) |
| Including Gal-3BP | 0.811 (0.761–0.861) | 0.731 (0.669–0.793) | 0.774 (0.735–0.813) | 0.796 (0.750–0.843) | 0.723 (0.670–0.777) | 0.768 (0.734–0.802) |
| Including Gal-3 | 0.808 (0.757–0.860) | 0.731 (0.670–0.793) | 0.774 (0.735–0.813) | 0.797 (0.750–0.844) | 0.721 (0.668–0.775) | 0.766 (0.732–0.800) |
| Including soluble CD14 and soluble CD163 | 0.809 (0.759–0.860) | 0.746 (0.686–0.806) | 0.780 (0.742–0.818) | 0.802 (0.755–0.849) | 0.740 (0.688–0.792) | 0.775 (0.741–0.809) |
| Including all 4 markers | 0.814 (0.762–0.866) | 0.746 (0.685–0.808) | 0.781 (0.742–0.819) | 0.804 (0.757–0.851) | 0.740 (0.688–0.792) | 0.777 (0.743–0.811)a |
All models adjusted for HIV serostatus, age, race/ethnicity, education, income, study site, history of injection drug use, crack/cocaine use, current smoking, current alcohol use, history of HCV, hsCRP, IL-6, body mass index, systolic blood pressure, total and HDL cholesterol, use of antihypertension or anticholesterol medications, history of diabetes, eGFR.
Abbreviations: CI, confidence interval; eGFR, estimated glomerular filtration rate; Gal-3, galectin-3; Gal-3BP, Gal-3 binding protein; HCV, hepatitis C virus; HDL, high-density lipoprotein; HIV, human immunodeficiency virus; hsCRP, high-sensitivity C-reactive protein; IL-6, interleukin-6; MACS, Multicenter AIDS Cohort Study; WIHS, Women’s Interagency HIV Study.
aP<.05 for pairwise difference in C-statistic with model without macrophage markers.
DISCUSSION
We found that baseline levels of macrophage inflammation markers were higher among HIV-infected persons, as well as among persons with markers of poor HIV disease control, including low CD4+ T-cell count and high plasma HIV RNA levels. Two markers, sCD14 and sCD163, were positively associated with the formation of new focal carotid artery plaque over a 7-year period, even after controlling for confounding variables and markers of systemic inflammation. The association of sCD14 levels with new plaque was statistically significant when WIHS women and MACS men were combined, and the association of sCD163 with plaque was nearly statistically significant among MACS men. These findings were largely reproduced when evaluating the HIV-infected group alone. Furthermore, sCD163 levels were significantly associated with new plaque formation among virally suppressed men. These findings provide evidence that sCD14 and sCD163 play significant roles in the development of carotid artery atherosclerosis among HIV-infected individuals. Using the same study design, we did not find convincing associations of Gal-3BP or Gal-3 levels with plaque formation. Our study is unique in that it is the largest study of HIV-infected individuals to our knowledge to test these associations prospectively, and includes substantial numbers of both male and female participants, which is less common in the HIV literature.
We previously examined the associations of sCD163, sCD14, and Gal-3BP levels with subclinical carotid artery atherosclerosis in a smaller cross-sectional WIHS analysis [26]. In that study, we found that each of these markers was associated with a higher prevalence of focal plaque, with the most pronounced association found for sCD163. In the MACS, we also found that sCD14 and sCD163 levels were associated with a greater prevalence of coronary artery stenosis of ≥50%, and that sCD163 was associated with a greater prevalence of coronary artery calcium, mixed coronary plaque, and calcified plaque [30]. In the current longitudinal study, sCD14 levels were significantly associated with the formation of new carotid artery plaque after 7 years. sCD14 is a soluble form of a coreceptor for lipopolysaccharide, and has been described as a marker of gut microbial translocation among HIV-infected persons [38]. Longitudinal studies of HIV-infected individuals and the general population have found associations between sCD14 levels and CVD and/or mortality [23, 39]. One study of HIV-infected individuals found that sCD14 levels were associated with greater carotid artery IMT over a 3-year period [19],while another cross-sectional study did not find an association between sCD14 levels with IMT or plaque [21]. Overall, these results suggest that higher levels of sCD14 are associated with increased CVD risk. The extent to which sCD14 levels could modulate lipopolysaccharide-induced inflammatory responses [40], other mechanisms of monocyte and macrophage activation, or even activation of other cell types such as neutrophils in response to inflammation [41] remains unclear.
We found that including sCD14 levels in a risk prediction model only marginally improved the predictive ability for plaque formation compared with only traditional CVD risk factors, hsCRP, and IL-6. This relatively modest improvement in discrimination when including sCD14 suggests that sCD14 may play a greater role in explaining plaque etiology versus use as a clinical tool. Because we did not have information regarding clinical CVD events to allow for validation of the markers in predicting clinical outcomes, the modest improvement in prediction of plaque formation has unclear clinical relevance. While subclinical carotid artery disease has been strongly associated with clinical CVD events in studies of HIV-uninfected persons [42], this relationship has not yet been replicated in HIV-infected cohorts.
We found a significant association between sCD163 levels and new focal plaque formation among virally suppressed HIV+ MACS men. Associations between sCD163 and subclinical atherosclerosis have been reported in other studies of male HIV-infected individuals [18, 30]. In contrast, we did not detect an association between sCD163 levels and atherosclerosis progression among WIHS women. We did, however, detect evidence of a potential interaction of sCD163 levels with HIV and HCV serostatus. This finding suggests that chronic viral infections may augment associations between sCD163 levels with CVD, potentially modulated by sex differences [43], although we acknowledge that HCV prevalence in our study was twice as high in WIHS women than in MACS men. As sCD163 was increased among both HIV-infected and HCV-infected persons, we speculate that persistent chronic infection may lead to greater macrophage M2 polarization and activation. Chronic HCV infection results in long-term liver damage, and we and others have suggested that sCD163 may be unique among serum markers of macrophage abundance, polarization, and activation in its potential role in accelerating disease progression, manifested not only through atherosclerosis but also liver fibrosis [44, 45].
Few epidemiologic studies have examined the role of Gal-3BP in the development of inflammation and CVD. One recent study found that plasma levels of Gal-3BP increased among patients with systemic lupus erythematosus [46], an autoimmune disorder characterized by chronic immune activation and increased inflammation similar to HIV infection. While we previously found a significant association between Gal-3BP levels and the prevalence of carotid artery plaque [26], here we found only a small and nonstatistically significant increase in plaque formation longitudinally.
Our study contributes to a growing body of literature implicating elevated levels of inflammation as etiologic in CVD, both among HIV-infected persons and the general population. As noted, other studies have linked sCD14 and sCD163 levels with increased clinical CVD events and mortality. Our study, in turn, suggests that among individuals free of clinical CVD, elevated levels of these markers also play a role in early stages of the atherosclerotic process. As markers of subclinical disease, they could potentially inform ways to mitigate future risk if interventions can be developed that interrupt the pathways leading to elevated levels.
Our study has limitations. While our imaging protocol allowed us to measure subclinical disease in a population without overt CVD, our evaluation was limited to the measurement of carotid artery IMT. Changes in carotid echolucency or arterial wall stiffness may provide additional information on the role of monocyte and macrophage inflammation in atherosclerosis [47, 48], as could other structural or functional measures, such as coronary computed tomographic angiography [49]. Furthermore, differences with respect to age and sociodemographic characteristics between the cohorts limited our ability to fully test for sex differences. For example, WIHS women were younger than MACS men, more likely to be black or Hispanic, and were less educated. Moreover, MACS men reported greater use of lipid-lowering medications. While these differences reflect those in the greater U.S. HIV population [50], replication of our findings in other cohorts would provide further external validity. Finally, other markers of immune activation and inflammation not examined here may play additional roles in atherosclerosis.
In conclusion, levels of the macrophage inflammatory markers sCD14 and sCD163 were associated with new focal carotid artery plaque formation in HIV-infected individuals. Additional work is needed to understand whether interventions aimed at reducing macrophage-induced inflammation may help to prevent atherosclerosis.
Supplementary Data
Supplementary materials are available at The Journal of Infectious Diseases online. Consisting of data provided by the authors to benefit the reader, the posted materials are not copyedited and are the sole responsibility of the authors, so questions or comments should be addressed to the corresponding author.
Notes
Disclaimer. The contents of this publication are solely the responsibility of the authors and do not represent the official views of the National Institutes of Health (NIH). Data in this manuscript were collected by the Women’s Interagency HIV Study (WIHS) and Multicenter AIDS Cohort Study (MACS).
Financial support. WIHS (Principal Investigators): Bronx WIHS (K. A.), U01-AI-035004; Brooklyn WIHS (H. Minkoff and D. Gustafson), U01-AI-031834; Chicago WIHS (M. H. C. and A. French), U01-AI-034993; Metropolitan Washington WIHS (S. Kassaye), U01-AI-034994; Connie Wofsy Women’s HIV Study, Northern California (R. Greenblatt, B. Aouizerat, and P. C. T.), U01-AI-034989; WIHS Data Management and Analysis Center (S. J. G. and E. Golub), U01-AI-042590; Southern California WIHS (J. Milam), U01-HD-032632 (WIHS I – WIHS IV). The WIHS is funded primarily by the National Institute of Allergy and Infectious Diseases (NIAID) at the National Institutes of Health, with additional cofunding from the Eunice Kennedy Shriver National Institute of Child Health and Human Development (NICHD), the National Cancer Institute (NCI), the National Institute on Drug Abuse (NIDA), and the National Institute of Mental Health (NIMH). Targeted supplemental funding for specific projects is also provided by the National Institute of Dental and Craniofacial Research (NIDCR), the National Institute on Alcohol Abuse and Alcoholism (NIAAA), the National Institute on Deafness and other Communication Disorders (NIDCD), and the NIH Office of Research on Women’s Health. WIHS data collection is also supported by UL1-TR000004 (UCSF CTSA) and UL1-TR000454 (Atlanta CTSA).
MACS (Principal Investigators): Johns Hopkins University Bloomberg School of Public Health (J. Margolick), U01-AI35042; Northwestern University (S. Wolinsky), U01-AI35039; University of California, Los Angeles (R. Detels), U01-AI35040; University of Pittsburgh (C. Rinaldo), U01-AI35041; the Center for Analysis and Management of MACS, Johns Hopkins University Bloomberg School of Public Health (L. Jacobson), UM1-A I35043. The MACS is funded primarily by the NIAID at the National Institutes of Health, with additional cofunding from the NCI. Targeted supplemental funding for specific projects was also provided by the National Heart, Lung, and Blood Institute (NHLBI), and the NIDCD. MACS data collection is also supported by UL1-TR000424 (JHU CTSA).
Other funding sources for this study include R01-HL-083760, R01-HL-095140, and R01-HL-126543 (to R. C. K.), R01-HL-095129 (to W. S. P.), and K01-HL-137557 (to D.B.H.).
Potential conflicts of interest. F. J. P. has provided service on speakers bureau for Bristol Myers Squibb and Merck. I. O. reports board membership for Accordant Health Services. M. D. W. has served on an advisory board for Gilead Sciences. P. C. T. reports board membership for Bristol Myers Squibb and Abbvie, and consultancy for Amunix. S. L. H. reports board membership for Merck. All other authors report no potential conflicts. All authors have submitted the ICMJE Form for Disclosure of Potential Conflicts of Interest. Conflicts that the editors consider relevant to the content of the manuscript have been disclosed.
References
Author notes
Presented in part: American Heart Association Scientific Sessions, New Orleans, Louisiana, 12–16 November 2016. (Abstract 11650).
Correspondence: D. B. Hanna, PhD, Dept of Epidemiology and Population Health, Albert Einstein College of Medicine, 1300 Morris Park Ave, Belfer 1306C, Bronx, NY 10461 ([email protected]).

