


Mortality rates remain high for human immunodeficiency virus (HIV)–associated tuberculosis, and our knowledge of contributing mechanisms is limited. We aimed to determine whether hemostatic changes in HIV-tuberculosis were associated with mortality or decreased survival time and the contribution of mycobacteremia to these effects.
We conducted a prospective study in Khayelitsha, South Africa, in hospitalized HIV-infected patients with CD4 cell counts <350/µL and microbiologically proved tuberculosis. HIV-infected outpatients without tuberculosis served as controls. Plasma biomarkers reflecting activation of procoagulation and anticoagulation, fibrinolysis, endothelial cell activation, matricellular protein release, and tissue damage were measured at admission. Cox proportional hazard models were used to assess variables associated with 12-week mortality rates.
Of 59 patients with HIV-tuberculosis, 16 (27%) died after a median of 12 days (interquartile range, 0–24 days); 29 (64%) of the 45 not receiving anticoagulants fulfilled criteria for disseminated intravascular coagulation. Decreased survival time was associated with higher concentrations of markers of fibrinolysis, endothelial activation, matricellular protein release, and tissue damage and with decreased concentrations for markers of anticoagulation. In patients who died, coagulation factors involved in the common pathway were depleted (factor II, V, X), which corresponded to increased plasma clotting times. Mycobacteremia modestly influenced hemostatic changes without affecting mortality.
Patients with severe HIV-tuberculosis display a hypercoagulable state and activation of the endothelium, which is associated with mortality.
Tuberculosis is the most frequent cause of hospitalization and death in human immunodeficiency virus (HIV)–infected patients worldwide [1]. Mortality rates are particularly high among HIV-infected patients who start tuberculosis treatment in the hospital, ranging from 6% to 32% [2, 3]. The reasons for this remain to be fully elucidated. Mycobacteremia is common in patients with severe HIV-associated tuberculosis (HIV-tuberculosis) [4], but its contribution to the high mortality rates is uncertain [4–6].
Bacterial sepsis is associated with activation of procoagulant responses, endothelial activation, inhibition of fibrinolysis, and decreased anticoagulant responses [7, 8]. In the most extreme cases, these changes lead to disseminated intravascular coagulation (DIC) and microvascular thrombosis [7, 9]. DIC is an important predictor of sepsis-related organ failure and death [7, 10, 11]. HIV infection can also result in hemostatic changes, with decreased concentrations of anticoagulant proteins, such as protein C and protein S [12, 13–16], and increased concentrations of coagulation and fibrinolytic markers, including D-dimer, tissue plasminogen activator (tPA), and plasminogen activator inhibitor type I (PAI-1), and markers of endothelial activation, including von Willebrand factor (vWF) and soluble vascular cell adhesion molecule 1 (VCAM-1) [12, 14, 16–19]. Although active tuberculosis has been associated with certain coagulation abnormalities [20] and increased concentrations of matricellular proteins [21, 22], much less is known about hemostatic changes during severe HIV-tuberculosis. Moreover, data on the impact of mycobacteremia on coagulation abnormalities in HIV-infected patients are, to the best of our knowledge, not available.
We hypothesized that HIV-tuberculosis is accompanied by hemostatic changes that resemble those found in bacterial sepsis, especially in patients with mycobacteremia, and that these changes would be associated with mortality.
In the current study we aimed to determine whether hemostatic changes, including coagulation, matricellular protein concentrations and endothelial activation in hospitalized patients with HIV-tuberculosis are associated with 12-week mortality rates. We also aimed to describe differences in concentrations of these markers in patients with HIV-tuberculosis with or without mycobacteremia, and in HIV-infected controls without active tuberculosis.
MATERIALS AND METHODS
Study Design and Population
This prospective, observational cohort study was conducted in Khayelitsha, Cape Town, South Africa. This township has a reported antenatal HIV seroprevalence of 34% [23] and a tuberculosis notification rate of 917 per 100 000 persons (City of Cape Town, unpublished 2015 data). Patients were recruited at 2 sites: Khayelitsha Hospital, a public sector hospital in the township, and the Ubuntu Clinic, an outpatient clinic in Khayelitsha.
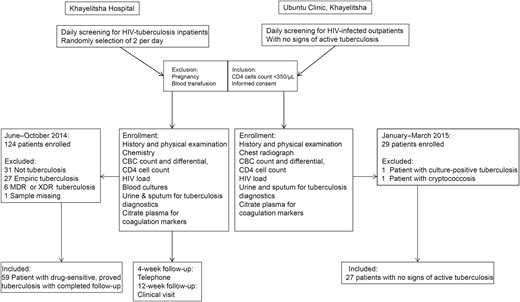
Study flow. Flow diagram showing an overview of methods, patient recruitment, and criteria for inclusion in this study. Between June and November 2014, we recruited adult patients immunodeficiency virus (HIV) infection, CD4 cell counts <350/µL, and a tuberculosis diagnosis or a high clinical suspicion of tuberculosis on admission to Khayelitsha Hospital. Patients who were pregnant or received a blood transfusion were excluded, and only patients with microbiologically proved rifampicin-susceptible tuberculosis were included in the analyses. A random selection procedure was used to select 2 eligible patients on each weekday. As controls, HIV-infected outpatients with CD4 cell counts <350/µL but active tuberculosis were recruited at the Ubuntu Clinic in Khayelitsha. Abbreviations: CBC, complete blood cell; MDR, multidrug resistant; XDR, extensively drug resistant.
Ethics
Ethical approval was obtained from the University of Cape Town Faculty of Health Sciences Human Research Ethics Committee (reference Nos. 057/2013 and 568/2014). Written informed consent was sought from all patients. Patients who were initially too ill to provide consent were enrolled and monitored daily. Patients were invited to provide informed consent or withdraw from the study once they regained capacity to consent. If a patient died before consent was obtained, permission to include his or her data was obtained from the University of Cape Town Faculty of Health Sciences Human Research Ethics Committee.
Procedures
Samples were obtained before initiation of tuberculosis treatment in all patients with HIV-tuberculosis included. Sputum (spontaneous or induced), when produced, was sent for tuberculosis culture and the Xpert MTB/RIF assay (Cepheid). The Xpert MTB/RIF test for urine was performed on concentrated urine samples. MycoFLytic blood cultures (Becton Dickinson Biosciences) for tuberculosis were inoculated with 5 mL of whole blood and cultured for 42 days for patients with HIV-tuberculosis. Mycobacteremia was defined as Mycobacterium tuberculosis growing in ≥1 MycoFlytic blood culture, confirmed by GenoType MTBDRplus assay (Hain Lifescience). Drug sensitivity testing for isoniazid and rifampicin was done on all positive cultures. Full blood counts and differentials (Roche XN-10 Sysmex), HIV loads (Abbott M2000 SP/RT) and CD4 cell counts (Beckman Coulter FC 500 Analysis Cellmek Preparation) were performed at the National Health Laboratory Service laboratory. Patients with HIV-tuberculosis were followed up by telephone at 4 weeks and clinical review at 12 weeks. If contact could not be established, regional clinical laboratory and pharmacy systems were used to ascertain vital status at 12 weeks. Controls were screened for active tuberculosis with a tuberculosis symptom screen [24], sputum culture, and urine and sputum Xpert MTB/RIF assays. They were excluded if results of symptom screen for tuberculosis or any tuberculosis diagnostic tests were positive.
Data Sources and Measurement
Clinical Data
Clinical data were captured from patient files, history and physical examination. Results of study-specific and other relevant tests were captured from the online National Health Laboratory Service database [25].
Plasma Processing
Citrated whole blood was obtained from patients with HIV-tuberculosis and controls and kept at 4°C. Plasma was extracted within 3 hours before being stored at −80°C until further analyses, which were performed at the Academic Medical Center in Amsterdam. Premixed multiplex assays (R&D Systems), performed with a Bioplex 200 system (Bio-Rad), were used to measure concentrations of D-dimer, tPA (both eBioscience), PAI-1, platelet factor 4 (PF-4), protein C, angiopoietin 1 and 2 (Ang-1 and Ang-2), tenascin C, metallopeptidase inhibitor 1 (TIMP-1), cardiac troponin I (cTNI), trefoil factor 3 (TFF3), cystatin C, neutrophil gelatinase-associated lipocalin (NGAL), soluble VCAM-1, soluble E-selectin, and soluble tyrosine kinase with immunoglobulinlike and epidermal growth factor–like domains 1 and 2 (Tie-1 and Tie-2).
Prothrombin time (PT), activated partial thromboplastin time (aPTT), and concentrations of coagulation factors II, V, VII, VIII, IX, X and XI and antithrombin were measured using an automated blood coagulation analyzer (BCS XP, Siemens Healthcare Diagnostics). The fibrinogen concentration was derived from the change in optical signal in PT; the international normalized ratio (INR) was calculated using the mean PT provided by the manufacturer. Protein S (total) and vWF concentrations were measured with in-house assays containing antibodies (Dako). Free protein S was measured by precipitating the C4b-binding protein-bound fraction with polyethylene glycol 8000 and measuring the concentration of free protein S in the supernatant. The activity of a disintegrin and metalloproteinase with a thrombospondin type 1 motif, member 13 (ADAMTS-13) was assessed as described elsewhere [26], with a BCS-XP automated coagulation instrument (Siemens). Factor I + II (FI + II) was measured using Enzygnost F1 + 2 (Siemens). The DIC score (International Society for Thrombosis and Haemostasis) was calculated based on platelet counts, plasma D-dimer and fibrinogen levels, and PT prolongation, as described elsewhere (Supplementary Table) [9].
Statistical Analysis
Data were analyzed using SPSS Version 22 (IBM), GraphPad PRISM version 6, and R statistical manager. Categorical variables are presented as percentages, and continuous variables as medians with interquartile ranges. We used χ² or Fisher exact tests for categorical data, 1-way analysis of variance and Student t test for parametric continuous data, and Kruskal–Wallis and Mann–Whitney U tests for nonparametric data. Variables were investigated for their association with time to death in a Cox proportional hazard model, adjusted for confounders. A priori–defined potential confounders were age, sex, antiretroviral therapy status, HIV load and CD4 cell count. A potential confounder was retained in the final model if introduction of the confounder to the model lead to a >10% change of the effect measure.
In a secondary analyses the influence of tuberculosis and mycobacteremia on alteration of biomarkers was assessed. Variables were compared for HIV-infected controls versus patients with HIV-tuberculosis, and for patients with HIV-tuberculosis who had mycobacteremia versus those who did not. Patients receiving treatment with prophylactic or therapeutic anticoagulants (warfarin, heparin, or enoxaparin; n = 14) were excluded from analyses involving clotting times, fibrinogen, and coagulation factors (including DIC). All reported Q values were calculated using Benjamini-Hochberg procedures for multiple-testing correction [27]; differences were considered significant at P < .05 and Q < 0.10 were regarded as significant.
RESULTS
Patients
Of 124 HIV-infected patients with probable tuberculosis enrolled, 59 patients with confirmed rifampicin-susceptible tuberculosis were included in this analysis. Twenty-seven HIV-infected control patients with CD4 cell counts <350/µL and negative results of screening for tuberculosis were included (Figure 1).
Table 1 displays baseline clinical data for the study cohort. Compared with HIV-infected controls, patients with HIV-tuberculosis were more often anemic and had higher white blood cell counts. At 12-week follow-up, 16 patients with HIV-tuberculosis (27%) had died, at a median of 12 days (interquartile range, 0–24 days) after enrollment; no patients were lost to follow-up.
Clinical Characteristics and Hematological Parametersa
| Characteristic or Parameter | HIV-Infected Controls (n = 27) | Patients With HIV-Associated Tuberculosis (n = 59) | Q Valueb | Survivors (n = 43) | Patients Who Died (n = 16) | Q Valuec |
|---|---|---|---|---|---|---|
| Demographic characteristics | ||||||
| Male sex, No. (%) | 8/27 (30) | 29/59 (49) | 0.30 | 20/43 (47) | 6/16 (38) | 0.77 |
| Age, median (IQR), y | 34 (29–46) | 39 (33–45) | 0.35 | 36 (31–41) | 44 (35–55) | 0.22 |
| ART status, No. (%) | 0.95 | 0.23 | ||||
| Naive | 18/27 (67) | 33/59 (56) | 22/43 (51) | 6/16 (38) | ||
| On ART | 2/27 (11) | 13/59 (22) | 9/43 (21) | 5/16 (31) | ||
| Defaulted | 6/27 (22) | 13/59 (22) | 12/43 (28) | 5/16 (31) | ||
| Anticoagulant use at enrolment, No. (%) | ||||||
| Prophylactic | 0/27 (0) | 13/59 (22) | 0.01d | 9/43 (21) | 4/16 (25) | 0.83 |
| Therapeutic | 0/27 (0) | 1/59 (2) | 1.00 | 1/43 (2) | 0/16 (0) | 1.00 |
| HIV disease markers, median (IQR) | ||||||
| CD4 cell count, cells/µL | 144 (67–204) | 72 (35–168) | 0.35 | 70 (35–159) | 45 (19–90) | 0.83 |
| HIV load, log copies/mL | 4.28 (1.59–4.91) | 5.03 (3.06–5.85) | 0.47 | 5.03 (3.06–5.83) | 4.39 (3.18–5.69) | 0.91 |
| Tuberculosis diagnostics, No. (%) | ||||||
| Sputum culture/Xpert MTB/RIF positivee | 0/22 (0) | 43/50 (86) | ND | 34/40 (85) | 9/10 (90) | 0.83 |
| Urine Xpert MTB/RIF positive | 0/27 (0) | 20/54 (37) | ND | 14/43 (33) | 6/9 (66) | 0.23 |
| Mycobacteremia | ND | 30/59 (51) | ND | 23/43 (54) | 7/16 (44) | 0.77 |
| Hematological parameters, median (IQR) | ||||||
| Hemoglobin, g/dL | 12.1 (10.8–12.8) | 8.9 (6.7–10.8) | 0.002d | 9.0 (6.9–11.2) | 6.9 (6.4–9.8) | 0.23 |
| Blood cell count, × 109/L | ||||||
| WBCs | 4.3 (3.5–5.8) | 6.67 (4.48–9.52) | 0.002d | 7.1 (4.8–10.4) | 5.8 (3.9–7.6) | 0.23 |
| Neutrophils | 2.2 (1.5–3.1) | 5.82 (3.79–9.30) | 0.002d | 6.1 (4.3–9.5) | 4.7 (2.7–6.8) | 0.23 |
| Lymphocytes | 1.53 (0.96–1.96) | 0.56 (0.36–0.96) | 0.002d | 0.60 (0.38–1.03) | 0.49 (0.29–0.78) | 0.32 |
| Monocytes | 0.36 (0.32–0.43) | 0.34 (0.17–0.52) | 0.49 | 0.39 (0.20–0.58) | 0.20 (0.12–0.43) | 0.23 |
Abbreviations: ART, antiretroviral therapy; HIV, human immunodeficiency virus; IQR, interquartile range; ND, not done; WBCs, white blood cells.
a For comparisons, χ² and Fisher exact tests were used for categorical data, and Mann–Whitney U tests for continuous data.
bQ values for comparisons between HIV-infected control groups and patients with HIV-associated tuberculosis.
cQ values for comparisons between patients with HIV-associated tuberculosis who died and survived.
d Significant at Q < 0.10.
e Five HIV-infected control patients and 9 patients with HIV-tuberculosis were unable to produce sputum.
Mycobacteremia was detected in 30 of 59 patients (51%) with HIV-tuberculosis. Rates at 12 weeks did not differ between patients with HIV-tuberculosis with or without mycobacteremia, and mycobacteremia was not associated with decreased survival time (crude hazard ratio, 0.77 [95% confidence interval, .29–2.06; P = .60]; adjusted hazard ratio, 0.84; [.30–2.38; P = .75]).
Activation of the Coagulation System
![Coagulation activation and clotting times. Figure showing the percentage of patients fulfilling criteria for disseminated intravascular coagulation (DIC). Median concentrations and interquartile ranges are shown for markers of coagulation and platelet activation (platelet factor 4 [PF-4]) (A), clotting times (prothrombin time [PT], activated partial thromboplastin time [aPTT], and international normalized ratio [INR]), and concentrations of coagulation factors involved in the extrinsic (B), intrinsic (C), and common (D) coagulation pathways. Values are shown for human immunodeficiency virus (HIV)–infected controls (blackcircles), patients with HIV-associated tuberculosis (HIV-tuberculosis) who survived (gray squares), patients with HIV-tuberculosis who died (open squares). Kruskal–Wallis and Mann–Whitney U tests were used for comparisons between groups. HIV-infected controls were compared with patients with HIV-tuberculosis, and patients with HIV-tuberculosis who survived were compared with those who died. Levels of significance: *Q < 0.05; †Q < 0.01.](https://oup.silverchair-cdn.com/oup/backfile/Content_public/Journal/jid/215/2/10.1093_infdis_jiw532/5/m_jiw53202.jpeg?Expires=1750210590&Signature=iF6HoaWcTuMmoslPMXG8ASSGrEQhf3pZo2LazAug6zoMpl6HLybyFsvUTkFoFAU4fpHCTDOz-NaJSj0VqQz8Aqo6cZKBpyodt9fKUOnPyTAZASimcNHvWqnCGLfxErYSIYK5-XQFFTiBn5-mpPRw8q8GrAyg27BdRDupQn6tMiP07m97DeP4a9QDE2eaVmRlegEX2TrwrlDsDmyVBV4G~CasyVqc50BwbwKe91WYycaLM8NFsbEcM0TB8hUr6gHSQsPSz~DBMGsDn4qEgzrgtphYJi6FiJQ~5-OLlcJ-IaWTF7VQafx4jcp~dMbZFDASSY6wbWMYf1inS06RaTJMIA__&Key-Pair-Id=APKAIE5G5CRDK6RD3PGA)
Coagulation activation and clotting times. Figure showing the percentage of patients fulfilling criteria for disseminated intravascular coagulation (DIC). Median concentrations and interquartile ranges are shown for markers of coagulation and platelet activation (platelet factor 4 [PF-4]) (A), clotting times (prothrombin time [PT], activated partial thromboplastin time [aPTT], and international normalized ratio [INR]), and concentrations of coagulation factors involved in the extrinsic (B), intrinsic (C), and common (D) coagulation pathways. Values are shown for human immunodeficiency virus (HIV)–infected controls (blackcircles), patients with HIV-associated tuberculosis (HIV-tuberculosis) who survived (gray squares), patients with HIV-tuberculosis who died (open squares). Kruskal–Wallis and Mann–Whitney U tests were used for comparisons between groups. HIV-infected controls were compared with patients with HIV-tuberculosis, and patients with HIV-tuberculosis who survived were compared with those who died. Levels of significance: *Q < 0.05; †Q < 0.01.
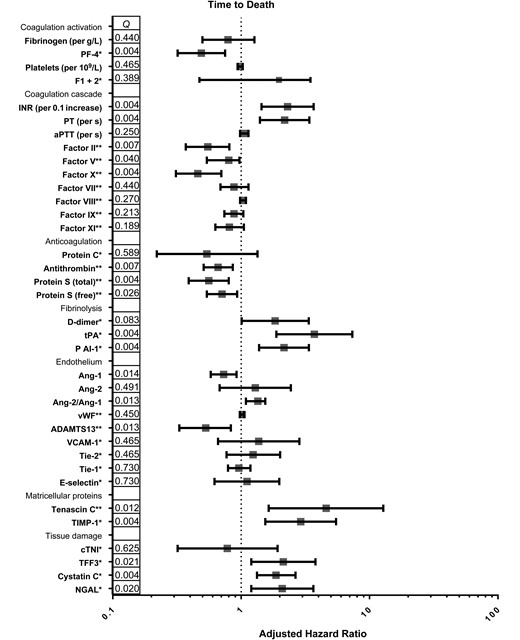
Hemostatic changes and time to death. Figure shows adjusted hazard ratios and 95% confidence intervals for respective variables, calculated with Cox proportional hazard analysis. A priori–defined potential confounders were age, sex, antiretroviral therapy status, human immunodeficiency virus (HIV) load and CD4 cell count. A potential confounder was retained in the final model if introduction of the confounder to the model lead to a >10% change of the effect measure. Q values (corrected P values) are shown per log2 pg/mL increase (*) or per 10% increase (**), depending on assay used. Abbreviations: ADAMTS-13, a disintegrin and metalloproteinase with a thrombospondin type 1 motif, member 13; Ang 1 and Ang 2, angiopoietin 1 and 2; aPTT, activated partial thromboplastin time; cTNI, cardiac troponin I; FI + II, factor I + II; INR, international normalized ratio; NGAL, neutrophil gelatinase-associated lipocalin; PAI-1, plasminogen activator inhibitor type I; PF-4, platelet factor 4; PT, prothrombin time; TFF3, trefoil factor 3; Tie-1 and Tie-2 tyrosine kinase with immunoglobulinlike and epidermal growth factor–like domains 1 and 2; TIMP-1, metallopeptidase inhibitor 1; tPA, tissue plasminogen activator; VCAM-1, vascular cell adhesion protein 1; vWF, von Willebrand factor.
DIC was common among patients with HIV-tuberculosis; 19 of 33 survivors (58%) and 10 of 12 nonsurvivors (83%) fulfilled criteria for DIC at presentation (Figure 2). There was no statistically significant association between DIC and decreased survival time (crude hazard ratio, 0.32 [95% confidence interval, .07–1.48; P = .15]; adjusted hazard ratio, 0.46 [09–2.32; P = .35]).
Among patients with HIV-tuberculosis, those with mycobacteremia had lower platelet counts than those with negative blood cultures. No further differences were seen in coagulation markers and clotting times between patients with and those without mycobacteremia (Table 2).
Biomarker Concentrations and Mycobacteremia
| Biomarker | Median (IQR) | ||
|---|---|---|---|
| Nonmycobacteremic Patients (n = 29) | Mycobacteremic Patients (n = 30) | Q Valuea | |
| Coagulation activation | |||
| Fibrinogen, g/L | 5.2 (3.4–6.2) | 6.3 (4.5–7.5) | 0.52 |
| PF-4, µg/mL | 0.31 (0.21–0.48) | 0.32 (0.18–0.48) | 0.56 |
| Platelets, × 109/L | 311 (234–380) | 202 (124–276) | 0.04b |
| PT, s | 12.5 (12.1–13.7) | 13.6 (12.6–15.4) | 0.22 |
| aPTT, s | 34.2 (31.3–37.1) | 39.5 (34.8–42.6) | 0.13 |
| INR, s | 1.04 (1.07–1.19) | 1.08 (1.18–1.34) | 0.22 |
| Factor, % | |||
| II | 101 (83–112) | 89 (78–108) | 0.56 |
| V | 128 (103–160) | 128 (105–155) | 0.89 |
| VII | 71 (62–95) | 64 (52–88) | 0.73 |
| VIII | 378 (302–494) | 332 (288–393) | 0.22 |
| IX | 158 (117–185) | 119 (109–162) | 0.22 |
| X | 106 (91–112) | 90 (72–113) | 0.52 |
| XI | 100 (78–117) | 76 (65–107) | 0.22 |
| Anticoagulant proteins | |||
| Antithrombin, % | 90 (69–103) | 85 (75–96) | 0.75 |
| Protein S (total), % | 88 (76–99) | 94 (76–109) | 0.56 |
| Protein S (free), % | 54 (39–66) | 51 (40–73) | 0.71 |
| Protein C, µg/mL | 0.40 (0.34–0.60) | 0.37 (0.29–0.43) | 0.22 |
| Fibrinolysis | |||
| D-dimer, µg/mL | 9.3 (7.0–16.6) | 10.4 (7.1–16.6) | 0.68 |
| tPA, ng/mL | 97 (53–161) | 140 (112–234) | 0.08b |
| PAI-1, ng/mL | 28 (18–34) | 45 (22–69) | 0.09b |
| Endothelial activation | |||
| E-selectin, µg/mL | 0.10 (0.06–0.13) | 0.12 (0.08–0.15) | 0.46 |
| vWF, % | 471 (406–593) | 608 (519–696) | 0.08b |
| ADAMTS-13, % | 41 (26–57) | 29 (20–43) | 0.09b |
| VCAM-1, µg/mL | 3.91 (2.27–6.63) | 6.42 (4.76–7.78) | 0.08b |
| Ang-1, ng/mL | 1.3 (0.8–1.6) | 6.2 (0.3–1.3) | 0.09b |
| Ang-2, ng/mL | 9.5 (5.5–15.4) | 8.2 (5.4–10.4) | 0.58 |
| Ang-2/Ang-1 ratio | 6.4 (3.7–15.3) | 13.8 (5.0–29.6) | 0.22 |
| Tie-2, pg/mL | 396 (235–763) | 362 (227–517) | 0.58 |
| Tie-1, ng/mL | 30 (12–39) | 16 (0.7–25) | 0.08b |
| Matricellular proteins | |||
| Tenascin C, ng/mL | 38 (27–49) | 35 (28–46) | 0.73 |
| TIMP-1, µg/mL | 0.29 (0.16–0.43) | 0.28 (0.18–0.41) | 0.77 |
| Tissue damage | |||
| cTNI, pg/mL | 338 (303–444) | 317 (254–398) | 0.39 |
| TFF3, pg/mL | 5120 (3682–7747) | 4889 (2756–10 951) | 0.73 |
| Cystatin C, µg/mL | 0.81 (0.70–1.20) | 1.07 (0.73–1.97) | 0.39 |
| NGAL, µg/mL | 0.15 (0.09–0.29) | 0.19 (0.09–0.25) | 0.64 |
Abbreviations: ADAMTS-13, a disintegrin and metalloproteinase with a thrombospondin type 1 motif, member 13; Ang-1 and Ang-2, angiopoietin 1 and 2; aPTT, activated partial thromboplastin time; cTNI, cardiac troponin I; INR, international normalized ratio; IQR, interquartile range; NGAL, neutrophil gelatinase-associated lipocalin; PAI-1, plasminogen activator inhibitor type I; PF-4, platelet factor 4; PT, prothrombin time; TFF3, trefoil factor 3; Tie-1 and Tie-2, tyrosine kinase with immunoglobulinlike and epidermal growth factor–like domains 1 and 2; TIMP-1, metallopeptidase inhibitor 1; tPA, tissue plasminogen activator; VCAM-1, vascular cell adhesion protein 1; vWF, von Willebrand factor.
aQ values are shown for Mann–Whitney U tests for comparisons between patients with and patients without mycobacteremia.
b Significant at Q < 0.10.
Anticoagulant Proteins
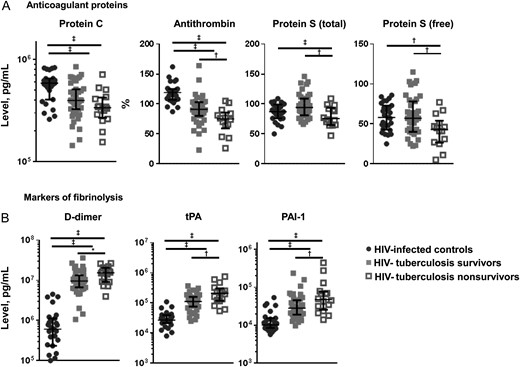
Anticoagulation and fibrinolysis. Figure shows median concentrations and interquartile ranges for anticoagulant protein C, protein S (total and free) and antithrombin (A) and for markers of fibrinolysis D-dimer, tissue plasminogen activator (tPA) and plasminogen activator inhibitor type 1 (PAI-1) (B). Values are shown for human immunodeficiency virus (HIV)–infected controls (black circles), patients with HIV-associated tuberculosis who survived (gray squares), and patients with HIV-tuberculosis who deceased (open squares). Kruskal–Wallis and Mann–Whitney U tests were used for comparisons between groups. HIV-infected controls were compared with patients with HIV-tuberculosis, and patients with HIV-tuberculosis who survived were compared with those who died. Levels of significance: *Q < 0.10; †Q < 0.05; ‡Q < 0.01.
Fibrinolytic Response
Markers of fibrinolysis, D-dimer, tPA, and PAI-1, were increased in patients with HIV-tuberculosis compared with HIV-infected controls (Figure 4B). Patients who died had higher concentrations of markers of fibrinolysis than those who survived (Figure 4B). Higher concentrations of D-dimer, tPA, and PAI-1 were independently associated with decreased survival time (Figure 3). Concentrations of tPA and PAI-1 were higher in mycobacteremic patients than in patients with HIV-tuberculosis without mycobacteremia (Table 2), but there were no differences in D-dimer concentrations.
Activation of the Vascular Endothelium
![Endothelial activation, extracellular matrix molecules and tissue damage. Figure shows median concentrations and interquartile ranges for markers of endothelial activation (von Willebrand factor [vWF], a disintegrin and metalloproteinase with a thrombospondin type 1 motif, member 13 [ADAMTS-13], E-selectin, soluble vascular cell adhesion protein 1 [VCAM-1], angiopoietin 1 and 2 [Ang-1 and Ang-2], and Ang-1/Ang-2 ratio) (A), matricellular proteins (tenascin C and metallopeptidase inhibitor 1 [TIMP-1]) (B), and markers of tissue damage (cardiac troponin I [cTNI], cystatin C, neutrophil gelatinase-associated lipocalin [NGAL], and trefoil factor 3 [TFF3]) (C). Values are shown for human immunodeficiency virus (HIV)–infected controls (black circles), patients with HIV-associated tuberculosis who survived (gray squares), and patients with HIV-tuberculosis who deceased (open squares), respectively. Kruskal–Wallis and Mann–Whitney U tests were used for comparisons between groups. HIV-infected controls were compared with patients with HIV-tuberculosis, and patients with HIV-tuberculosis who survived were compared with those who died. Levels of significance: *Q < 0.05; †Q < 0.01.](https://oup.silverchair-cdn.com/oup/backfile/Content_public/Journal/jid/215/2/10.1093_infdis_jiw532/5/m_jiw53205.jpeg?Expires=1750210590&Signature=TSeED4ftcRPcBdjTMTiWYMuaJIgRG4L6rbW7ZmbdR-PNffXgq9l2sG761HDtaJCYlQR2nf2x-m0bUgD-Q2MuZkOq7fdyCaxpoOtaubp9I~EipL9y5KNbFHqE1YklMoXSLjziimTamTP8xlPgqoEMGr7vRZ06FdS2nyhIuVrbGrNjHLirO9MZL8dMDgfSJR5SF6eQvUm0yZJ8ad9NwiVReoWvZPPvVigpPOGU6XrmVeV7owPQCAoptwwGVqUW7efl4dtQdhUsHmDilji0TzWpo7z-SKUJw5KP8xpit8vGKWfpZJ~u3MJrOGa5cuLrvnPnOYt40qCRF2h4pHVgxR1KEQ__&Key-Pair-Id=APKAIE5G5CRDK6RD3PGA)
Endothelial activation, extracellular matrix molecules and tissue damage. Figure shows median concentrations and interquartile ranges for markers of endothelial activation (von Willebrand factor [vWF], a disintegrin and metalloproteinase with a thrombospondin type 1 motif, member 13 [ADAMTS-13], E-selectin, soluble vascular cell adhesion protein 1 [VCAM-1], angiopoietin 1 and 2 [Ang-1 and Ang-2], and Ang-1/Ang-2 ratio) (A), matricellular proteins (tenascin C and metallopeptidase inhibitor 1 [TIMP-1]) (B), and markers of tissue damage (cardiac troponin I [cTNI], cystatin C, neutrophil gelatinase-associated lipocalin [NGAL], and trefoil factor 3 [TFF3]) (C). Values are shown for human immunodeficiency virus (HIV)–infected controls (black circles), patients with HIV-associated tuberculosis who survived (gray squares), and patients with HIV-tuberculosis who deceased (open squares), respectively. Kruskal–Wallis and Mann–Whitney U tests were used for comparisons between groups. HIV-infected controls were compared with patients with HIV-tuberculosis, and patients with HIV-tuberculosis who survived were compared with those who died. Levels of significance: *Q < 0.05; †Q < 0.01.
ADAMTS-13 concentrations were lower in patients with HIV-tuberculosis who died than in survivors, possibly owing to higher concentrations of vWF (Figure 5). Lower concentrations of ADAMTS-13 were associated with decreased survival time (Figure 3). In addition, Ang-1 concentrations were lower with higher concentrations of Ang-2, leading to an increased Ang-2/Ang-1 ratio in those who died (Figure 5). Low Ang-1 concentrations and high Ang-2/Ang-1 ratios were independently associated with mortality (Figure 3). There were no differences in concentrations of VCAM-1, E-selectin, Tie-1 and Tie-2 expression between patients with HIV-tuberculosis who survived and those who died.
Higher concentrations of matricellular proteins tenascin C and TIMP-1 were independently associated with decreased survival time (Figure 5B and 3). Concentrations of vWF and VCAM-1 were higher in mycobacteremic patients than in patients with HIV-tuberculosis without mycobacteremia, whereas concentrations of ADAMTS-13, Ang-1, and Tie-1 were lower (Table 2). There were no differences in concentrations of markers of matricellular homeostasis between mycobacteremic patients and patients with HIV-tuberculosis without mycobacteremia (Table 2).
Tissue Injury Markers
The hemostatic changes described above may lead to microvascular thrombosis and organ damage. Markers of intestinal damage (TFF3) and kidney injury (cystatin C and NGAL) were increased in patients with HIV-tuberculosis compared with HIV-infected controls (Figure 5C). There were no differences in cTNI, a marker of cardiac tissue damage.
Patients with HIV-tuberculosis who died presented with higher concentrations of TFF3, cystatin C, and NGAL (Figure 5C). Higher concentrations of these molecules were independently associated with decreased survival time (Figure 3). Concentrations of cTNI did not differ between these groups. There were no differences in concentrations of markers of tissue damage between mycobacteremic patients with HIV-tuberculosis and patients without mycobacteremia (Table 2).
DISCUSSION
We report a procoagulant state in HIV-associated patients with tuberculosis, together with signs of endothelial activation and tissue damage, which was associated with higher mortality rates. Specifically, our main findings are that concentrations for markers of fibrinolysis (D-dimer, tPA, and PAI-1), endothelial activation (Ang-2, Ang-2/Ang-1 ratio, and vWF), extracellular matrix metabolism (tenascin C and TIMP-1) and tissue damage (TFF3, cystatin C, and NGAL) were increased in patients with HIV-tuberculosis who died, whereas concentrations of anticoagulant proteins (total and free protein S, ADAMTS-13 and antithrombin) were decreased. Alterations in the majority of these markers were independently associated with decreased survival time in patients with HIV-tuberculosis. Coagulation activation results in depletion of coagulation factors; this was seen especially for factors involved in the common pathway (factor II, V and X) and lower concentrations of all of these were associated with decreased survival time. Consequently, clotting times (PT and aPTT) were prolonged in patients who died. These changes are likely to be driven by tuberculosis rather than advanced HIV only, as suggested by the more marked alterations of these markers observed in patients with HIV-tuberculosis, compared with HIV-infected controls.
Our study provides an integrated overview of markers of coagulation, endothelial activation, fibrinolysis, extracellular matrix metabolism, and tissue damage alterations in HIV-tuberculosis. The early mortality rates [2, 3] and prevalence of mycobacteremia [5, 28, 29] reported here are similar to findings of other studies in Africa, securing the external validity of our study. Ethics committee permission was obtained to recruit drowsy or confused patients with deferred consent, as explained in Materials and Methods. Inclusion of this patient category increases the generalizability of our results to the most critically ill patients, because patients with severe HIV-tuberculosis are frequently confused or drowsy at the time of hospital admission owing to neurological tuberculosis or the severity of their disease.
Decreased concentrations of protein C were associated with tuberculosis in HIV-infected patients, whereas reduced protein S concentrations (deficits in concentrations of both total and free protein S) were associated with decreased survival time. Under physiological conditions, approximately 60% of protein S is bound to the β chain of C4 binding protein; only the free form has protein C cofactor activity [30]. Concentrations of C4 binding protein increase in inflammatory conditions, leading to reduced levels of free (active) protein S [31]. Because protein S is produced predominantly in the liver and endothelium, reduced free protein S may result from liver failure or endothelial dysfunction [32] and/or increased consumption. A previous study showed that HIV-infected patients with bacterial sepsis had more profound deficiencies of free protein S [33], but that study did not assess associations with death.
Inflammation leads to endothelial activation, inducing release of vWF, which enhances platelet binding and thereby clot formation [34]. Under normal conditions, vWF is regulated by ADAMTS-13 [35]. Ang-1 and Ang-2 are both ligands for the Tie-2 receptor. In healthy individuals, Ang-1 concentrations exceed Ang-2 concentrations, triggering prosurvival pathways and inhibiting proinflammatory responses [8]. These markers of endothelial activation were increased in HIV-tuberculosis, and more profoundly so in patients who died. Previous studies have reported endothelial activation in tuberculosis [20, 36, 37] as well as in HIV infection [38, 12, 16–19]. One study in HIV-infected women in Kenya showed increased concentrations of Ang-2 at baseline, which decreased with antiretroviral therapy [14]. However, the literature on endothelial activation in HIV-tuberculosis coinfection is scarce. Increased concentrations of Ang-2 indicate a role for endothelial dysfunction in HIV-tuberculosis, possibly contributing to mortality. This might be explained by endothelial dysfunction-related vascular leakage, leading to impaired tissue oxygenation and organ damage [8]. Currently, therapeutic agents targeting the angiopoietin/Tie-2 system and Ang-2 antagonists are being developed and evaluated in cancer treatment [39–41]. Our findings suggest it may be worthwhile investigating these agents as a host-directed adjunctive therapy for severe HIV-tuberculosis.
Imbalances in extracellular matrix homeostasis have been described in active tuberculosis, and proteolytic activity of matrix metalloproteinases have been related to dissemination of Mycobacterium tuberculosis [21]. Concentrations of matricellular proteins tenascin C and TIMP-1 were increased in patients with HIV-tuberculosis, and higher concentrations were associated with decreased survival time. This is in agreement with findings of previous studies that have demonstrated increased levels of tenascin C and TIMP-1 in patients with active tuberculosis [42], with even higher concentrations measured at the site of infection [43]. Matrix metalloproteinase inhibitors have been investigated as cancer treatment [44] and have been suggested for host-directed therapy in tuberculosis [45]. It remains to be established whether these agents may be of value in HIV-tuberculosis therapy.
Concentrations of NGAL and cystatin C, both early markers of renal injury, were increased in patients with HIV-tuberculosis and associated with decreased survival time. This suggests renal injury in severe HIV-associated tuberculosis. Likewise, TFF3, a marker of intestinal damage, was elevated in patients with HIV-tuberculosis and associated with decreased survival time. Bacterial product translocation due to dysfunction of the intestinal barrier has been widely described in HIV-infection [46–48] and has been reported in tuberculosis as well [49, 50].
Mycobacteremia was not associated with decreased survival time and did not affect markers of coagulation, anticoagulation, extracellular matrix or tissue damage. Markers of fibrinolysis (tPA and PAI-1) had increased concentrations in mycobacteremia, as did markers of endothelial activation VCAM-1 and vWF, whereas concentrations of Ang-1 and ADAMTS-13 were decreased. Mortality rates were high and DIC was frequent in our cohort, regardless of mycobacteremia, suggesting a limited prognostic value of mycobacterial blood cultures in patients with severe HIV-tuberculosis.
Our study has limitations. We do not have data on the cause of death in patients who died. Owing to logistic and sociocultural issues (none of the families gave their consent), postmortem examinations were not performed. Our findings cannot be related to clinical outcomes other than death.
Patients with severe HIV-tuberculosis display a hypercoagulable state that is associated with mortality. DIC is a common finding in this patient category. Our data indicate that activation of coagulation and the endothelium, together with decreased activity of anticoagulant pathways, were associated with depletion of coagulation factors and increased clotting times. This may lead to thromboembolic events, microvascular thrombosis, and tissue damage, as illustrated by increased concentrations for markers of tissue damage. This study is the first to investigate coagulation abnormalities in HIV-tuberculosis and suggests that treatment strategies targeting hemostasis, endothelial activation, and matricellular homeostasis may be of interest for evaluation in patients with severe HIV-tuberculosis who continue to have an unacceptably high mortality rate.
Notes
Acknowledgments. We thank Rene Goliath, Amanda Jackson, Vanessa January, and M. K. Mpalali from the Clinical Infectious Diseases Research Initiative, Bekekili Kwasa, Lebo Tsekela, and Nonceba Gobe from the Ubuntu Clinic, and Jonathan Ellis and Susan George for their contributions to data collection in the study. We thank Wil Kopatz, Barbara Dierdorp, and Tamara Dekker (all Academic Medical Center, Amsterdam) for technical assistance.
Financial support. This work was supported by the foundation “De Drie Lichten” in The Netherlands; the Marie Curie People Programme and the Studiefonds Ketel 1 (grants to S. J.); the South African Medical Research Council (National Health Scholars Programme support to C. S.); the Wellcome Trust (grant to 098316 G. Meintjes); the European & Developing Countries Clinical Trials Partnership (grant SP.2011.41304.074 to G. Meintjes); the South African Research Chairs Initiative of the Department of Science and Technology and National Research Foundation (NRF) of South Africa (grant 64787 to G. Meintjes); NRF incentive funding (UID No. 85810 to G. Maartens and UID No. 85858 to G. Meintjes); and the South African Medical Research Council through its TB and HIV Collaborating Centres Programme with funds received from the National Department of Health (RFA No. SAMRC-RFA-CC: TB/HIV/AIDS-01-2014 to G. Meintjes).
Potential conflicts of interest. All authors: No reported conflicts. All authors have submitted the ICMJE Form for Disclosure of Potential Conflicts of Interest. Conflicts that the editors consider relevant to the content of the manuscript have been disclosed.
References

