


Abstract
Plasmodium falciparum erythrocyte membrane protein 1 (PfEMP1) mediates the binding and accumulation of infected erythrocytes (IE) to blood vessels and tissues. Specific interactions have been described between PfEMP1 and human endothelial proteins CD36, intercellular adhesion molecule-1 (ICAM-1), and endothelial protein C receptor (EPCR); however, cytoadhesion patterns typical for pediatric malaria syndromes and the associated PfEMP1 members are still undefined.
In a cohort of 94 hospitalized children with malaria, we characterized the binding properties of IE collected on admission, and var gene transcription using quantitative polymerase chain reaction.
IE from patients with cerebral malaria were more likely to bind EPCR and ICAM-1 than IE from children with uncomplicated malaria (P = .007). The level of transcripts encoding CIDRα1.4 and CIDRα1.5 domain subclasses was higher in patients with severe disease (P < .05). IE populations exhibiting binding to all 3 receptors had higher levels of transcripts encoding PfEMP1 with CIDRα1.4 and Duffy binding-like (DBL)–β3 domains than parasites, which only bound CD36.
These results underpin the significance of EPCR binding in pediatric malaria patients that require hospital admission, and support the notion that complementary receptor interactions of EPCR binding PfEMP1with ICAM-1 amplifies development of severe malaria symptoms.
Malaria is a leading cause of morbidity and mortality in the developing world. The clinical expression of malaria varies from one individual to another and reflects symptoms that range from uncomplicated to severe disease [1]. The most severe attacks are mainly encountered before acquisition of immune protection of the individual early in life; in endemic African countries with a high level of malaria transmission, typically in young children under 5 years of age [2]. Similarly, the complications of malaria are frequent in nonimmune travelers from nonendemic countries [3]. The gradually acquired protection to malaria explains the rarity of severe malaria among adolescents and adults in endemic countries with high-to-moderate malaria transmission [4]. This epidemiological perspective strongly suggests that immune protection first develops against parasites, causing severe malaria, followed by the development of immunity to clinical malaria and finally to parasitemia in older children/adults [5]. A long-standing quest has therefore been to identify the specific parasite antigens determining virulence. Accumulated data clearly indicate that parasite proteins exported to the surface of infected erythrocytes (IE) confer variable antigenic and cytoadhesion properties [6,7], hypothesized to be associated with varying potentials for virulence. The Plasmodium falciparum erythrocyte membrane protein 1 (PfEMP1) family has been clearly associated with antigenic variation and anchoring of IE to the microvascular endothelium of virtually every organ and tissue [8]. The extracellular domain of PfEMP1 mediates this adhesion through specific binding to endothelial cell receptors, including endothelial protein C receptor (EPCR) [9], cluster of differentiation (CD)36 [10], intercellular adhesion molecule-1 (ICAM-1) [11], and to placental chondroitin sulfate A (CSA) [12,13]. Insights to the structural organization of the PfEMP1 extracellular domain showed an ordered arrangement of Duffy binding-like (DBL) and cysteine-rich interdomain regions (CIDR). DBL and CIDR domains divide phylogenetically into 7 (α, β, γ, δ, ε, ζ, and pam) and 5 (α, β, γ, δ, and pam) distinct classes, respectively [14]. Typically, PfEMP1 proteins consist of an N-terminal DBLα-CIDR tandem domain structure that dictates mutually exclusive binding properties, and is also associated with certain conservation of genomic organization of the encoding genes and clinical outcome (Figure 1). The PfEMP1 repertoire of each parasite is encoded by approximately 60 var genes, most of which can be classified into 3 major groups. The so-called group A var genes are located subtelomerically, and encode either PfEMP1 that bind EPCR via CIDRα1 (50% of A types), which are associated with severe malaria [9,15–17]; or PfEMP1, characterized by instead having an N-terminal CIDRβ/-γ or -δ domain of unknown binding property (the other 50% of the A types) and have not been associated with severe malaria. Group B var genes are telomeric and transcribed in the opposite direction to the A genes, and like all centromeric group C genes, they encode PfEMP1 with a CIDRα2–6 domain subclass mediating a CD36 binding phenotype, and are not associated with severe disease. One exception exists with the so-called domain cassette (DC) 8 var genes that are B/A chimeric genes, telomerically located as group B genes but encoding EPCR-binding PfEMP1 (also associated with severe malaria) [18].
![Schematic representation of PfEMP1 structure, according to domain binding properties. PfEMP1 head structure is classified based on the upstream sequence (Ups) similarity. The PfEMP1 extracellular region contains N-terminus sequence (NTS) followed by a tandem Duffy binding-like (DBL) and cysteine-rich interdomain region (CIDR) adhesion domains also classified into different types. It is anchored in the membrane by a transmembrane domain followed by an acidic terminal segment (ATS). DCs are specific chimeric binding domains, displayed in black under protein structure on the figure. DC16 are group A PfEMP1 that have been shown not to be associated with severe disease [16,17]. DC8 and DC13 have been shown to be associated with the severity of the disease.](https://oup.silverchair-cdn.com/oup/backfile/Content_public/Journal/jid/215/12/10.1093_infdis_jix230/1/m_jix23001.jpeg?Expires=1750064350&Signature=dY8FlRzjWXY7OtLtBVeFfXeMberT5Jbw2YTnWWzxMksKabxzw~s3XXlppVLA8QFIftofqUjAVhjkcXNepteoKiNQ~zD-kChKSMVbLDg8OHSX5mQ02svLoiqmjVUWywBAE0hudVir8JkgZ1~kc-C5N-j93tzahY0alP3L6sLXQIMIvgOGqyLXHmZ3UIYycUb2YaBdL1CAwG9-RgdgIfbHxa1pHsapBn6lzQpElGkCqyorlJMURrXjsszvnFopY0M7ZD2C63i7yQ~UK9iR64~KB6zG0azPlV6ioOZIUMoP3sC-0t8rTpiSMhOMrgk4XGrb16Px0N0VGjzBWsxaNosLsQ__&Key-Pair-Id=APKAIE5G5CRDK6RD3PGA)
Schematic representation of PfEMP1 structure, according to domain binding properties. PfEMP1 head structure is classified based on the upstream sequence (Ups) similarity. The PfEMP1 extracellular region contains N-terminus sequence (NTS) followed by a tandem Duffy binding-like (DBL) and cysteine-rich interdomain region (CIDR) adhesion domains also classified into different types. It is anchored in the membrane by a transmembrane domain followed by an acidic terminal segment (ATS). DCs are specific chimeric binding domains, displayed in black under protein structure on the figure. DC16 are group A PfEMP1 that have been shown not to be associated with severe disease [16,17]. DC8 and DC13 have been shown to be associated with the severity of the disease.
Abbreviations: DCs, domain cassettes; PfEMP1, Plasmodium falciparum erythrocyte membrane protein 1.
C-terminally to the N-terminal domain compositions, PfEMP1 may have 1–3 DBLβ or -γ domains, as well as a DBLδ-CIDR-γ or -δ di-domain and 1–3 DBLε-ζ domains. Different members of DBLβ subclasses specific to either group A (DBLβ1/3) or B (DBLβ5) PfEMP1 have been shown to bind ICAM-1 [11,19] (Figure 1). The function of the remaining domain types is unclear, although binding to platelet endothelial cell adhesion molecule-1 (PECAM-1) [20], α-2-macroglubulin, or immunoglobulin type M has been suggested [21,22].
Cytoadhesion of IE is vital to the parasite, as it prevents spleen-mediated clearance of the parasite [23] and allows the blood stage of the infection to develop, which may eventually cause life-threatening pathology in the host [8]. Unlike placental malaria where tissue tropism was clearly attributed to the interaction of IE with a single host receptor, the placental CSA [24], malaria in nonpregnant hosts involves interaction of PfEMP1 with several endothelial receptors [9,25,26]. Identifying PfEMP1 domains, which induce antibodies capable of blocking the adhesion of IE to host receptors, is central to developing a new vaccine approach against severe nonpregnancy malaria. In placental malaria, a single, relatively conserved PfEMP1 variant, VAR2CSA, is responsible for placental sequestration [13,27], and the minimal-binding region for the placental CSA interaction has been determined and is currently the object of vaccine development [28]. A similar approach for the identification of PfEMP1 members associated with severe childhood/nonpregnancy malaria depends on understanding the diversity of the PfEMP1 involved and their specificity to the cytoadhesion receptors. The first domain specific associations to severe malaria were found for group A and B/A var genes encoding domain cassette (DC)13 and DC8, which harbor CIDRα1.4 and CIDRα1.1/1.8 domains, respectively [16,18]. Subsequently, all CIDRα1 subclasses (with the exception of the CIDRα1.2/1.3 subclasses from the VAR1 PfEMP1) were demonstrated to possess EPCR-binding ability [9,29], and the molecular mechanism of EPCR-CIDRα1 binding has recently been resolved. It is increasingly apparent that all EPCR-binding PfEMP1 (defined by having 1 of the CIDRα1.1/1.4–1.8 domain variants) are found in severe malaria [17,30]. A recent study characterized 2 PfEMP1 and showed that they had the ability to bind both EPCR and ICAM-1 [31]. Another recent study has identified a subset of group A PfEMP1 with the ability to bind both EPCR and ICAM-1, and the ICAM-1 binding site of such PfEMP1 was defined [32]. These observations strongly support the hypothesis that an additive cytoadhesion effect of these interactions is a risk factor for developing cerebral malaria.
In this study, we characterized the binding properties of isolates from hospitalized children with different clinical forms of malaria on the 4 well-known IE receptors (CD36, ICAM-1, EPCR, and CSA), and investigated clinical and binding phenotype associations with var-type expression determined by quantitative polymerase chain reaction (qPCR).
METHODS
Malaria Patients, Sample Collection and Processing
This study was conducted in 3 hospital centers in the city of Cotonou, southern Benin, during the 2013 and 2014 malaria transmission seasons (June–September and May–July, respectively). Children under 6 years of age presenting at Hôpital Mère-Enfant de la Lagune, Centre National Hospitalier Universitaire Hubert Koutoukou Maga, and to Hôpital Suru-Léré were screened by rapid diagnostic test for malaria (DiaQuick Malaria P. falciparum Cassette, Dialab; Hondastrasse, Austria). Children were included if they presented with a diagnosis of cerebral malaria (CM), severe but noncerebral malaria (SM), or uncomplicated malaria (UM). CM was defined as a P. falciparum infection and a Blantyre coma score ≤2, and no other known cause of coma. Lumbar puncture examination allowed exclusion of bacterial meningitis. No obvious respiratory infections were recorded. SM was defined according to the presence of 1 of the following signs: high P. falciparum parasitemia (>250000 parasites/μL), P. falciparum parasitemia and severe anemia (SA; hemoglobin <5 g/dL). UM was defined as P. falciparum parasitemia accompanied by fever, headache, or myalgia without signs of severity and/or evidence of vital organ dysfunction, as defined by the World Health Organization [1].
After obtaining informed and written consent from parents or guardians, 2–4 mL venous blood samples were collected into tubes containing citrate phosphate dextrose adenine. P. falciparum infections were confirmed by microscopic examination of Giemsa-stained thick blood smears, and parasitemia was recorded as the number of asexual parasites/μL of blood. Blood was transferred to Whatman 3MM filter paper and stored at room temperature for DNA extraction, or in TRIzol reagent (Life Technologies, France) and stored at –80°C for ribonucleic acid (RNA) extraction. Five hundred μL of blood were cultured in supplemented Roswell Park Memorial Institute (RPMI) 1640 medium without human serum for less than 48 hours until they reached the mature stage (mature trophozoites and schizonts), then purified using magnetic-activated cell sorting (MACS; Milteny Biotec, Bergisch Gladbach, Germany) for binding assay. Children were followed until hospital discharge.
Binding Assay
Static binding assays were performed in 100 × 15-mm Petri dishes, as described [33,34]. Twenty μL of each recombinant protein diluted in phosphate buffer saline (PBS) were spotted on Petri dish, and incubated overnight at 4°C in a sealed humid container. The following receptors were used: CSPG at 5 μg/mL (Decorin, Sigma-Aldrich, Saint-Quentin Fallavier, France); CD36, ICAM-1 at 10 μg/mL (R&D, Lille, France); EPCR at 20 μg/mL; and 1% bovine serum albumin (BSA). Recombinant EPCR used for IE adhesion assays was expressed in human embryonic kidney 293 cells as His-tagged EPCR, as described [35]. The spots were blocked with 3% BSA in PBS for 30 minutes at 37°C in a humid chamber. MACS enrichment provided 60%–80% parasitemia that was adjusted to 20% in RPMI 1640 medium. Twenty μL of parasite suspension were added to each spot and incubated for 12 minutes at room temperature as optimized in our previous work [33,34].Unbound erythrocytes were washed off gently with PBS using an automated washing system. Bound cells were fixed with 1.5% glutaraldehyde in PBS for 10 minutes, Giemsa-stained, and counted microscopically. The number of IEs bound to each receptor was determined by counting 10 fields using a 40× objective. Binding was expressed as the number of IEs bound per square millimeter. For each sample, the binding assay was done in duplicate for all receptors coated in the same plate. Results were expressed as the mean binding level of duplicate spots per sample. As a negative control, 1% BSA was used to assess binding. The positivity threshold (10 IE/mm2) was determined as the average nonspecific parasite binding to BSA increased by 2 standard deviations.
Transcript Levels of var Genes
Parasite RNA from clinical P. falciparum isolates was extracted from blood samples preserved in TRIzol reagent, following the manufacturer’s instructions. Total RNA after DNase treatment (DNase 1, Sigma-Aldrich) was reverse-transcribed into complementary DNA, and subjected to real-time qPCR using a set of primers designed to target diverse var subtypes (Supplementary Table S1). Primers were designed to maximize coverage while maintaining specificity for regions encoding specific domain subclasses based on full-length DBL and CIDR domain-encoding sequences from 7 P. falciparum genomes [14] and 226 Illumina whole-genome sequences from P. falciparum isolates [29,30]. Amplification was performed in 20 μL reactions using Quanti-Tect SYBR Green PCR Master Mix (Qiagen) with the Rotorgene thermal cycle system (Corbett Research), as described [16]. The abundance of var gene transcripts was calculated relative to the transcript level of the endogenous control genes seryl–transfer RNA synthetase and aldolase (ΔCtvar_gene = Ctvar_gene − Ctendogenous control gene). Values for ΔCt (var gene) were translated into transcript units (Tu) as described [16]. Values of ΔCtvar_gene ≥5 were assigned a value of 5, and Tu calculated as Tu = 2(5-ΔCtvar_gene). Thus, low abundant transcripts with ΔCtvar_gene values ≥5 were assigned a Tu value of 1. ΔCtvar_gene = 0 or Tu = 32, corresponding to the mean transcript level of the 2 endogenous control genes.
Statistical Analyses
Characteristics of children were compared between the clinical groups of severe malaria and uncomplicated malaria. Quantitative comparisons of transcript levels between patient groups were done separately for each primer set (a pair or cocktail) or for aggregates made from primer groups. The level of adhesion to each receptor or several receptors was tested between the different clinical groups, and between categories of parasites defined as adhering to 1 or more receptors. For quantitative variables, differences were tested using Wilcoxon rank sum test or Student t test for age. For qualitative variables, a χ2 test or a Fisher exact test were used.
Ethics Statement
This study was reviewed and approved by the ethics committee of the Research Institute of Applied Biomedical Sciences, Cotonou, Benin (no. 006/CER/ISBA/12 and no. 21/CER/ISBA/13).
RESULTS
Clinical Characteristics and Grouping of the Patients With Malaria
A total of 94 children under 6 years of age were enrolled, including 34 children with cerebral malaria (CM), 36 with severe noncerebral malaria (SM), and 24 with uncomplicated malaria (UM). Among children classified as SM, 14 had SA, and 22 hyperparasitemia. Patients’ characteristics at admission are shown in (Table 1). The proportion of children belonging to the O blood group was significantly lower in children with CM (30%) than in those with UM (67%) (P = .027). Age and body temperature were similar among clinical groups. All children with UM survived, while 13 patients (38%) with CM died.
Clinical Characteristics of Patient Groups
| Characteristic | Cerebral Malaria (N = 34) | Severe Noncerebral Malaria(N = 36) | Uncomplicated Malaria(N = 24) | P valuea |
|---|---|---|---|---|
| Age, mean years (SD) | 3.32 (1.55) | 2.85 (1.3) | 2.88 (1.18) | .63 |
| Gender (male), N (%) | 19 (55.9) | 15 (41.7) | 13 (54.2) | … |
| Blantyre score, N (%) | ||||
| 0–2 | 34 (100) | 0 | 0 | … |
| 3–4 | 0 | 5(14) | 0 | … |
| 5 | 0 | 31(86) | 24 (100) | … |
| Hemoglobin (g/dL), mean (SD) | 6.1 (2.1) | 5.6 (2.3) | 7.2 (1.9) | .04 |
| O type blood group, N (%) | 10 (29.4) | 21 (58.3) | 13 (54.2) | .03 |
| Parasitemia, median (IQR) | 36920 (9263–128000) | 263529 (40736–886667) | 17780 (6396–52400) | .002 |
| Mortality, N (%) | 13 (38.2) | 2 (5.6) | 0 (0) | <.0001 |
Abbreviation: IQR, interquartile range.
aP value was calculated with Fisher exact test or Kruskal–Wallis test.
Transcript Levels of var Genes
The transcript abundance reported by primers targeting semiconserved var regions predicted to encode CIDRα1 (EPCR-binding), CIDRα3 (subset of CD36-binding CIDRα domains), VAR2CSA (specific to placental CSA), N-terminal CIDRδ, and variegation (VAR3; unknown binding types) was measured by qPCR in patient blood samples for which adequate RNA quantities had been obtained. The delta cycle threshold (ΔCt) values of each of the various primer sets used, were calculated relative to that of 2 internal control genes, and were converted into arbitrary Tu to compare clinical groups. No difference in transcription was detected according to the blood group. The median abundance of transcript encoding CIDRα1 was high in all patient groups. The median Tu was higher in those with CM or SM compared to UM for genes encoding CIDRα1.4 (P = .04) and CIDRα1.5 (P = .03) (Table 2). When patients with severe anemia (SA) were isolated from the SM group and compared to CM patients, the levels of var transcripts encoding CIDRα1.4 were higher in CM compared to SA patients (P = .04) (Table 2). With the primers used, only transcripts encoding EPCR-binding PfEMP1 were found at high levels in all patient groups. However, the var transcript profiles varied considerably between patients (Figure S1). When data were analyzed by counting frequencies of patients with high levels (Tu > 16) of CIDRα1-encoding transcripts, predicted EPCR-binding PfEMP1 per se were again more common among parasites causing CM or SM than in UM parasites (Table 3; P = .017). When transcript levels were analyzed according to CIDRα1 subclasses of DC8 (ie, CIDRα1.1 and CIDRα1.8: “CIDRα1.DC8”) and group A (CIDRα1.4–7: CIDRα1.A), no significant differences between patient groups were found. In patients who died, transcript levels of genes predicted to encode EPCR-binding PfEMP1 were high, and did not differ from those in CM patients who survived.
var Transcript Unit Levels by Patient Group
| Primer | UM (N = 24) | CM/SM (N = 61) | P value | SA (N = 14) | CM (N = 33) | P value |
|---|---|---|---|---|---|---|
| CIDRa1.alla | 47.1 (3.4–173.5) | 44.7 (6.4–310.9) | … | 43.3 (6.1–307.5) | 41.4 (12.3–291.7) | … |
| CIDRa1.DC8b | 18.2 (1.0–142.4) | 33.8 (1.5–207.6) | … | 33.1 (1.5–207.6) | 22.6 (2.3–172.1) | … |
| CIDRa1.1 | 9.5 (1.0–127.8) | 15.3 (1.0–207.6) | … | 16.0 (1.0–207.6) | 14.6 (1.0–124.5) | … |
| CIDRa1.8c | 1.4 (1.0–22.4) | 2.6 (1.0–109.5) | … | 2.0 (1.0–109.5) | 2.9 (1.0–29.7) | … |
| CIDRa1.Ad | 10.4 (1.7–144.0) | 11.9 (1.0–157.9) | … | 11.3 (1.0–157.9) | 24.5 (2.8–120.9) | … |
| CIDRa14/6a | 1.6 (1.0–9.0) | 1.8 (1.0–27.0) | .046 | 1.4 (1.0–27.0) | 3.9 (1.0–26.6) | .038 |
| CIDRa1.5e | 1.0 (1.0–8.1) | 5.6 (1.0–17.6) | .030 | 4.5 (1.0–17.6) | 3.7 (1.0–26.9) | … |
| CIDRa1.6b | 1.0 (1.0–36.1) | 1.7 (1.0–39.1) | … | 1.4 (1.0–39.1) | 1.5 (1.0–32.9) | … |
| CIDRa1.7 | 2.6 (1.0–80.1) | 6.9 (1.0–92.8) | … | 5.9 (1.0–92.8) | 3.8 (1.0–57.2) | |
| CIDRd of DC16 | 1.0 (1.0–28.3) | 1.0 (1.0–14.4) | … | 1.0 (1.0–14.4) | 1.0 (1.0–17.6) | … |
| CIDRa2.3/5/6/7/9/10 | 6.5 (1.0–28.9) | 2.1 (1.0–13.0) | … | 1.6 (1.0–13.0) | 5.3 (1.0–917.4) | … |
| DBLa1 not VAR3 | 49.6 (8.5–149.3) | 29.0 (9.0–134.8) | … | 28.0 (9.0–134.8) | 54.1 (5.8–181.9) | … |
| DBLa2/a1.1/2/4/7 | 42.8 (3.1–128.6) | 38.7 (10.0–273.4) | … | 37.5 (10.0–273.4) | 38.3 (1.8–197.8) | … |
| DBLz4 of DC9 | 1.1 (1.0–4.6) | 2.8 (1.0–14.3) | … | 3.4 (1.0–14.3) | 1.1 (1.0–10.7) | … |
| var1 | 1.0 (1.0–9.9) | 1.0 (1.0–20.6) | … | 1.0 (1.0–20.6) | 3.7 (1.0–23.4) | … |
| var2csa | 1.7 (1.0–14.2) | 3.0 (1.0–10.3) | … | 2.9 (1.0–10.3) | 2.2 (1.0–18.4) | |
| rifA2 | 65.0 (32.1–105.6) | 69.9 (32.7–89.0) | … | 69.9 (32.7–89.0) | 49.1 (22.5–156.5) | … |
Abbreviations: CIDR, cysteine-rich interdomain region; CM, cerebral malaria; CM/SM, cerebral malaria or severe noncerebral malaria; DBL, Duffy binding-like; SA, severe anemia; UM, uncomplicated malaria.
aAggregate of all CIDRα1 subclass primers (CIDRa1.1, CIDRa1.8a, CIDRa1.8b, CIDRa1.4/6a, CIDRa1.5a, CIDRa1.5b, CIDRa1.6b, and CIDRa1.7).
bAggregate of all DC8 CIDRα1 subclass primers (CIDRa1.1, CIDRa1.8a and CIDRa1.8b).
cAggregate of 2 CIDRα1.8 subclass primers (CIDRa1.8a and CIDRa1.8b).
dAggregate of all group A CIDRα1 subclass primers (CIDRa1.4/6a, CIDRa1.5a, CIDRa1.5b, CIDRa1.6b, and CIDRa1.7).
eAggregate of 2 CIDRα1.5 subclass primers (CIDRa1.5a and CIDRa1.5b).
Percentage (and Exact Binomial 95% CI) of Parasites With Transcription Level Above 16 Units for var Genes Encoding Predicted EPCR Binders (“High EPCR”)a
| High EPCR (%) | High DC8 EPCR (%) | High A EPCR (%) | |
|---|---|---|---|
| Uncomplicated (N = 24) | 67 (45–84) | 50 (29–71) | 38 (19–59) |
| Cerebral malaria and other forms of severe malaria (N = 61) | 89 (78–95)b | 64 (51–76) | 57 (44–70) |
| Severe anemia (N = 14) | 86 (57–98) | 64 (35–87) | 36 (13–65) |
| Cerebral malaria (N = 33) | 88 (71–97) | 55 (36–72) | 61 (42–77) |
| Died (N = 15) | 86 (60–98) | 73 (45–92) | 60 (32–84) |
Abbreviations: CE, confidence interval; DC, domain cassette; EPCR, endothelial protein C receptor.
aThese genes were further divided in those predicted to encode EPCR-binding domains of DC8 (“High DC8 EPCR”) and those predicted to encode Group A EPCR-binding domains (“High A EPCR”).
bStatistically significantly higher than in uncomplicated patients (P < .02)
Expression Patterns of var in Parasites With Known Binding Properties
We investigated the cytoadhesion properties of IE for which parasite maturation to late stages (late trophozoite or schizont) was reached after a maximum of 48 hours in vitro culture. A total of 71 isolates were successfully matured in vitro into late stages, including 21 from CM, 36 from SM, and 14 from UM patients. The background binding score on BSA was very low and similar in parasites from all groups. All isolates but 1 (70 of 71) bound to CD36, while 41 bound to ICAM-1, 33 to EPCR, and 8 to CSA at low levels (Figure 2; Supplementary Figure S2; Table 4). The magnitude of adhesion as defined by the number of bound IE/mm2, was higher with CD36 (mean = 195; range 0–886) compared to ICAM-1 (64; 0–343), EPCR (42; 0–401), or CSA (4; 0–24). Binding to EPCR and ICAM-1 was more common in isolates from CM compared to UM isolates (P = .007 or P = .08, respectively), while adhesion to EPCR was less frequent in UM than in SM parasites (P = .03). No such difference was seen for adhesion to CSA. In some cases, the same isolates exhibited clear binding to more than 1 receptor (Table 4). Parasite isolates from CM (P < .007) and SM (P < .1) patients more frequently exhibited binding to both ICAM-1 and EPCR, whereas binding to CD36 was only more frequent in UM than CM patients (P < .03).
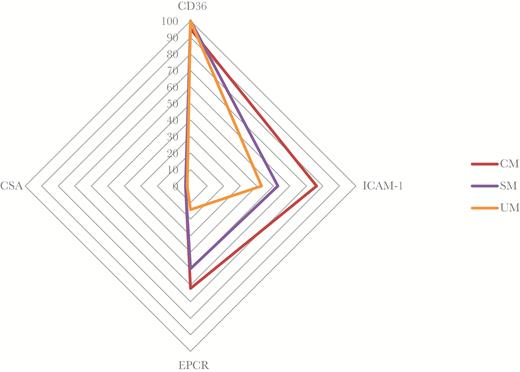
Isolates with positive binding to CD36, ICAM-1, EPCR, and CSA, depending of symptomatology. The data are shown as percentage of isolates binding to each receptor. CSA binding is rare and low, and corresponds to the negative control. ICAM-1 and EPCR binding are significantly higher in CM than in UM (P < .08 and P < .007, respectively). No significant difference in CD36 binding was observed.
Abbreviations: CM, cerebral malaria; CSA, chondroitin sulfate A; EPCR, endothelial protein C receptor; ICAM-1, intercellular adhesion molecule-1; SM, noncerebral severe malaria; UM, uncomplicated malaria.
Isolates With Positive Binding to CD36, ICAM-1, EPCR, and CSA
| Receptor | All Isolates (N = 71) | CM (N = 21) | SM (N = 36) | UM (N = 14) | CM vs UM | SM vs UM |
|---|---|---|---|---|---|---|
| CD36+ | 70 (98.6) | 20 (95.2) | 36 (100) | 14 (100) | NS | NS |
| ICAM-1+ | 41 (57.7) | 16 (76.2) | 19 (52.8) | 6 (42.9) | 0.08 | 0.75 |
| EPCR+ | 33 (46.5) | 13 (61.9) | 18 (50.0) | 2 (14.3) | 0.007 | 0.03 |
| CSA+ | 8 (11.3) | 3 (14.3) | 3 (8.3) | 2 (14.3) | 1 | 0.61 |
| CD36+/ICAM-1–/EPCR– | 26 (36.6) | 4 (19.0) | 14 (38.9) | 8 (57.1) | 0.03 | 0.52 |
| CD36+/ICAM-1+/EPCR– | 11 (15.5) | 3 (14.3) | 4 (11.1) | 4 (28.6) | 0.40 | 0.26 |
| CD36+/ICAM-1+/EPCR+ | 30 (42.3) | 13 (61.9) | 15 (41.6) | 2 (14.3) | 0.007 | 0.10 |
Data are the number and percentage of isolates that demonstrated a significant interaction with 1 or more receptors. The positivity of adhesion was estimated on the background binding level observed on the BSA + 2 SD. P values calculated using Fisher exact test; P values for comparison between CM and other SM are shown. Isolates with triple and quadruple binding properties were grouped in 1 category, as binding to CSA was rare and generally low.
Abbreviations: BSA, bovine serum albumin; CD, cluster of differentiation; CM, cerebral malaria; CSA, chondroitin sulfate A; EPCR, endothelial protein C receptor; ICAM-1, intercellular adhesion molecule-1; SM, noncerebral severe malaria; UM, uncomplicated malaria.
By grouping the parasite isolates by adhesion property rather than by clinical category, we defined 2 categories as follows: parasite isolates that only bound CD36, and isolates that bound CD36, ICAM-1, and EPCR; and compared var transcript abundances in these groups. Compared to isolates only binding CD36, isolates binding to multiple receptors had higher levels of transcripts encoding PfEMP1 that contained DBLβ3 (P < .03) and CIDRα1.4 (P < .06) (Supplementary Table S2).
DISCUSSION
Accumulated evidence shows that severe malaria is associated with the parasite preferential expression of groupa A and B/A PfEMP1, specifically those containing EPCR-binding CIDRα1 domains [16–18]. Our ability to quantify the var transcriptome using qPCR is limited by the difficulty of targeting the highly polymorphic group B and C var genes encoding CD36 binding domains. Specifically, the estimated coverage of this group is approximately 17% for the primers applied here. Furthermore, caution should be made when comparing transcript levels reported by different degenerate primer pairs within a patient group. However, the levels of transcripts encoding EPCR-binding PfEMP1 were similar to those recently reported in Mkumbaye and colleagues [30], and in agreement with the observations on var type distribution in severe malaria patients [17], suggesting that transcripts encoding EPCR-binding CIDRα1 domains (CIDRa1.all; Table 2) is a common and dominant binding phenotype in pediatric malaria patients requiring hospital admission, and that var genes encoding EPCR-binding CIDRα1 domains play a key role in the pathophysiology of P. falciparum infections.
The present data in line with previous observations [17,30], however, indicate that a specific subset of group A EPCR-binding PfEMP1 with CIDRα1.4 (found in DC13) and CIDRα1.5 are parasite factors with the capacity for a mode of cytoadhesion, which may lead to adverse clinical complications. Recently, a defined subset of ICAM-1-binding group A DBLβ1/3 domains were associated with a subset of EPCR-binding PfEMP1, including proteins with CIDRα1.4/1.5 domains [31]. Previous attempts to correlate cerebral malaria with the cognate parasite isolate’s ability to bind ICAM-1 have produced inconsistent results [36,37]. It is now clear that ICAM-1 binding resides both in PfEMP1 with CD36 and EPCR binding traits. This, and the great diversity of the var genes, has contributed to the difficulty of assessing the relevance of ICAM-1 binding to severe malaria. The present study is in agreement with the recent study [30] using specific qPCR primers targeting a defined group A DBLβ sequence motif that predicts ICAM-1 binding. The observations linking the co-occurrence of this motif and EPCR-binding CIDRα1 domain subclasses in transcribed var gene sequences to CM [30] suggest that ICAM-1 binding may indeed augment pathogenesis when occurring with EPCR binding, but that ICAM-1 binding is not by itself a driver of cerebral malaria [26,38,39].
In regions where malaria is endemic, blood group O is observed at a very high prevalence rate. In Nigeria, more than half of the population belongs to blood group O. In this study, the proportion of blood group O patients was in the same range (47%), but interestingly, it was particularly low in patients suffering from CM (less than 30%). In our study, we could not demonstrate differences in var gene transcript abundances as a function of blood group. Blood group O is known to be associated with protection against CM, although the mechanism behind this is still not clear. However, a study reported reduced rosette formation ability within this group [40].
In the present study, we explored the adherence phenotypes of patient’s parasite isolates to the 4 major endothelial receptors of IE. The results indicate that patient isolates from children with different clinical presentations of malaria contain parasite populations with different receptor binding phenotypes (mainly CD36, ICAM-1, and EPCR). Adhesion to CD36 was ubiquitous (Figure 2, Supplementary Figure S2), likely reflecting the ease of detecting and measuring the adhesion to CD36 in line with previous reports [33]. While the binding assays (in order to keep stringency and low-background binding) only characterizes a small fraction of the added parasites, the consistent binding to CD36 may also suggest a more frequent use of this receptor by the infecting parasites, and stresses the importance of CD36 binding for parasite survival in severe malaria as well. However, the proportion of isolates exhibiting binding to only CD36 was higher among isolates from UM patients than isolates from SM patients; and binding to EPCR and ICAM-1 were more common in isolates from SM and CM patients compared to those of UM. This is consistent with EPCR binding being the key interaction driving pathogenesis, and previous work suggesting that involvement of multiple receptors promote severe malaria pathogenesis [39]. For the first time, we confirm this hypothesis by investigating both binding phenotypes and var gene transcription of parasites directly isolated from patients. Specifically, binding of ICAM-1 and EPCR may constitute a factor aggravating malaria presentation, as suggested earlier [31]. Compared to isolates binding CD36 only, multiple-receptor-binding isolates preferentially transcribe var genes that encode PfEMP1 containing DBLβ3 and CIDRα1.4 (ie, likely PfEMP1 involved in adhesion to both ICAM-1 and EPCR) [32]. Although this study does not demonstrate that the binding properties measured on a parasite population are also carried by individual parasites through the expression of a single or several different PfEMP1 on the surface of the same IE, these observations are consistent with the hypothesis of an additive effect of IE adhesiveness on the virulence of P. falciparum malaria infections. Further studies are needed to assess multiadhesive capacities of PfEMP1 expressed in isolates from SM and CM patients.
In conclusion, this study complements previous observations and strongly suggests the ability of IE to bind multiple receptors in conjunction with EPCR, representing a true complicating factor for malaria disease such as cerebral malaria.
Supplementary Data
Supplementary materials are available at The Journal of Infectious Diseases online. Consisting of data provided by the authors to benefit the reader, the posted materials are not copyedited and are the sole responsibility of the authors, so questions or comments should be addressed to the corresponding author.
Notes
Acknowledgments. We are deeply grateful to the children and parents who participated in the study in Benin. We are very grateful to Professor Alister Craig who graciously provided us with parasites selected to bind ICAM-1 that have been used to optimize our assay.
Financial support. This work was supported by the Program of Excellence for Education and Research in the South (PEERS) at the Institute for Development Research (IRD) (PEERS-EPIVAC), Augustinus Fonden, Lundbeckfonden, Axel Muusfeldts Fond, Grosserer L.F. Foghts Fond, the Danish International Development Agency (DANIDA), and by the Danish Council for Independent Research 1333-00220 ( to C. W.) and 1331-00089B,4004-00624B (to T. L.).
Potential conflicts of interest. All authors: No reported conflicts of interest. All authors have submitted the ICMJE Form for Disclosure of Potential Conflicts of Interest. Conflicts that the editors consider relevant to the content of the manuscript have been disclosed.
References
Author notes
Correspondence: N. Tuikue Ndam, PhD, IRD-UMR216, Mère et enfant face aux infections tropicales, Institut de Recherche pour le développement, COMUE Sorbonne Paris Cité, Faculté de pharmacie, Laboratoire d’Excellence GR-Ex, DHU Risques et Grossesse, 4, avenue de l'Observatoire, Paris 75006, France ([email protected]).

