


Abstract
We sought to characterize dengue virus (DENV) infections among febrile children enrolled in a pediatric cohort study who were clinically diagnosed with a non-dengue illness (“C cases”).
DENV infections were detected and viral load quantitated by real-time reverse transcription-polymerase chain reaction in C cases presenting between January 2007 and January 2013.
One hundred forty-one of 2892 C cases (4.88%) tested positive for DENV. Of all febrile cases in the study, DENV-positive C cases accounted for an estimated 52.0% of patients with DENV viremia at presentation. Compared with previously detected, symptomatic dengue cases, DENV-positive C cases were significantly less likely to develop long-lasting humoral immune responses to DENV, as measured in healthy annual serum samples (79.7% vs 47.8%; P < .001). Humoral immunity was associated with viral load at presentation: 40 of 43 patients (93.0%) with a viral load ≥7.0 log10 copies/mL serum developed the expected rise in anti-DENV antibodies in annual samples versus 13 of 68 (19.1%) patients with a viral load below this level (P < .001).
Antibody responses to DENV-positive C cases differ from responses to classic symptomatic dengue. These findings have important implications for DENV transmission modeling, immunology, and epidemiologic surveillance.
Dengue virus (DENV) is the most common human arbovirus worldwide, with an estimated 23.6–121.9 million symptomatic dengue cases occurring annually [1, 2]. The classic presentation of a symptomatic DENV infection is an acute-onset fever with headache, retro-orbital pain, and severe myalgias and arthralgias [3]. However, the range of clinical manifestations associated with DENV infections is broad, and atypical presentations have been documented [4–6]. Additionally, up to 75% of DENV infections in large cohort studies are not clinically detected [7–11]. These infections may be asymptomatic or subclinical. Alternatively, they may present with atypical manifestations or as coinfections with other pathogens that lead to another diagnosis [12]. Such DENV infections are typically detected by serological testing of sequential healthy serum samples for seroconversion or a ≥4-fold rise in anti-DENV antibodies [7, 8].
Long-lived protective immunity is thought to develop after a primary infection with 1 of 4 related DENV serotypes (DENV-1–4), regardless of the clinical manifestations associated with the infection [1, 13–16]. Immunity to the noninfecting serotypes wanes over time, leaving patients at risk for secondary infections, which carry an increased risk for the development of severe dengue [3, 16]. However, recent studies in Nicaragua and Peru have demonstrated that individuals can be reinfected with the same DENV serotype (homotypic reinfections) [17, 18]. In Nicaragua, homotypic reinfections were virologically confirmed by testing serum from patients who presented with an acute febrile illness but were clinically diagnosed with a non-dengue illness (“C cases”) [18]. These data argue against the presumption that immunologic responses to such atypical and/or subclinical DENV infections are similar to responses observed in typical symptomatic cases.
The Pediatric Dengue Cohort Study (PDCS) is a community-based, prospective cohort study established in 2004 and based in Managua, Nicaragua [8, 9, 19]. As part of this study, children aged 2–14 years receive all primary medical care from study physicians at the Sócrates Flores Vivas Health Center, and all information is systematically collected on clinical report forms. Children who present with fever are clinically screened for dengue and categorized as A, B, or C cases based on signs and symptoms [19]. “A cases” are suspected dengue cases that meet the 1997 World Health Organization (WHO) criteria for probable dengue fever [20]. “B cases” are patients with an undifferentiated febrile illness that do not meet the 1997 WHO criteria but lack another identifiable source of infection. A and B cases are prospectively tested for DENV as part of the PDCS. Since 2007, acute-phase serum samples have been collected from patients with an acute febrile illness and signs and/or symptoms that suggest a diagnosis other than dengue (“C cases”). C cases account for approximately 75% of all febrile cases in the PDCS [19]. However, only small numbers of these samples have been tested for DENV. The rationale for the current study was to characterize DENV infections detected among C cases to provide an evaluation of atypical and/or subclinical DENV infections that were not identified in the acute setting.
METHODS
Ethics Statement
The study protocol was reviewed and approved by the institutional review boards of the Nicaraguan Ministry of Health; the University of California, Berkeley; and Stanford University.
C Cases
We tested archived, acute-phase serum samples collected from C cases. Initially, samples from each month of 2007 were screened for DENV to determine the seasonality of DENV detection among these cases (Supplementary Figure 1). Based on these initial results, samples were selected from the period of highest DENV incidence in Managua (August–January) for the seasons 2008–2012 (the last month included was January 2013) (Supplementary Table 1). Up to 75 samples were randomly selected from each month in the study period; for months with <75 samples available, all samples were included.
C-Case Molecular Testing
Serum samples were stored at −80°C until use. Total nucleic acids were extracted on an easyMAG instrument (Biomerieux) using 140 µL of serum and a 60-µL elution volume. Extractions were performed according to the manufacturer’s recommendations. Eluates were stored in two aliquots for (1) screening and DENV serotyping and (2) quantitation of viral load. Samples were screened using a multiplex, real-time nucleic acid amplification test for DENV, Leptospira, and Plasmodium species, as previously described [21]. C cases were considered positive for DENV if DENV RNA was detected using this multiplex assay. Dengue virus–positive samples were tested in a serotype- specific DENV multiplex real-time reverse transcription polymerase chain reaction (rRT-PCR) to determine serotype and quantitate viral load [22, 23]. For quantitation, samples were batched by serotype and tested in duplicate on a single run; viral load was calculated using the mean Ct value. Quantitation runs included a 4-point standard curve (8.0, 6.0, 4.0, and 2.0 log10 copies/µL) for the serotype in question, which was also run in duplicate.
Annual Samples
Healthy annual serum samples were collected from all study participants in the PDCS in June and July of 2008–2010 and in March and April of 2011–2013 [19]. Each year, paired annual samples were tested side by side for total anti-DENV antibody using a DENV-specific inhibition enzyme-linked immunosorbent assay (ELISA), which was performed and interpreted as described [9, 10, 14, 24–26], and annual sample inhibition ELISA results were used to categorize DENV-positive C cases as primary or secondary DENV infections. Each sample was tested at an initial dilution of 1:10, and positive samples were then tested at 2-fold dilutions from 1:20 to 1:5120. Samples were positive if the percentage of inhibition was >50% relative to negative controls [25]. In paired annual samples, seroconversion from a titer of <1:10 to ≥1:10 by inhibition ELISA was considered primary DENV infection, whereas a ≥4-fold increase in antibody titer was considered secondary infection [10].
A/B Cases
Calculations involving A/B dengue cases were limited to 542 cases that tested positive for DENV RNA at presentation and hence had confirmation of the infecting DENV serotype. A/B dengue cases had been tested prospectively per PDCS study protocol (Figure 1). Viremia was detected and serotype confirmed using a hemi-nested RT-PCR [27]. A/B cases had acute- and convalescent-phase sera tested for anti-DENV antibodies by inhibition ELISA [10, 14]. Inhibition ELISA results from acute and convalescent samples were considered as consistent with a primary DENV infection if the convalescent antibody titer was <2560 and with a secondary DENV infection if the convalescent antibody titer was ≥2560 [28]. For the study of repeat DENV infections, only patients who did not have detectable anti-DENV antibodies by inhibition ELISA at study entry (DENV-naive) were included, limiting the evaluation to patients for whom a primary DENV infection was identified.
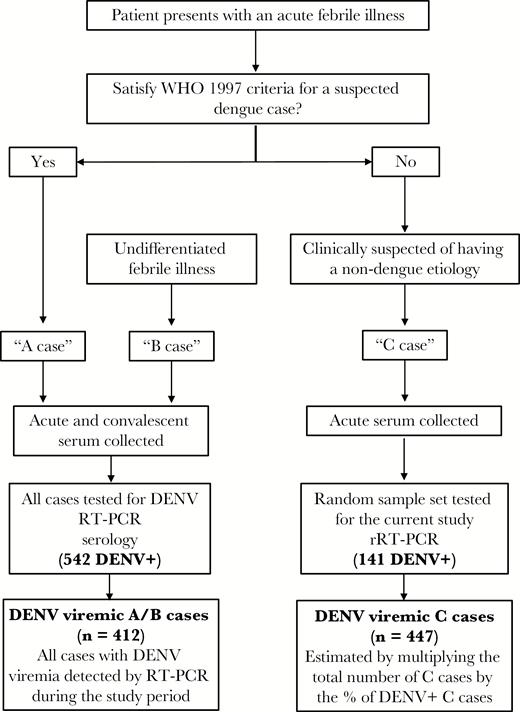
Flowchart showing the organization of and testing performed for febrile cases in the Pediatric Dengue Cohort Study. All patients had healthy, annual serum samples obtained during each year of participation in the study. The number of A/B and C cases that tested positive for dengue virus (DENV) by reverse-transcription polymerase chain reaction (RT-PCR) are shown. The number of cases with DENV viremia in the study period is shown in the last box; this is the number detected by RT-PCR for A/B cases and the estimated number of C cases. Abbreviations: DENV, dengue virus; RT-PCR, reverse-transcription polymerase chain reaction; rRT-PCR, real-time reverse transcription polymerase chain reaction; WHO, World Health Organization.
Case–Control Study
A case–control study was performed to determine whether DENV-positive C cases could be clinically differentiated from DENV-negative C cases and therefore identified prospectively. C-case DENV infections with a confirmed serotype (cases) were matched with 2 DENV-negative C cases (controls) based on age, sex, and month and year of illness. Cases and controls were compared using data collected on standardized study questionnaires at the time of presentation (Supplementary Table 2). A prespecified subgroup analysis was also performed on C-case DENV infections based on the results of annual sample testing (positive/negative).
Statistics
Basic statistics were performed using Excel software (Microsoft). Categorical variables were compared using Fisher’s exact and χ2 tests. Continuous variables were compared by t test. Fisher’s exact, χ2, and t tests were performed using GraphPad software (GraphPad). Average values are expressed as mean ± standard deviation (SD). For the case–control study, R software (version 3.0) was used to evaluate generalized linear models to identify variables associated with DENV detection among C cases. In the study of antibody detection in annual samples, generalized linear mixed models were evaluated to identify variables associated with positive annual sample results (see Supplementary Data).
RESULTS
C-Case Dengue Virus Infections
Of 2892 samples included in the final analysis, 141 C cases (4.88%) tested positive for DENV RNA. Figure 2 shows the distribution of DENV infections by serotype and dengue season. The incidence of DENV detection among C cases ranged from 10.0% in 2007–2008 to 0.8% in 2008–2009. Dengue virus serotype was confirmed in 130 of 141 (92.2%) C cases that tested positive for DENV RNA. Infections with DENV-1 (n = 29), DENV-2 (n = 44), and DENV-3 (n = 57) were identified, with the predominant serotype differing between dengue seasons (Figure 2). Serotype could not be confirmed in 11 cases (see Supplementary Data). Dengue virus serotype distribution was consistent with previously detected symptomatic dengue cases in the PDCS (Supplementary Figure 2) [10, 29].
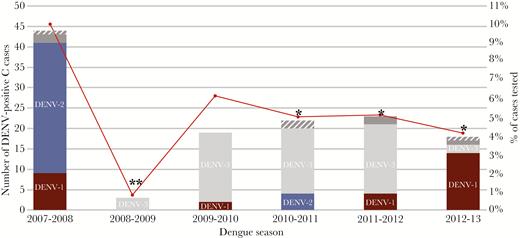
Distribution of C-case dengue virus (DENV) infections by serotype and dengue season in Managua, 2007–2008 to 2012–2013. Total number (left axis, bars) and percentage positive of all cases tested (right axis, red circles) during the dengue season (August–January) are displayed. Six samples produced late signals in the DENV serotyping assay and serotype could not be accurately determined (gray). Five samples only tested positive in the screening assay (striped gray). Comparisons of the percentage of C cases that tested positive for DENV versus 2007–2008 (*, P < .01) and versus all other seasons (**, P < .005 for all comparisons) are shown for each season. DENV-1 (maroon), DENV-2 (blue), DENV-3 (light gray). Abbreviation: DENV, dengue virus.
Viral load at presentation was quantified for serotype-confirmed C-case DENV infections, and results are shown in Figure 3. Viral load in DENV-2 infections (mean = 5.1 log10 copies/mL of serum; SD = 1.8) was significantly lower than DENV-1 (mean = 6.5 log10 copies/mL of serum; SD = 2.1; P = .003) or DENV-3 (mean = 6.2 log10 copies/mL of serum; SD = 2.5; P = .02) infections. However, there was marked overlap in the distribution of viral load for each serotype.

Viral load in C-case dengue virus (DENV) infections by serotype. Serum viral load is displayed as log10 copies per milliliter. Mean viral load is represented by a black line. Viral load observed in DENV-2 infections was significantly lower than in DENV-1 (P = .003) or DENV-3 (P = .02). Abbreviation: DENV, dengue virus.
Estimating the Contribution of C Cases to All Febrile Cases in the Pediatric Dengue Cohort Study With Dengue Virus Viremia
To estimate the percentage of all febrile cases in the PDCS with DENV viremia that were accounted for by DENV-positive C cases, the total number of C cases recorded in a dengue season was multiplied by the percentage of C cases from the same season that tested positive for DENV as part of this study (Figures 1 and 2). Based on this, an estimated 447 C cases with DENV viremia at presentation occurred during the study period. This number was compared with the number of DENV RNA-positive A/B cases that had previously been detected from the same period as part of the PDCS (n = 412) (Supplementary Figure 2).
Overall, an estimated 447 of 859 (52.0%; 95% confidence interval (CI) = 48.7%–55.4%] febrile children in the PDCS who had DENV viremia at presentation were C cases. However, the percentage varied significantly between years in the study period, with C cases accounting for a significantly higher percentage of viremic cases in 2007–2008 and 2011–2012 combined (n = 225/307; 73.3%; 95% CI = 68.1%–77.9%) compared with other years (n = 222/552; 40.2%, 95% CI = 36.2%–44.4%; P < .001) (Figure 4]. Mean viral load for the predominant serotypes detected in a given season was significantly lower in years with a high percentage of C-case DENV infections (2007–2008 and 2011–2012: mean = 5.3 log10 copies/mL of serum; SD = 2.1) compared with other years (mean = 7.1 log10 copies/mL of serum; SD = 2.0; P < .001) (Supplementary Figure 3).
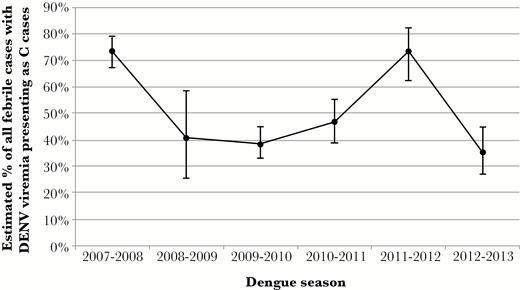
Percentage of febrile cases with detectable dengue virus (DENV) viremia who presented as C cases by dengue season. The estimated number of DENV-positive C cases in a dengue season was divided by the total number of febrile cases with detectable DENV viremia during that season (including A/B and C cases) multiplied by 100 to obtain a percentage. Displayed as percentage with 95% confidence intervals.
Case–Control Study
One hundred thirty DENV-positive C cases with a confirmed serotype were matched with 260 controls. Patient data and clinical diagnoses are shown in Table 1. Cases and controls did not differ based on day of fever, day after symptom onset at presentation, or the number of visits for the current illness. The single most common clinical diagnosis in cases and controls was an upper respiratory tract infection, and the most common symptoms included rhinorrhea and cough. When grouped together, the clinical diagnosis of infections of the respiratory tract accounted for 103 of 130 diagnoses (79.2%) among cases and 211 of 260 diagnoses (81.2%) among the controls.
Comparison of Cases (Dengue Virus–Positive C Cases) and Controls (Dengue Virus–Negative C Cases), Including Clinical Information and the Recorded Clinical Diagnosis
| Clinical Data | Cases | Controls | P value |
|---|---|---|---|
| Number | 130 (100) | 260 (100) | |
| Patient data | |||
| Male | 63 (48.5) | 126 (48.5) | 1.000 |
| First visit for current illness | 124 (95.4) | 256 (98.5) | .09 |
| Age, y, mean (SD) | 7.1 (3.2) | 7.1 (3.2) | .996 |
| Day of fever, mean (SD) | 2.0 (1.0) | 2.0 (0.8) | .84 |
| Day of postsymptom onset, mean (SD) | 2.7 (1.7) | 2.6 (1.5) | .86 |
| Clinical diagnosis | |||
| URI | 65 (50.0) | 150 (57.7) | .16 |
| Tonsillitis | 31 (23.8) | 34 (13.1) | .009 |
| Urinary tract infection | 8 (6.2) | 15 (5.8) | 1.00 |
| Viral pharyngitis | 6 (4.6) | 14 (5.4) | .81 |
| Diarrhea | 7 (5.4) | 15 (5.0) | 1.00 |
| Other | 13 (10.0) | 34 (13.1) | .41 |
Data are no. (%) unless otherwise noted.
Abbreviations: SD, standard deviation; URI, upper respiratory tract infection.
The majority of analyzed clinical variables occurred in a similar proportion of cases and controls. Variables that differed between groups (P ≤ .10) were included in a multivariable analysis to identify clinical presentations that were associated with DENV detection (Supplementary Table 3). In the best-fit model, only headache and urinary symptoms remained significant. Headache was more common among cases (62/130; [47.7%] vs 93/260 [35.8%]; multivariable P = .02), and urinary symptoms were less common among cases (1/130 [0.8%] vs 14/260 [5.4%]; multivariable P = .04). A measured fever at presentation was more common among cases versus controls. Although this difference was not significant in multivariable analysis, fever remained in the best-fit model (Supplementary Table 3). Other vital signs did not differ between cases and controls (data not shown).
Antibody Responses to Secondary Dengue Virus Infections
To evaluate the immunologic sequelae of C-case DENV infections, convalescent antibody titers were compared for A/B dengue cases that followed a primary C-case DENV infection (n = 8) or a primary A/B dengue case (n = 16). Time between the first and second infection was not significantly different for the 2 groups (844 [SD = 783] days vs 1132 [SD = 503] days, respectively; P = .27]. Convalescent samples were collected an average of 18.0 days (SD = 4.1) after symptom onset, and this duration did not differ between groups (data not shown). All patients who had a primary A/B dengue case developed the expected rise in inhibition ELISA titer after the secondary A/B dengue case (reciprocal titer ≥2560). In contrast, only 1 of 8 (12.5%) patients with a primary C-case DENV infection developed the expected response after the secondary infection (P < .001) (Supplementary Figure 4); rather, inhibition ELISA titers in these cases were consistent with primary DENV infections.
Antibody Response to C-Case Dengue Virus Infections
One hundred eleven of 130 C cases (85.4%) and 235 of 260 controls (90.4%) had paired inhibition ELISA results from annual samples collected before and after the C case tested for this study. Fifty-three cases (47.8%) and 18 controls (7.7%) had positive annual sample results (P < .001). The percentage of C-case DENV infections with a positive annual sample was significantly lower than the expected percentage from previous studies of A/B dengue cases in the PDCS (79.7%; P < .001 by χ2 test) [10]. Clinically, C-case DENV infections with positive annual samples were more likely to be febrile at presentation (n = 32/53; 60.4%) than patients with negative annual samples (n = 17/58; 29.3%; P = .001). Presenting complaints and clinical diagnoses were otherwise similar between these 2 groups (data not shown).
To identify patient and viral factors associated with positive annual sample results, C-case DENV infections with positive annual samples were compared with those with negative annual samples. Annual samples from these cases were collected a mean of 211 days after the start of the C case (SD = 78; range = 39–345). Results of univariate and multivariable analyses are shown in Table 2. In the best-fit multivariable model, only viral load at presentation (P < .001) and infection with DENV-3 (P = .03) were significantly associated with positive annual sample results. The association between viral load and annual sample results is displayed in Figure 5 based on primary/secondary infection status (Figure 5A) and day of fever at presentation (Figure 5B). A viral load of 7.0 log10 copies/mL of serum differentiated C-case DENV infections that had positive and negative annual samples: 40 of 43 patients (93.0%) with a viral load above this threshold had positive annual samples compared with 13 of 68 patients (19.1%) with a viral load below this threshold (P < .001).
Univariate and Multivariable Analysis of Patient and Viral Factors for C-Case Dengue Virus Infections With Positive and Negative Annual Sample Test Results
| Multivariable analysisa | ||||||
|---|---|---|---|---|---|---|
| Patient and Viral Factors | Annual sample positive | Annual sample negative | Univariate P value | Log odds (Ln) | Standard error | P value |
| Number (%) | 53 (100) | 58 (100) | ||||
| Male, no. (%)b | 27 (50.9) | 29 (50.0) | 1.00 | |||
| Age, mean (SD) | 7.7 (3.0) | 6.0 (2.8) | .002 | … | … | … |
| Day of fever, mean (SD) | 1.9 (0.9) | 2.0 (1.1) | .51 | … | … | … |
| Day postsymptom onset, mean (SD) | 2.4 (1.3) | 2.9 (1.8) | .09 | −0.096 | 0.284 | .74 |
| Viral load,c geometric mean (SD) | 7.6 (1.5) | 4.5 (1.6) | <.001 | 1.164d | 0.201 | <.001 |
| Primary infection, no. (%) | 33 (62.3) | 39 (67.2) | .69 | … | … | … |
| First fever to annual sample, mean days (SD)e | 190.9 (55.3) | 226.6 (92.5) | .02 | … | … | … |
| DENV serotype, no. (%)f | ||||||
| DENV-1 | 13 (24.5) | 14 (24.1) | 1.00 | Reference | ||
| DENV-2 | 6 (11.3) | 31 (53.4) | <.001 | 1.848 | 1.269 | .15 |
| DENV-3 | 34 (64.2) | 13 (22.4) | <.001 | 2.457 | 1.088 | .03 |
Abbreviations: DENV, dengue virus; SD, standard deviation.
aVariables indicated … were not included in the best-fit model.
bSex was not included in multivariable analysis.
cViral load is expressed as log10 copies/mL serum.
dOdds of a positive annual sample increase by e1.164x, where “x” represents each 1.0 log10 copies/mL increase in viral load (ie, the odds of having a positive annual sample with a viral load of 7.0 vs 4.0 log10 copies/mL is e3.492, or 32.85)
eCalculated as the time between the date of a patient’s first fever and collection of the postinfection annual sample.
fDENV-1 was used as the reference serotype in multivariable analysis.
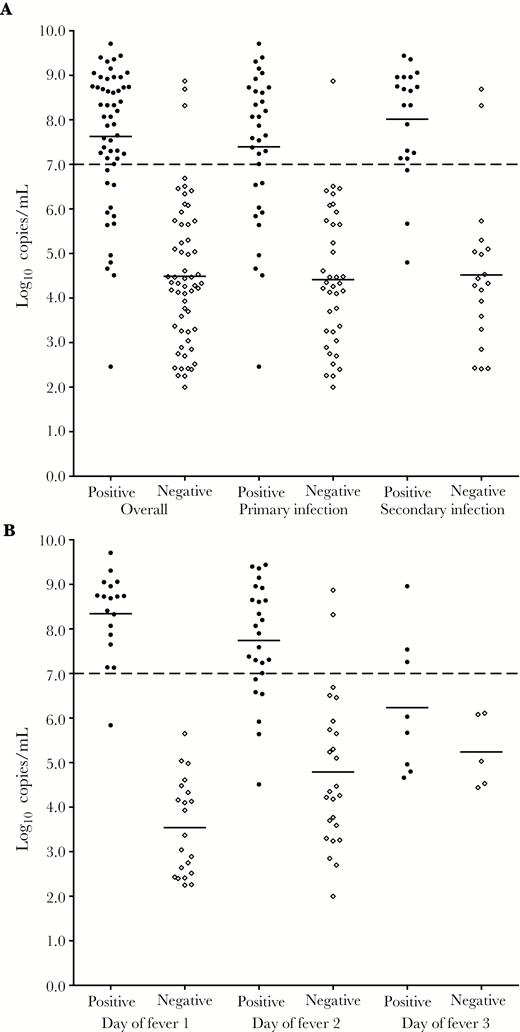
Viral load and annual sample inhibition enzyme-linked immunosorbent assay results for C-case dengue virus (DENV) infections. A, Infection status (primary vs secondary infection). Patients with positive annual sample results (black circles) had significantly higher viral loads on days 1 or 2 of fever compared with patients with negative annual samples (open diamonds) regardless of immune status (P < .001 for all comparisons). Annual sample results could not be interpreted for 18 patients, who were removed from analysis (16 patients were missing 1 annual sample; 2 patients had a second DENV infection during the same season). B, Day of fever at presentation. Day of fever analysis was limited to individuals who presented within the first 3 days of fever (n = 103). Mean viral loads on days 1 and 2 of fever were significantly higher among patients with positive annual samples versus those with negative annual samples (P < .0001 for both comparisons). The difference for patients who presented on day of fever 3 was not significant (P = .21). Mean viral loads are represented by solid bars.
DISCUSSION
Although only 4.88% of C cases tested positive for DENV in the current study, C-case DENV infections were estimated to account for 52.0% of all febrile cases with detectable DENV viremia at presentation. This percentage was higher in dengue seasons when a particular serotype had been predominant in Managua for a number of years: DENV-2 in 2007–2008 (which had been predominant since 2005–2006) and DENV-3 in 2011–2012 (which had been predominant since 2009–2010) [10]. Mean viral load in DENV-positive C cases was lower during these seasons (2007–2008 and 2011–2012), which may partially explain our finding of a lower mean viral load in DENV-2 infections compared with infections with DENV-1 or DENV-3. Although these results are similar to findings from other DENV-endemic regions [30, 31], previous studies did not evaluate viral load in relation to duration of time that a particular serotype had been circulating.
The immunological response to and sequelae from C-case DENV infections appear to differ from “typical” A/B dengue cases. Patients who had a documented symptomatic dengue case that followed a primary C-case DENV infection developed antibody responses that were consistent with a primary infection, despite experiencing a virologically confirmed secondary infection. Additionally, C-case DENV infections elicited long-term humoral immune responses (detected in annual samples) less often than A/B dengue cases identified in the cohort. Interestingly, high viral load at presentation was associated with the development of long-term humoral immunity in C-case DENV infections. Although consistent with the concept that less severe infections, represented here by lower viral loads, result in a less robust immune response, to our knowledge, this finding has not been reported following natural human infection with DENV or other viral pathogens that cause an acute, systemic febrile illness.
Viral loads detected in many C-case infections were at a level sufficient to transmit DENV to Aedes mosquitoes and contribute to ongoing DENV transmission [32, 33]. A viremia threshold of 7.0 log10 copies/mL of serum at presentation was identified, which discriminated between C-case DENV infections with positive and negative annual sample results. Notably, this is similar to the 50% mosquito infectious dose that has been identified in studies of human transmission of DENV to Aedes mosquitoes [32–34], and in years that followed a dengue season in which the mean viral load at presentation was lower than this threshold, a new DENV serotype emerged in Managua.
Taken together, our findings are consistent with the repeated exposure of children in Managua to a particular DENV serotype during the period that it is predominant, as suggested by a study of neutralizing antibody responses in the PDCS [13]. Later infections, identified in this study by cases in the last year in which a serotype was predominant, are apparently controlled, although not necessarily prevented, by host immune responses. This results in lower viral loads and the absence of expected results for inhibition ELISA testing in annual samples. Such cases also demonstrate the limitations of estimating DENV incidence through serologic testing.
Patients in this study predominantly presented with signs and symptoms of a respiratory tract illness. This is not typically considered a manifestation of acute dengue, and DENV infections in this study may have been asymptomatic yet detected by testing patients who presented with a separate, concomitant illness. In support of this, no clinical findings reliably differentiated DENV-positive from DENV-negative C cases. However, respiratory complaints, particularly early in the course of symptomatic DENV infections, have been reported [4, 5, 35, 36]. Our findings, therefore, demonstrate the difficulty of using clinical criteria to differentiate DENV from other causes of acute febrile illness [12, 28] and highlight the need for accurate diagnostics that can identify DENV during a single patient encounter.
Limitations of this study include the lack of available convalescent samples from C cases. This precluded our ability to analyze antibody responses in paired acute and convalescent specimens. However, long-term antibody responses were assessed using annual sample results, and these data were compared directly with annual sample results from A/B dengue cases. Importantly, all C-case DENV infections included in the case–control study and analysis of annual sample results tested positive by rRT-PCR in at least 3 separate reactions. Because only acute specimens were available, other testing methods would likely have been minimally informative: NS1 testing previously demonstrated poor sensitivity in this patient population, and the majority of samples in this study were collected on days of illness 1–3, prior to the expected development of anti-DENV immunoglobulin M [37].
In conclusion, we describe a set of DENV infections among febrile children who were clinically diagnosed with a non- dengue illness. These cases account for a substantial proportion of febrile patients with detectable viremia at presentation, and clinically, DENV-positive and DENV-negative cases cannot be reliably distinguished. In this set of patients, long-term humoral immune responses were associated with viral load at presentation. Given the common use of serologic results for the study of acute viral infections, these data have important implications for the detection of recent infections, estimates of DENV incidence, and modeling virus transmission.
Supplementary Data
Supplementary materials are available at The Journal of Infectious Diseases online. Consisting of data provided by the authors to benefit the reader, the posted materials are not copyedited and are the sole responsibility of the authors, so questions or comments should be addressed to the corresponding author.
Notes
Acknowledgments. The authors would like to thank Thuy Doan for her careful and critical reading of the manuscript and Norm Cyr for his assistance with formatting the figures. The authors also thank the staff at the Stanford Clinical Virology Laboratory for their support during the course of this research. The authors are grateful to past and present members of the study team based at the Centro de Salud Sócrates Flores Vivas, the National Virology Laboratory in the Centro Nacional de Diagnóstico y Referencia of the Nicaraguan Ministry of Health, and the Sustainable Sciences Institute in Managua, Nicaragua, for their dedication and high-quality work, as well as to the study participants and their families.
Financial support. This study was supported by Early Career Award 11979 from the Thrasher Research Fund (to J. J. W.) and the National Institute of Allergy and Infectious Diseases (NIAID) of the National Institutes of Health (NIH) grant K08AI110528 (to J. J. W.). The PDCS was supported by the Pediatric Dengue Vaccine Initiative grant VE-1 (to E. H.), NIAID/NIH R01 AI099631 (to A. B.) and HHSN2722001000026C (to A. B., E. H.), and a grant from the Bill and Melinda Gates Foundation and the Instituto Carlos Slim de la Salud (FIRST; to E. H.). The funders had no role in study design, data collection and analysis, decision to publish, or preparation of the manuscript.
Potential conflicts of interest. All authors: No reported conflicts of interest. All authors have submitted the ICMJE Form for Disclosure of Potential Conflicts of Interest. Conflicts that the editors consider relevant to the content of the manuscript have been disclosed.
References
Author notes
aPresent affiliation: J. J. W.: Department of Medicine, Division of Infectious Diseases, Emory University, Atlanta, Georgia; A. M.-H.: Nexgen Pathology, Port of Spain, Trinidad and Tobago; J. A.: Medical Research Institute, Colombo, Sri Lanka
Correspondence: B. A. Pinsky, MD, PhD, 3375 Hillview Ave, Room 2913, Palo Alto, CA 94304 ([email protected]).

