


Abstract
Background. Antigenic variation in Plasmodium falciparum is mediated by the multicopy var gene family. Each parasite possesses about 60 var genes, and switching between active var loci results in antigenic variation. In the current study, the effect of mosquito and host passage on in vitro var gene transcription was investigated.
Methods. Thirty malaria-naive individuals were inoculated by intradermal or intravenous injection with cryopreserved, isogenic NF54 P. falciparum sporozoites (PfSPZ) generated from 1 premosquito culture. Microscopic parasitemia developed in 22 individuals, and 21 in vitro cultures were established. The var gene transcript levels were determined in early and late postpatient cultures and in the premosquito culture.
Results. At the early time point, all cultures preferentially transcribed 8 subtelomeric var genes. Intradermal infections had higher var gene transcript levels than intravenous infections and a significantly longer intrahost replication time (P = .03). At the late time point, 9 subtelomeric and 8 central var genes were transcribed at the same levels in almost all cultures. Premosquito and late postpatient cultures transcribed the same subtelomeric and central var genes, except for var2csa.
Conclusions. The duration of intrahost replication influences in vitro var gene transcript patterns. Differences between premosquito and postpatient cultures decrease with prolonged in vitro growth.
The protozoan parasite Plasmodium falciparum causes the most severe form of malaria and is responsible for the death of approximately half a million African children per year [1]. P. falciparum malaria is a consequence of cytoadhesion of infected red blood cells to host endothelial receptors [2]. Cytoadhesion is mediated by a polymorphic family of surface proteins called P. falciparum erythrocyte membrane protein 1 (PfEMP1) [3–5], encoded by the multicopy var gene family, which consists of approximately 60 different var genes [6]. In mutually exclusive expression, only a single member of the var gene family [7–10] is expressed at a time, and switches in var gene transcription provide the basis for antigenic variation [2]. Epigenetic modifications, such as the histone mark H3K9me3 [11–13] of the var gene promoter and the conserved var intron [14–17], are essential to mediate silencing of individual var genes.
The var genes can be grouped according to their chromosomal position and promoter type [18, 19]. Of the 59 var genes in the 3D7 clone of P. falciparum, 36 are located in subtelomeric areas of the 14 P. falciparum chromosomes and 23 in central var clusters. Central var genes possess promoters of the UpsC or UpsB/C type and are transcribed toward the telomere. Subtelomeric var genes belong to the UpsA type, if transcribed toward the telomere and to the UpsB or UpsB/A type, if transcribed toward the centromere [6, 16, 18]. The subtelomeric var gene PF3D7_1200600 (var2csa) [20] and the pseudo var gene PF3D7_0533100 (var1csa) [8, 21] have a unique UpsE and UpsD promoter. In culture-adapted parasites, var gene transcription follows a hierarchy favoring transcription of central UpsC genes [22–24], indicating that chromosomal position is important for the epigenetic control of var gene transcription.
So far, 2 controlled human malaria infection (CHMI) studies have tried to determine the forces that shape var transcript patterns in natural P. falciparum infections. Both investigations proposed that var gene transcription is reset after transmission from mosquito to humans, but the investigators proposed different explanations. Peters et al [25] suggested that transcription is biased toward individual var genes at liver release as a consequence of epigenetic imprint. In contrast, Lavstsen et al and Wang et al [26, 27] propose that almost all var transcripts are detected early after liver release but that transcription changes during intrahost replication owing to more efficient replication of parasite populations expressing specific PfEMP1 variants.
In 2012, the first CHMI trial comparing intravenous and intradermal inoculation of aseptic, purified, cryopreserved sporozoites (PfSPZ) was conducted at the Institute of Tropical Medicine of the University of Tübingen (TÜCHMI-001) [28]. All sporozoites were generated during a single mosquito feed with gametocytes deriving from a single vial of an NF54 cell bank.
Recently, Bachmann et al [29] analyzed var gene transcript levels in ex vivo RNA obtained from the volunteers of the TÜCHMI-001 trial. The authors showed that all parasite populations had a virtually identical var gene transcript pattern, dominated by subtelomeric UpsB and some UpsA var genes. This pattern was dramatically different from the premosquito transcript pattern.
In the current work, we analyzed var gene transcript levels of in vitro culture-adapted parasites from successfully infected volunteers as well as from the original premosquito culture used to produce the PfSPZ. We observed a clear bias toward expression of subtelomeric UpsB genes with a marked difference in var gene transcript levels and switch rates between intradermal and intravenous infections. After prolonged in vitro growth, the transcript profiles of the cultures returned to the premosquito transcript profile.
MATERIAL AND METHODS
Ethics Statement
Ethical approval for the TÜCHMI-001 study was obtained from the ethics committee of the University Clinic of the University of Tübingen. Written informed consent was obtained from the study participants. The study methods were carried out in accordance with the Declaration of Helsinki in the sixth revision as well as International Conference on Harmonization–Good Clinical Practice guidelines.
Study Participants and Sample Collection
All samples were obtained from individuals participating in the CHMI trial at the Institute of Tropical Medicine in Tübingen (TÜCHMI-001; ClinicalTrials.gov identifier NCT01624961 [28]). The study population consisted off 30 healthy individuals aged 18–45 years without any history of malaria. Participants received either an intradermal inoculation of 2500 PfSPZ (n = 6) (identified as 2500.1–6 ID), or an intravenous inoculation of 50 (n = 3), 200 (n = 3), 800 (n = 9) or 3200 (n = 9) PfSPZ (identified as 50.1–3, 200.1–3, 800.1–9, and 3200.1–9 IV). Twenty-two individuals became parasitemic. Four of 6 intradermally inoculated individuals developed asexual blood stage parasitemia (2500.1–4 ID). The number of positive cultures in the different intravenous inoculations were as follows: 50 PfSPZ, 1 of 3 (50.1 IV); 200 PfSPZ, 1 of 3 (200.1 IV); 800 PfSPZ, 7 of 9 (800.1–7 IV); and 3200 PfSPZ, 9 of 9 (3200.1–9 IV). All volunteers were treated with artemether/lumefantrine on the first day of microscopically detectable parasitemia (day of positivity) or 21 days after inoculation [28]. RNA extraction on the day of positivity was performed as described in the Supplemental Methods.
Parasite Cultures
On the day of positivity, 0.25 mL of patient blood was used to establish 10-mL in vitro cultures. Twenty-two cultures were inoculated, but only 21 were passed on to the culture laboratory. At a parasitemia of 3%–4%, 4 mL was expanded to a 20-mL culture and maintained in continuous in vitro culture for a period of 8 weeks. In addition, 2 cryopreserved vials of the original NF54 strain WCB SAN02-073009 used to generate the PfSPZ were provided by Sanaria Inc. Both vials were thawed and taken into in vitro culture under the same conditions described above. Parasites were cultivated as reported elsewhere [30].
Sorbitol Synchronization, RNA Extraction and Complementary DNA Synthesis
RNA was harvested from a 20-mL parasite culture with a parasitemia of 3%–5%, and every 2–3 generations thereafter. Parasite synchronization, RNA extraction, and complementary DNA synthesis were conducted as described elsewhere [30].
var Gene Transcriptional Profiling by Quantitative Reverse-Transcription Polymerase Chain Reaction
The earliest var gene transcription analysis (time point 1 [t1]) reflects the time point when the first 20-mL culture reached a parasitemia of 3%–5%. Time point 2 (t2) reflects the var gene transcriptional profile at the end of the in vitro cultivation period. For 5 cultures, var gene transcription was characterized at 2 additional time points. Transcription analysis of the 2 NF54 WCB SAN02-073009 cultures was performed after 21 generations of in vitro growth (time point 3 [t3]).
For transcriptional profiling of all 59 var genes in the 3D7 genome, we used the primer set of Salanti et al [20], with modifications described elsewhere [30]. All reactions included the same 5 housekeeping genes and were performed under conditions described elsewhere [30]. All runs were done in triplicates, and var gene transcription was measured as the relative copy number of the housekeeping gene arginyl-tRNA synthetase (PF3D7_1218600), using the delta cycle threshold method, as described elsewhere [20].
Electron Microscopy and Flow Cytometry
Electron microscopy and flow cytometry with semi-immune serum were performed as described in Supplemental methods.
Data Analysis and Statistics
Data were analyzed using Microsoft Excel (version 2007) and R (version 3.2.0) software [31]. Individual var gene transcript copy numbers were averaged over triplicates of reverse-transcription polymerase chain reaction runs and scaled to the highest mean var gene transcriptional signal in the entire population (PF3D7_0223500 of 2500.3 ID). For both data sets and time points, we conducted hierarchical cluster analysis in R [32, 33] to analyze the transcriptional profiles of the var gene family in different cultures. Overlay peak plots were created for each cluster. To determine the total var gene transcription signal, the area under the curve (AUC) was calculated. The AUC was calculated using natural spline interpolation (R package MESS; [34]) and compared between clusters or time points. Transcription profiles of premosquito (t3) NF54 WCB SAN02-073009 cultures where compared with those of timepoints t1 and t2, visually using mean overlay plots, and statistically using 1-sample Wilcoxon rank sum tests.
RESULTS
Successful In Vitro Adaptation of Parasites From all Study Participants
After 21 inoculated cultures were successfully adapted to in vitro culture, var gene transcriptional profiling was performed on 18 of the 21 in vitro cultures at the earliest possible time point (t1) and at the end (t2) of in vitro culture. Patient characteristics, infectious dose, route of infection, and prepatent period are shown in Table 1. The experimental setup is shown in Figure 1. At t1, the mean growth time was 16 generations after infection. Seventeen of 18 cultures were analyzed after 13–19 generations (mean, 16 generations). Culture 3200.9 IV was delayed to 29 generations after infection, owing to technical difficulties. At t2, the mean growth time was 41 generations after infection. Seventeen of 18 cultures were analyzed after 36–45 generations (mean, 42 generations). For 1 culture, t2 was at 33 generations after infection, because the culture stopped growing (50.1 IV). For detailed parasitological data see Supplementary Table 1. Transcript level analysis of 2 NF54 WCB SAN02-073009 cultures was performed after 21 generations (t3).
Patient Characteristics, Infectious Dose, Route of Infection, and Prepatent Period
| Patient Identifier | Patient Age, y | Patient Sex | Dose, PfSPZ/Route | Prepatent Period, da |
|---|---|---|---|---|
| 2500.1 | 22 | Female | 2500/Intradermal | 15 |
| 2500.2 | 21 | Male | 2500/Intradermal | 14 |
| 2500.3 | 42 | Male | 2500/Intradermal | 13 |
| 50.1 | 27 | Male | 50/Intravenous | 13 |
| 200.1 | 27 | Male | 200/Intravenous | 14 |
| 800.1 | 29 | Male | 800/Intravenous | 11 |
| 800.2 | 28 | Male | 800/Intravenous | 11 |
| 800.3 | 22 | Male | 800/Intravenous | 12 |
| 800.4 | 24 | Female | 800/Intravenous | 12 |
| 800.5 | 25 | Male | 800/Intravenous | 12 |
| 3200.2 | 27 | Male | 3200/Intravenous | 11 |
| 3200.3 | 26 | Male | 3200/Intravenous | 11 |
| 3200.4 | 30 | Female | 3200/Intravenous | 11 |
| 3200.5 | 28 | Male | 3200/Intravenous | 11 |
| 3200.6 | 28 | Male | 3200/Intravenous | 11 |
| 3200.7 | 24 | Male | 3200/Intravenous | 10 |
| 3200.8 | 25 | Male | 3200/Intravenous | 11 |
| 3200.9 | 27 | Female | 3200/Intravenous | 12 |
Abbreviation: PfSPZ, Plasmodium falciparum sporozoites.
a The prepatent period is the time from infection to the first positive thick blood smear (in days).
![Transcription analysis of NF54 parasites with or without passage through mosquito and human host. The upper part of the figure depicts the generation of sporozoites, controlled human infection by the intradermal or intravenous route, and subsequent in vitro culture. Transcription analysis was performed at time points 1 (t1; mean, 16 generations after infection) and 2 (t2; mean, 41 generations after infection). Gametocytogenesis was induced after 3 mitotic divisions. The lower part of the figure shows an aliquot of the original NF54 culture, maintained in continuous in vitro culture. This was done with 2 independent vials of the same NF54 WCB SAN02-073009 frozen stock. Transcriptional analysis was performed after 21 mitotic divisions (time point 3 [t3]). Abbreviation: PfSPZ, Plasmodium falciparum sporozoites.](https://oup.silverchair-cdn.com/oup/backfile/Content_public/Journal/jid/214/6/10.1093_infdis_jiw225/3/m_jiw22501.jpeg?Expires=1750079258&Signature=Kx8yuVN1u-Tqkh2aHZm3Q5FiYDh4Rky1HHD9Yaqe9~V2rpffgwuLEc20cQTZPdxxfUDAkeLLaKSBCKz3YN0pI8E7NthlKS0f1b5e267qYwRVEPwofAmRzj3ulibsuy83HThsVu9gcqA5uuID4fjD9N4mGfnJZpohj10RyNX-wRj3upUqdGreP2Ci5SFZn01fe6r1a0R1A5Z0c88AYcRkJ3v~eFrOklvI5RhS4KJe2c69MZmtfzVmjSWLPIMIf-7wmppSClM2zack5GOszDCyQbvt9UP~CLyajnHc6iZGMlElrPCjXufkTkkzAuxOk6mfTZfM-7FsSn6X-eXs2WlIKg__&Key-Pair-Id=APKAIE5G5CRDK6RD3PGA)
Transcription analysis of NF54 parasites with or without passage through mosquito and human host. The upper part of the figure depicts the generation of sporozoites, controlled human infection by the intradermal or intravenous route, and subsequent in vitro culture. Transcription analysis was performed at time points 1 (t1; mean, 16 generations after infection) and 2 (t2; mean, 41 generations after infection). Gametocytogenesis was induced after 3 mitotic divisions. The lower part of the figure shows an aliquot of the original NF54 culture, maintained in continuous in vitro culture. This was done with 2 independent vials of the same NF54 WCB SAN02-073009 frozen stock. Transcriptional analysis was performed after 21 mitotic divisions (time point 3 [t3]). Abbreviation: PfSPZ, Plasmodium falciparum sporozoites.
Analysis of Postpatient In Vitro var Gene Transcription
At t1, cultures from individuals infected with 2500 PfSPZ given intradermally or 50 PfSPZ given intravenously transcribed only a few subtelomeric var genes at high relative copy numbers (mean maximum signal, 4.33 relative copy numbers). In contrast, cultures obtained from individuals infected with 200 or 3200 PfSPZ intravenously (Figure 2) transcribed subtelomeric and central var loci at low signals (mean maximum signal, 0.61 relative copy number). However, a subset of subtelomeric var genes was transcribed most actively across all cultures (ie, PFD3D7_ 0223500 and PF3D7_1100100).
![Transcription analysis of NF 54 parasites at time point 1 (t1) after intradermal or intravenous infection. Representative individual transcription profiles of NF54 parasites obtained from individuals infected intradermally (2500 Plasmodium falciparum sporozoites [PfSPZ]) (A) or intravenously (50, 800, or 3200 PfSPZ) (B–D). Patient identifiers (eg, 2500.1 ID) refer to dosage and route of administration (ID, intradermal; IV, intravenous); see Table 1 for details. The transcription signal is quantified in relative copy numbers (y-axis), and var genes are arranged according to chromosomal position (centrally located [central] or in subtelomeric region) and promoter type (UPSA, B, C, B/A, B/C, E, and D) and annotated according to the reannotation at www.GeneDB.org. (For previous annotation see Supplementary Table 2).](https://oup.silverchair-cdn.com/oup/backfile/Content_public/Journal/jid/214/6/10.1093_infdis_jiw225/3/m_jiw22502.jpeg?Expires=1750079258&Signature=0ff5EWPaPQ-DprmJ2GzTPf4qz~BIoFwUP764gVCV8hGOtNyq7tdB8Favq~hCqj75I4MqgrNDI-U93eVBqEFDWu~4a99oUc62dPsQZA71A5M0p~clmtP77WvpuWDeR2ISeIlvDFiHjpql2WouKIMrz4pKBEge1Aq4Rbxlaqm3F1ljL4dxL-dT2pqTYAxNwhAFYH17ZRoki~LYRH~a6Gm5WByO8-yW2N5qbppJIYWKppveiptFv2Uf3lg7Z-YBQDNac7DPPKMVdGtZXLsPrt-CruLbWAsCVc4MFx00iAH~48vv1B383sMy3AfA~HX-ZPPwhfOtjvS1DGELB8EzWIQMJQ__&Key-Pair-Id=APKAIE5G5CRDK6RD3PGA)
Transcription analysis of NF 54 parasites at time point 1 (t1) after intradermal or intravenous infection. Representative individual transcription profiles of NF54 parasites obtained from individuals infected intradermally (2500 Plasmodium falciparum sporozoites [PfSPZ]) (A) or intravenously (50, 800, or 3200 PfSPZ) (B–D). Patient identifiers (eg, 2500.1 ID) refer to dosage and route of administration (ID, intradermal; IV, intravenous); see Table 1 for details. The transcription signal is quantified in relative copy numbers (y-axis), and var genes are arranged according to chromosomal position (centrally located [central] or in subtelomeric region) and promoter type (UPSA, B, C, B/A, B/C, E, and D) and annotated according to the reannotation at www.GeneDB.org. (For previous annotation see Supplementary Table 2).
To assess var gene transcript levels in the entire population, a t1 heat map was generated. Hierarchical cluster analysis (Figure 3) revealed 8 subtelomeric var genes being transcribed most actively in all cultures (PF3D7_0223500, PF3D7_0400100, PF3D7_0733000 PF3D7_0632500, PF3D7_1100100, PF3D7_0800100, PF3D7_1255200, and PF3D7_1373500). Two distinct clusters were identified. Cultures from cluster 1 (2500.1–3 ID, 50.1 IV, and 3200.4 IV) displayed high individual var transcript levels (20%–80% of the maximum relative copy number) of the set of 8 subtelomeric var loci. Cultures from cluster 2 (200.1 IV, 800.1–5 IV, 3200.2 IV, 3200.3 IV, and 3200.5–9 IV) displayed overall lower transcript levels of these genes (between 10%–20% of the maximum relative copy number). Moreover, a subset of central var genes was transcribed with equal strength in cluster 2. Furthermore, the total var gene transcript level was higher in cluster 1 than in cluster 2 (median AUC, 209.42 and 81.45, respectively). Cluster 2, which consisted exclusively of cultures from individuals infected intravenously with doses ≥200 PfSPZ, thus seemed to be associated with a lower total var gene transcript level and a more diverse var gene transcript profile.
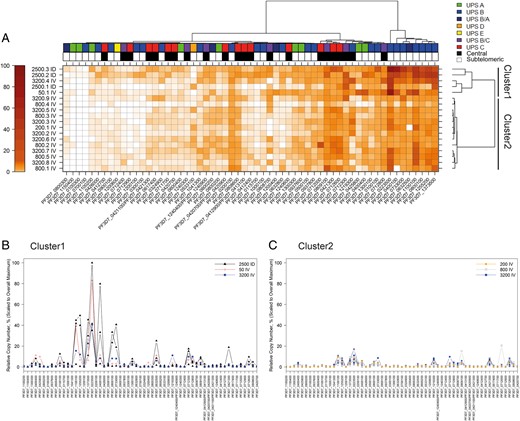
Transcription analysis of all cultures at time period 1 (t1). A, var Gene transcription heat map. The transcription signal is expressed as the percentage of the highest individual var gene transcriptional signal in the entire population (PF3D7_0223500 of 2500.3 ID) and reflected in the color of the boxes of the heat map (bar at far left). Patient identifiers with corresponding infection route and dose are displayed to the left of the heat map; individual var loci are listed at the bottom. Patient identifiers (eg, 2500.3 ID) refer to dosage and route of administration (ID, intradermal; IV, intravenous); see Table 1 for details. Promoter type and chromosomal position are indicated by the boxes above the heat map. Promoter types of var genes are marked with colored boxes. Subtelomeric var genes are marked as white and central var genes as black boxes. Note that a cluster of 8 subtelomeric var genes exhibits the highest transcription levels in all cultures. The 2 clusters of cultures from the different study participants are depicted on the right. Cluster 1: 2500.1–3 ID, 50.1 IV, and 3200.4 IV. Cluster 2: 200.1 IV, 800.1–5 IV, 3200.2 IV, 3200.3 IV, and 3200.5–9 IV. B, C, Overlay peak plots of clusters 1 and 2. Cultures from patients with the same dose and route of infection were collapsed to a single peak plot. The relative copy number as a percentage (of PF3D7_0223500 of 2500.3 ID) is indicated on the y-axis, and the individual var gene loci on the x-axis. The order of var genes is the same as in Figure 2.
To determine whether the different transcript patterns persisted over time, a second heat map for all cultures was generated at t2 (Figure 4). Hierarchical cluster analysis of the individual var loci now identified 1 large cluster of 17 cultures with a low total transcript level (median AUC, 62.16). However, the culture obtained from the individual infected with 50 PfSPZ intravenously (50.1 IV) continued to transcribe the same subtelomeric var genes at high levels and thus formed its own cluster (Supplementary Figure 1) (AUC, 194.13).
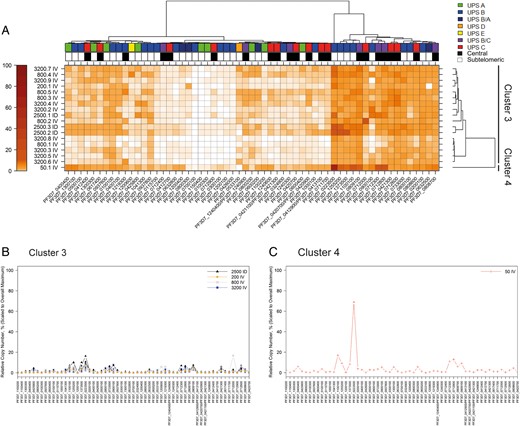
Transcription analysis of all cultures at t2. A, var Gene transcription heat map, following the same scheme as in Figure 3. Note that the cluster of var genes with the highest transcriptional levels is now composed of 10 subtelomeric and 7 central var genes. B, C, Overlay peak plot of cultures comprising cluster 3 and 4 following the same scheme as in Figure 3; var transcription levels have decreased across all cultures, except the 50.1 IV culture. Patient identifiers (eg, 3200.7 ID) refer to dosage and route of administration (ID, intradermal; IV, intravenous); see Table 1 for details.
At t2, var gene transcription favored 17 var genes in the entire population (Figure 4). This cluster contained 7 of 8 subtelomeric var loci with the highest transcript levels identified at t1. Interestingly, 8 highly transcribed central var genes were the same genes transcribed in the cultures forming cluster 2 at t1 (PF3D7_0712300, PF3D7_0712000, PF3D7_0712800, PF3D7_0712600, PF3D7_0808700, PF3D7_0809100, PF3D7_0421300, and PFD3D7_0808600). Cluster analysis according to var gene promoter type showed that this corresponded to a shift from preferred transcription of UpsB promoters at t1 to a more diversified transcription profile of UpsB and UpsC promoters at t2.
var Gene Transcription and Sporozoite Route of Infection
All cultures in cluster 2 were from individuals infected intravenously with doses ≥200 PfSPZ. Cluster 1 was composed of all cultures from intradermally infected individuals (2500.1–3 ID) as well as cultures from the lowest-dose and highest-dose intravenous infections (50 .1IV and 3200.4 IV). To assess whether the duration of intrahost replication differed between the 2 clusters, prepatent periods were analyzed. The mean prepatent period of the individuals in cluster 1 (13.2 days) was significantly longer (P = 0.03) than the mean prepatent period of individuals in cluster 2 (11.4 days). (Figure 5A). Importantly, the prepatent period in individuals infected with 2500 PfSPZ intrademally (13–15 days) was the same or longer than in those infected with 50 PfSPZ or 200 PfSPZ intravenously (13–14 days), whereas the prepatent period of those infected with 800 or 3200 PfSPZ intravenously was significantly shorter (11.2 days) (P = .03). However, the cluster 1 culture 3200.4 IV had a short prepatent period.
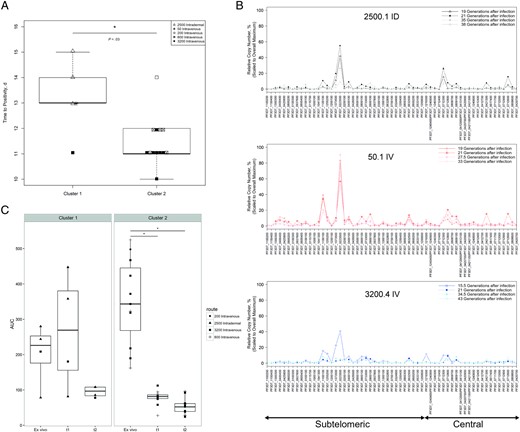
var Gene transcription profiles are influenced by route of infection and duration of intrahost replication. A, Prepatent periods of clusters 1 and 2; y-axis denotes the time from infection to blood smear positivity (prepatent period). B, Representative overlay peak plots of individual parasite populations (top, 2500.1 ID; middle, 50.1 IV; bottom, 3200.4 IV) at different times of in vitro culture. Relative copy number as a percentage (scaled to PF3D7_0223500 of 2500.3 ID) is indicated on the y-axis, individual var gene loci on the x-axis. Note that the transcriptional signal level for 3200.4 IV decreases faster than in the 2500.1 ID and 50.1 IV cultures. Patient identifiers (eg, 2500.1 ID) refer to dosage and route of administration (ID, intradermal; IV, intravenous); see Table 1 for details. C, Comparison of total var gene signal (AUC) of cluster 1 and 2 between the day of blood smear positivity (ex vivo) and in vitro (t1 and t2). Note that cluster 2 exhibits a statistically significant decrease of total the var gene signal (AUC) between ex vivo and in vitro (t1 and t2) (indicated by the asterisks). Cluster 1 shows no statistically significant decrease in total var signal (AUC) between ex vivo and in vitro. The same housekeeping gene (arginyl-tRNA synthetase; PF3D7_1218600) was used to analyze ex vivo and in vitro t1 and t2 real-time polymerase chain reaction. In clusters 1 and 2, 50.1 IV and 800.5 IV are removed because no RNA was available for this analysis at the ex vivo time point. Abbreviation: AUC, area under the curve.
To characterize the switch rates of cluster 1 cultures, transcription profiles at 4 time points were analyzed for the respective cultures: 50.1 IV at 19, 21, 28, and 33 generations after infection; 2500.1 ID at 19, 21, 35, and 38 generations; 2500.2 ID at 15, 21, 34, and 42 generations; 2500.3 ID at 15, 22, 34, and 42 generations; and 3200.4 IV at 16, 21, 35, and 43 generations (Figure 5B). This analysis revealed that parasites of the individual infected with 50 PfSPZ (50.1 IV) displayed consistently high transcript levels at all time points and that cultures from intradermally infected individuals showed gradually decreasing transcript levels over time. By contrast, transcript levels of the individual infected with 3200 PfSPZ intravenously (3200.4 IV) rapidly decreased to background levels, suggesting a high switch rate.
To investigate whether cluster 2 cultures exhibited a faster switch rate than cluster 1 cultures, var gene transcription levels in ex vivo RNA obtained from the volunteers on the day of blood smear positivity was compared with var gene transcript levels at t1 and t2 [29]. Strikingly, the total ex vivo var transcript level was higher in cluster 2 than in cluster 1. However, between ex vivo and t1, the total transcript level decreased significantly (P < .001) in cluster 2 but did not decrease in cluster 1 (Figure 5C). Together, these data show that parasites from individuals infected intravenously with doses ≥200 PfSPZ exhibit a faster switching rate than parasites from intradermally infected individuals.
Comparison of Premosquito and Postpatient var Gene Transcript Patterns
To assess the influence of meiosis and host passage on var gene transcription, we compared the transcript pattern of the premosquito strain at t3 (after 21 mitotic divisions) with the mean transcription signal of all patient profiles at t1 (after 19 mitotic divisions plus 1 meiotic division plus host passage) and t2 (after 44 mitotic divisions plus 1 meiotic division plus host passage) (Figure 6A). Despite an almost identical number of mitotic divisions at t3 and t1, the most pronounced difference in var gene transcript patterns was found between these 2 time points. Interestingly, the transcript pattern at t3 and t2 showed that the same subtelomeric and central var loci were preferentially transcribed. The exception was var2csa, which was highly transcribed at t3 but not at t1 and t2. To quantify the change in transcript levels of all var genes, a fold change analysis was performed based on t3. Prolonged in vitro culture resulted in a var gene transcript pattern that was almost identical to the premosquito pattern (Figure 6B).
![Transcription analysis of premosquito (time period 3 [t3]) and postpatient (time periods 1 and 2 [t1, t2) NF54 parasites. A, Transcription overlay plots of the same NF54 culture after exclusive mitotic replication for 21 generations compared with 19 and 40 mitotic replications plus 1 meiotic division and host passage. The transcription signal of the original NF54 parasites after t3 (21 mitotic divisions) is represented by triangles. The height of the transcription signal is indicated on the y-axis, and the individual var gene loci on the x-axis. B, var Gene transcription fold changes after mosquito and host passage. Log2 ratios for t1 (dark gray) and t2 (light gray) compared with t3 were calculated using the delta delta cycle threshold method [35]; individual var loci are depicted on the left. Genes that are transcribed with stronger signals at t3 (premosquito culture) will have a value <1; var2csa and the majority of central var genes belong to this group. Subtelomeric var loci at t1 represent the majority of var genes transcribed at higher levels after passage through mosquito and human host (value, >1).](https://oup.silverchair-cdn.com/oup/backfile/Content_public/Journal/jid/214/6/10.1093_infdis_jiw225/3/m_jiw22506.jpeg?Expires=1750079258&Signature=L8fJvJrPN~JL8U5DqnUoMu7xFZ1WCgVdAzWxWHO0qCwT5pVgPw-Y3j1ao3X3GSIhkUW1y6odauBp69c1ynjjKq79lsSmGgaBNSFdsTNEF7NHt7OjR9WfNAJBorKnjTHFN8zKhugnBi2LIajgRbYaK9DFYpG73vPIx6adzcHuLYzAPBviD1KQssDsh7IIOEOJxIl5z6JQmA1DqDnscRni-ehmgL~O8qxYhKU~A7ATOUJ6MZ-ZNWSlxAgfrE-2eQA54a~KEoL0KqKlurLC8VOKuTLjiKXCjcrVKX3R-BdJ-1dFYNFMfjt5oFXxQQePc2SgzY4pwTfZ22iPziS60-aXlg__&Key-Pair-Id=APKAIE5G5CRDK6RD3PGA)
Transcription analysis of premosquito (time period 3 [t3]) and postpatient (time periods 1 and 2 [t1, t2) NF54 parasites. A, Transcription overlay plots of the same NF54 culture after exclusive mitotic replication for 21 generations compared with 19 and 40 mitotic replications plus 1 meiotic division and host passage. The transcription signal of the original NF54 parasites after t3 (21 mitotic divisions) is represented by triangles. The height of the transcription signal is indicated on the y-axis, and the individual var gene loci on the x-axis. B, var Gene transcription fold changes after mosquito and host passage. Log2 ratios for t1 (dark gray) and t2 (light gray) compared with t3 were calculated using the delta delta cycle threshold method [35]; individual var loci are depicted on the left. Genes that are transcribed with stronger signals at t3 (premosquito culture) will have a value <1; var2csa and the majority of central var genes belong to this group. Subtelomeric var loci at t1 represent the majority of var genes transcribed at higher levels after passage through mosquito and human host (value, >1).
Analysis of PfEMP1 Expression by Electron Microscopy and Flow Cytometry
In the premosquito strain WCB SAN02-073009, scanning and transmission electron microscopy showed the presence of knobs on the surface of infected red blood cells, supporting intact PfEMP1 presentation (Supplementary Figure 2A and 2B). In the postpatient cultures, PfEMP1 presentation was assessed by means of fluorescence-activated cell sorting (FACS) with semi-immune serum of a Gabonese individual [36]. All investigated cultures displayed surface reactivity, supporting PfEMP1 expression (Supplementary Figure 2C). Interestingly, the FACS signal was higher in cluster 1 than in cluster 2.
DISCUSSION
Several investigations have shown that in vitro antigenic variation in P. falciparum exhibits a conserved transcription pattern in different laboratory strains and newly adapted field isolates [22–24, 30]. This raises the question how such a conserved profile can result in successful antigenic variation. Here, we show for the first time that the route of infection influences var gene transcript levels and switch rates of in vitro culture-adapted P. falciparum strains.
Ex vivo transcript level analysis of TÜCHMI-001 patients on the day of blood smear positivity [29] showed that the same UpsB and UpsA var genes were transcribed at high levels in the majority of patients. This is consistent with a model proposed by Lavstsen et al [26], suggesting that parasites transcribe a broad variety of var genes after liver release and that subsequent transcriptional changes are due to more efficient replication of parasite populations transcribing specific PfEMP1 variants. We observed a strong decrease in transcript levels between ex vivo and in vitro, indicating that the removal of host receptor selection had an immediate effect on var gene transcription. This decrease was most pronounced among subtelomeric UpsA and UpsB genes.
Previous investigations have shown that subtelomeric UpsB genes have high in vitro off-rates [22], and recently UpsA var genes have been shown to possess an additional silencing mechanism consisting of exonuclease-mediated RNA degradation [35], providing a potential explanation for the rapid decrease of transcript levels observed in this group of var genes. Prolonged in vitro culture was associated with a further decrease in transcript levels of subtelomeric UpsB genes, in contrast to the constant transcript levels of central UpsC genes. This is consistent with multiple previous reports showing higher off rates of subtelomeric UpsB genes compared with central UpsC genes [22–24].
Interestingly, the transcriptional signal of individual subtelomeric UpsB genes (ie, PF3D7_0223500) decreased faster in cultures from intravenous infections than in cultures from intradermal infections, and this was correlated with a shorter intrahost replication time in intravenous infections. In a detailed previous investigation of CHMI with mosquito-delivered sporozoites, Cheng et al [37] showed that not all intradermally inoculated sporozoites reach the liver. Consequently, despite a high dose of 2500 sporozoites in the intradermal infections, only a small proportion may have reached the liver, resulting in a lower starting parasitema, leading to a longer prepatent period. The fact that the culture from the lowest-dose intravenous infection (50 PfSPZ) also displayed a longer prepatent period than higher-dose intravenous infections (800 and 3200 PfSPZ) is consistent with this finding and with previous data from Cheng et al [37], showing that a 10-fold reduction in starting parasitemia prolongs intravascular growth by 2 days.
We hypothesize that the longer intravascular replication in intradermal infections resulted in increasing selection for parasites transcribing the most advantageous var genes for intravascular replication. After in vitro culture adaptation, this stronger epigenetic mark may have resulted in slower decay of transcript levels in cultures from intradermal infections.
Previous data generated with isogenic transgenic parasites have shown that increasing drug selection with the drug blasticidin generates parasite populations with higher transcript levels and lower switch rates than parasites selected with a lower blasticidin concentration [30], thus supporting the observation that selective pressures influence var gene transcription. The observation that prolonged postpatient in vitro growth resulted in a conserved transcriptional profile is equally consistent with the conserved transcriptional profile observed in isogenic transgenic parasites propagated without drug pressure [30]. Together, these observations support a conserved epigenetically determined transcription profile after prolonged in vitro culture.
Consistent with this, late postpatient cultures transcribed the same subtelomeric and central var genes as the premosquito culture used to generate PfSPZ. The only exception was var2csa, a locus responsible for binding infected red blood cells in the placenta [20]. var2csa was highly transcribed in the premosquito culture, consistent with reports that this gene occupies a unique position in the var gene switching network [38, 39]. We hypothesize that the absence of the placental receptor chondroitin sulfate A in our patient population resulted in a selective disadvantage for this locus.
FACS analysis with serum of a semi-immune individual showed a stronger recognition of cluster 1 than of cluster 2 parasites. Chan et al [40] have shown that the high surface reactivity of semi-immune serum with the 3D7 laboratory strain is due to CD-36 binding PfEMP1 variants. This finding would be consistent with the longer prepatent period of cluster 1 parasites, leading to more stable expression of CD36 binding PfEMP1 variants due to longer receptor selection.
One limitation of our investigation is that var gene transcriptional changes may have occurred as a consequence of in vitro culture adaptation. However, because the in vitro culture conditions were constant across all cultures, it seems unlikely that in vitro culture adaptation per se could be responsible for the observed differences in var gene transcription. Despite the observed changes in var gene transcription during in vitro growth of cultures from intravenous and intradermal infections, transcription of var genes was nevertheless highly conserved; that is, the same var genes were transcribed in almost all cultures.
A model by Recker et al [41] suggests that host pressure is critical for generating antigenic variation by mounting cross-reactive immune responses against a major and minor antigen. Although our study did not assess the importance of the immune response, the observation that differences in intrahost replication time influence var gene transcription is consistent with a model of antigenic variation based on host selective pressures. It remains an open question whether the major and minor antigenic determinants proposed by Recker et al [41] consist of different PfEMP1 epitopes or possibly also encompass other multicopy gene families of P. falciparum [42–44]. Future investigations with CHMI and with natural chronic infections in semi-immune individuals will be necessary to definitively answer these questions.
Notes
Acknowledgments. We thank all individuals who participated in the TÜCHMI-001 study as well as the whole TÜCHMI-001 team. We thank Dr Thomas Engleitner for his contribution to the statistical analysis.
Financial support. This work was supported by the German Israeli Foundation (S. D. and M. F.), the German ministry for education and research (E. I. B. and M. F.), and the National Institute of Allergy and Infectious Diseases, National Institutes of Health (SBIR award R01GM9987654 to produce PfSPZ).
Potential conflicts of interest. B. K. L. S. is an employee of and S. L. H. the chief executive and scientific officer of Sanaria Inc. All other authors report no potential conflicts. All authors have submitted the ICMJE Form for Disclosure of Potential Conflicts of Interest. Conflicts that the editors consider relevant to the content of the manuscript have been disclosed.
References
Author notes
Presented in part: Biology and Pathology of the Malaria Parasite, 10th Annual BioMalPar I EVIMalaR Conference and EVIMalaR Symposium, Heidelberg, Germany, 12–15 May 2014; 12th Malaria Meeting 2014, Bonn, Germany, 14–15 November 2014; Annual DTG Meeting, Düsseldorf, Germany, 14–15 March 2014.
S. D. and E. I. B. contributed equally to this work.

