


Abstract
Background. The human immunodeficiency virus type 1 (HIV-1) pandemic was ignited in Léopoldville (now known as Kinshasa), in the former Belgian Congo. Factors that jump-started its early expansion remain unclear. Nonlethal hepatitis C virus (HCV) and human T-cell lymphotropic virus (HTLV-1) can be used to investigate past iatrogenic transmission.
Methods. We undertook a cross-sectional study of elderly inhabitants of Kinshasa, with serological assays, amplification, and sequencing. Risk factors were assessed through logistic regression. Phylogenetic methods reconstructed the genetic history of HCV.
Results. A total of 217 of 839 participants (25.9%) were HCV seropositive; 26 (3.1%) were HTLV-1-seropositive. Amplification products were obtained from 118 HCV-seropositive participants; subtypes 4k (in 47 participants) and 4r (in 38) were most common. Independent risk factors for HCV subtype 4r seropositivity were intramuscular tuberculosis therapy, intravenous injections at hospital A, intravenous injections before 1960, and injections at a colonial-era venereology clinic. Intravenous injections at hospital B and antimalarials were associated with HCV subtype 4k seropositivity. Risk factors for HTLV-1 seropositivity included intravenous injections at hospitals C or D and transfusions. Evolutionary analysis of viral sequences revealed independent exponential amplification of HCV subtypes 4r and 4k from the 1950s onward.
Conclusions. Iatrogenic transmission of HCV and HTLV-1 occurred in mid-20th century Kinshasa, at the same time and place HIV-1 emerged. Iatrogenic routes may have contributed to the early establishment of the pandemic.
The human immunodeficiency virus (HIV)/AIDS pandemic has affected approximately 75 million people, half of whom have died [1]. The source of the pandemic strain, HIV-1 group M, is the Pan troglodytes troglodytes chimpanzee, which inhabits central African forests west and north of the Congo river [2, 3]. Cross-species transmission is thought to have occurred through the manipulation of chimpanzee meat by hunters or cooks. The common ancestor of all group M infections existed during the first 2 decades of the 20th century [4, 5].
After cross-species transmission, probably in southeastern Cameroon, the virus appears to have travelled south, reaching Léopoldville (now Kinshasa, Democratic Republic of the Congo; DRC) by 1920 [4–6]. Evolutionary analyses of viral gene sequences show that HIV-1 flourished and diversified in the capital of the former Belgian Congo, which was the major trading center of Central Africa [4, 5]. The virus spread to Brazzaville, across the river, and to other cities of the Belgian Congo from the mid-1930s and, later, to the rest of the world [5]. This explains why the 2 oldest HIV-1 isolates, recovered from a 1959 blood sample and a 1960 biopsy specimen, were both procured in Kinshasa [4, 7] and why Kinshasa and Brazzaville harbor a very broad genetic diversity of HIV-1 [8, 9], as too does rural Cameroon [6], where the ancestors of HIV-1 in apes are located.
Genetic estimates of the transmission history of HIV-1 group M in central Africa indicate that the epidemic grew more slowly before 1950 and then transitioned to much faster exponential growth sometime between 1952 and 1968 [4, 5]. Factors that drove the emergence and spread of HIV-1 toward epidemic spread in Kinshasa remain unknown. It has been hypothesized that iatrogenic transmission routes contributed substantially to the early dissemination of HIV-1 [10, 11]. Although risk factors for HIV-1 transmission decades ago cannot be studied directly because of its high mortality, 2 blood-borne viruses compatible with survival can serve as proxies: hepatitis C virus (HCV) and human T-cell lymphotropic virus type 1 (HTLV-1). HCV provides a valuable marker for iatrogenic transmission as sexual and vertical routes are comparatively less effective. To assess the contribution of iatrogenic transmission to the spread of blood-borne viruses in Kinshasa, we conducted a cross-sectional study of HCV and HTLV-1 infections among the city's elderly population.
METHODS
Study Population and Data Collection
The protocol was approved by the ethics committees of École de Santé Publique de Kinshasa and Centre Hospitalier Universitaire de Sherbrooke. The study was registered at ClinicalTrials.gov, (NCT02439918). The unlinked anonymous method was used. In July‒August 2012, we recruited a convenience sample of individuals aged ≥70 years who had lived in Kinshasa for ≥30 years, understood Lingala, and were not demented or aphasic. Potential participants were identified through Catholic parishes. Facilitators visited neighborhoods to explain to candidates the purpose of the study and to seek their collaboration. Those who gave a written consent in Lingala came to the parish, where nurses administered a questionnaire and collected samples under medical supervision.
The questionnaire collected demographic data and past medical history, focusing on tropical diseases and intravenous injections during the participant's lifetime. Regions of birth were categorized according to geographic proximity and/or common ethnicity. For each episode of intravenous treatment, we sought information concerning the indication, the approximate year, and the healthcare facility. Timing was estimated by reference to well-known historical events (Congo's independence, in 1960; the nationalization of all foreign-owned enterprises, in 1973; and the Sovereign National Conference, in 1990–1992), which were then used to define periods for analyses. We did not attempt to document all injections received intramuscularly or subcutaneously, as participants would have received too many such injections. Instead, information was collected concerning conditions that required an outstanding number of injections (diabetes, streptomycin-treated tuberculosis, and injectable contraceptives), transfusions, vaccine scars, scarifications, circumcision, and care received at a colonial-era venereology clinic.
We expected an underlying prevalence of HCV of 15% in individuals unexposed to intravenous injections and a risk ratio of 1.6 between those exposed and those unexposed. The recruitment target was thus set at 650 participants, which corresponded to a power of 80% and a significance level of 5%. As the recruitment phase proceeded faster than anticipated, the target sample size was increased to 800. This improved the power of the study to slightly <90%.
Laboratory Assays
Dried blood spots were made from capillary blood specimens deposited on Whatman 3 filter paper (for serological analysis) and Whatman Protein Saver Cards (for molecular biologic analysis; Sigma-Aldrich). To document our 2 main outcomes (HCV and HTLV-1 infections), serological assays were performed as detailed in Supplementary Methods. For HCV, polymerase chain reaction amplification of the NS5b (485 nucleotides) and core/E1 (1026 nucleotides) genome regions was attempted on reactive samples. For HTLV-1, the gp21 env gene was amplified (885 nucleotides). Amplification and sequencing are outlined in the Supplementary Methods. Sequences have accession numbers KP347272‒431.
Data Analysis
Classical Epidemiology
Crude and adjusted odds ratios (ORs) and their 95% confidence intervals (CIs) were calculated by logistic regression. Models for multivariable analyses were built starting with the variable most strongly associated with the outcome in univariable analyses, adding variables one by one until no other reached significance. When the final model was reached, each variable was dropped in turn, using likelihood ratio tests (significance level, 0.05) to determine whether a given variable enhanced model fit. Wald tests assessed stratum-specific significance for each categorical variable. As the participants had been recruited through specific parishes, parish was included, along with age, in all models to allow for unmeasured confounders. Interaction tests were performed only for variables, which, a priori, could have been related so as to generate effect modification.
HCV sequences were subtyped by computing p-distances to a reference alignment of HCV subtype 4 isolates [12]. A distance threshold of <0.15 was used to assign subtypes. Analyses for specific HCV subtypes considered only participants infected with that subtype and those who were seronegative; those infected with another subtype were considered refractory to the subtype of interest [13].
Evolutionary Epidemiology
In addition to the HCV sequences from this study, all other genotype 4 gene sequences from the DRC that spanned the core or NS5b regions sequenced here were collated from GenBank (Supplementary Table 1). Sequences were aligned by hand, and maximum likelihood phylogenies were estimated using Garli 0.951 [14] from 4 alignments: (1) HCV subtype 4k core sequences, (2) subtype 4k NS5b sequences, (3) subtype 4r core sequences, and (4) subtype 4r NS5b sequences.
Evolutionary rates and epidemic histories were estimated using the Bayesian phylogenetic approach with BEAST [15]. Both HCV subtypes prevalent here (4k and 4r) were analyzed independently. Analyses were repeated, first using sequences from this study only and second using those plus all other HCV DRC sequences from GenBank. Evolutionary rates were estimated from an independent set of HCV genotype 1 genomes sampled from different patients at different times (Supplementary Methods) [16].
To ensure the robustness of results, a variety of coalescent and molecular clock methods for estimating epidemic history were used: both strict and relaxed molecular clock models were tested, and parametric and nonparametric coalescent models were explored [17, 18]. The parametric coalescent approach comprised a 3-phase model of epidemic history representing sequential phases of constant population size, exponential growth, and constant size (hereafter, the “CEC model”) [19].
RESULTS
Classical Epidemiology
A total of 848 participants were enrolled. Nine did not fulfill the inclusion criteria and were excluded despite blood specimens having been collected. Thirty-five other potential participants had been given a study number but were excluded before blood specimen collection, as they were found to be ineligible on the basis of age upon review of their identity papers by one of the study physicians. Among the 839 eligible participants, ages varied between 70 and 97 years (median, 75 years; interquartile range [IQR], 72–79 years). Participants had lived in Kinshasa for 30–92 years (median, 58 years; IQR, 50–70 years). Seventy-four percent of participants recalled receiving intravenous injections at least once in their lifetime.
Twenty-six percent of participants (217 of 839) were HCV seropositive, while 1% (11) had an indeterminate HCV status. Supplementary Table 2 shows the likelihood of HCV infection according to various characteristics. In multivariable analysis (Table 1), the independent risk factors for HCV infection were intramuscular antituberculous injections, a first episode of intravenous treatment prior to 1960, intravenous injections at hospitals A or B, transfusions, and intravenous antimalarials. No evidence of interaction was found. Injections at the colonial-era venereology clinic (adjusted OR, 1.56; 95% CI, .96–2.53; P = .07), injections against schistosomiasis (adjusted OR, 2.79; 95% CI, .93–8.32; P = .07), and a vaccinia scar (adjusted OR, 1.72; 95% CI, .99–3.02; P = .06) were weakly correlated with HCV infection. Among men, having undergone medical circumcision was associated with HCV infection (adjusted OR, 1.98; 95% CI, 1.09–3.57; P = .02).
Independent Risk Factors for Hepatitis C Virus Seropositivity
| Risk Factor | Adjusted ORa (95% CI) | P Value |
|---|---|---|
| Injections against tuberculosis | ||
| Never | 1 | .01 |
| Ever | 3.52 (1.32–9.40) | |
| Intravenous injections at hospital B | ||
| Never | 1 | .05 |
| Ever | 2.69 (1.00–7.22) | |
| First episode of intravenous injections | ||
| Before 1960 | 2.31 (1.35–3.97) | .002 |
| 1960–1973 | 1.50 (.86–2.60) | .15 |
| 1974–1992 | 1.44 (.89–2.33) | .14 |
| After 1992 | 1 | .26 |
| Never | 1.34 (.81–2.21) | |
| Intravenous injections at hospital A | ||
| Never | 1 | .05 |
| Ever | 1.83 (1.00–3.34) | |
| Transfusions | ||
| Never | 1 | .02 |
| Ever | 1.65 (1.10–2.48) | |
| Intravenous antimalarial drugs | ||
| Never | 1 | .04 |
| Ever | 1.50 (1.02–2.20) | |
Abbreviations: CI, confidence interval; OR, odds ratio.
a Adjusted for the other variables in the model, as well as for age and parish of recruitment.
To allow, with sufficient numbers, stratification of exposures according to the approximate year they occurred, periods were further grouped as pre-1960, 1960–1973, and post-1973 (Supplementary Table 3). HCV prevalence was higher for treatments that occurred before 1960 or in the subsequent decade, with the exception of injections at hospital A (inaugurated in 1958).
HCV subtypes were determined for 118 participants: 116 belonged to genotype 4, and 1 each to genotypes 1 and 7. The most-common subtypes were 4k (n = 47), 4r (n = 38), and 4c (n = 11). Supplementary Table 4 displays risk factors for subtypes 4k and 4r. In multivariable modeling, intravenous antimalarials and intravenous injections at hospital B were associated with subtype 4k, while antituberculous injections, intravenous injections at hospital A, injections at the colonial-era venereology clinic, and a first episode of intravenous injections before 1960 were associated with subtype 4r (Table 2).
Independent Risk Factors for Infection With Hepatitis C Virus (HCV) Subtypes 4k and 4r
| HCV Subtype, Risk Factor | Adjusted ORa (95% CI) | P Value |
|---|---|---|
| 4k | ||
| Intravenous injections at hospital B | ||
| Never | 1 | .05 |
| Ever | 3.98 (1.01–15.75) | |
| Intravenous antimalarial drugs | ||
| Never | 1 | .02 |
| Ever | 2.10 (1.13–3.90) | |
| 4r | ||
| Injections against tuberculosis | ||
| Never | 1 | <.001 |
| Ever | 12.80 (3.79–43.21) | |
| Intravenous injections at hospital A | ||
| Never | 1 | .008 |
| Ever | 3.85 (1.43–10.41) | |
| Injections at venereology clinic | ||
| Never | 1 | .03 |
| Ever | 2.60 (1.08–6.25) | |
| First episode of intravenous injections | ||
| Before 1960 | 2.91 (1.03–8.26) | .04 |
| 1960–1973 | 1.42 (.42–4.81) | .57 |
| 1974–1992 | 1.84 (.70–4.80) | .22 |
| After 1992 | 1 | .9 |
| No intravenous injections | 0.94 (.34–2.60) |
Abbreviations: CI, confidence interval; OR, odds ratio.
a Adjusted for the other variables in the model, as well as for age and parish of recruitment.
The prevalence of HTLV-1 infection was only 3.1% (26 of 839 participants). Five participants were excluded (2 were infected with HTLV-2, and 3 were infected with an unknown type or had an indeterminate HTLV status). The prevalence of HTLV-1 infection according to various characteristics is shown in Supplementary Table 5. Table 3 displays the independent risk factors for HTLV-1 infection: female sex, birth in Equateur or Orientale provinces, transfusions, and intravenous injections at hospitals C or D. No evidence of interaction was found.
Independent Risk Factors for Human T-Cell Lymphotropic Virus Type 1 Infection
| Risk Factor | Adjusted ORa (95% CI) | P Value |
|---|---|---|
| Intravenous injections at hospital D | ||
| Never | 1 | .02 |
| Ever | 4.93 (1.37–17.69) | |
| Sex | ||
| Male | 1 | .009 |
| Female | 4.45 (1.46–13.60) | |
| Region of birth | ||
| Bas-Congo/Bandundu/Kinshasa | 1 | .005 |
| Équateur/Orientale | 3.49 (1.46–8.36) | .9 |
| Kasaï | 1.09 (.29–4.19) | … |
| Kivu/Katanga | … | |
| Transfusions | ||
| Never | 1 | .04 |
| Ever | 2.46 (1.04–5.85) | |
| Intravenous injections at hospital C | ||
| Never | 1 | .05 |
| Ever | 2.41 (1.01–5.73) | |
Abbreviations: CI, confidence interval; OR, odds ratio.
a Adjusted for the other variables in the model, as well as for age and parish of recruitment.
HTLV-1 sequences were available for 23 participants: 20 were infected with subtype 1b, and 3 were infected with subtype 1a. Subtype 1b isolates grouped in one of 2 clades, one containing only DRC strains and the other containing isolates from Cameroon and the Central African Republic (Supplementary Figure 1). Small numbers precluded comparisons of risk factors for HTLV-1 infection by subtype.
HCV infection was more common in HTLV-1–infected participants (12 of 26 [46.2%]) than among HTLV-1–uninfected participants (204 of 797 [25.6%]; P = .03). When fitted into the model for the other virus, HTLV-1 was a significant correlate of HCV infection, and HCV was a significant correlate of HTLV-1 infection (data not shown).
Evolutionary Epidemiology
Supplementary Figures 2 and 3 show estimated maximum likelihood phylogenies for the HCV core and NS5b regions, and Supplementary Figure 4 shows the maximum clade credibility molecular clock trees for each data set. Figure 1 shows the reconstructed epidemic histories of HCV subtypes 4r and 4k in our study population (insufficient samples were available for other subtypes). Both subtypes, both genome regions, and all analysis methods produced congruent estimates of epidemic growth trajectory. The common scenario was one of a low, endemic size until the mid-20th century, followed by a period of rapid exponential growth. The growth phase was followed, in most but not all cases, by a second phase of constant size near the present. Owing to the low lineage coalescence rate near the present, it is difficult to discern whether this plateau is due to stabilized prevalence, longer times between infection, lack of statistical power, or some combination of these factors. During the epidemic phase, the effective number of infections increased between approximately 10-fold and approximately 100-fold. Addition of all other available DRC HCV sequences to the analysis produced similar results (Supplementary Figure 5).
![Reconstructed transmission history of hepatitis C virus (HCV) subtypes 4r and 4k in Kinshasa. Each plot shows the change through time in epidemic size (calculated as [effective population size] × [generation time]) on a log scale. Thick lines indicate the median estimate and the shaded areas show the 95% highest posterior density credible region. Estimates from both the HCV core region and the NS5B region are shown; see the key in the top right. A, Results for subtype 4r. B, Results for subtype 4k. For each subtype, 4 different molecular clock and coalescent model combinations (1–4) are shown.](https://oup.silverchair-cdn.com/oup/backfile/Content_public/Journal/jid/214/3/10.1093_infdis_jiw009/3/m_jiw00901.jpeg?Expires=1749883322&Signature=tYU2B4EW5WAnd463DNLGj6YhTou0c5RzMR-RdlmEW2v7dJEZIcE3oSG3~orqNSMAE-Ap3LypRg4q~ueHNoie9jKEhwXvD8bKEiMYQqx0UCKnmkBSCzFFltNvLyav2fOFHxF14AtM6vh6pKDbkJxQ2Al~51nLeWu5fD61ZJ6QRNqb4Zo1kAgYFkX-KsQt1wF8ITnzwXdENgH9MLoKMlINrdhq5RhEnOZhK49wQowejCx0vQPMfiEzS443MKJw98588VkaPWHWKoo5m0FK8VgecG6rfP5oq4T1encVvG7WX88nuiiGVjh0cEICWzVcahv4UxOEUk66uoWWvWbKntCBpg__&Key-Pair-Id=APKAIE5G5CRDK6RD3PGA)
Reconstructed transmission history of hepatitis C virus (HCV) subtypes 4r and 4k in Kinshasa. Each plot shows the change through time in epidemic size (calculated as [effective population size] × [generation time]) on a log scale. Thick lines indicate the median estimate and the shaded areas show the 95% highest posterior density credible region. Estimates from both the HCV core region and the NS5B region are shown; see the key in the top right. A, Results for subtype 4r. B, Results for subtype 4k. For each subtype, 4 different molecular clock and coalescent model combinations (1–4) are shown.
The CEC model was used to estimate the growth rate and the start and end dates of the epidemic phase (Figure 2A). Estimates of r, the exponential growth rate, were high for both subtypes (corresponding to an epidemic doubling time of approximately 2–3 years) and similar to those previously reported for the Egyptian HCV epidemic [18], the parenteral causes of which are well characterized [19]. The average estimated start date of the growth phase is 1956 (range, 1947‒1965; Figure 2B). Similar estimates were obtained when all other known HCV DRC sequences were included and when sequences from the 2 genome regions were combined (average start date, 1955; Supplementary Figure 6). The estimated end date of the growth phase was more variable among data sets; on average, it was 1979 (range, 1967‒1992; Figure 2C). Growth phase start and end dates were typically earlier for the core data sets, suggesting that the core region evolutionary rate was marginally underestimated or that the NS5B rate was overestimated.
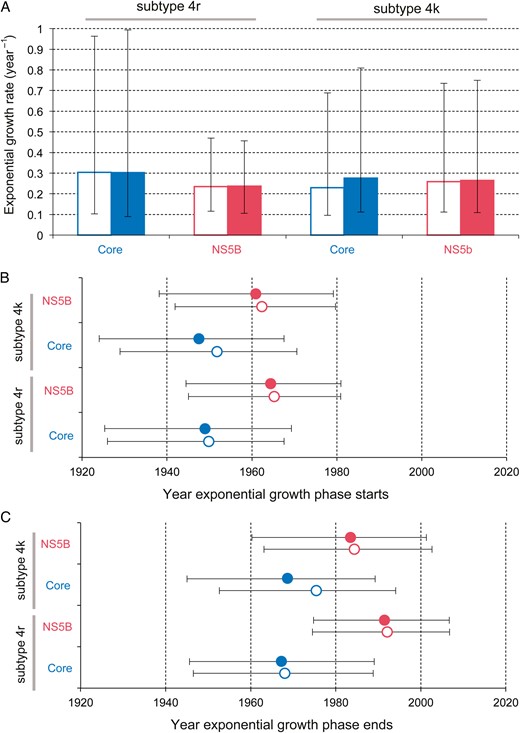
Estimated growth rate and time scale of hepatitis C virus (HCV) subtype 4r and 4k spread in Kinshasa. The CEC model (see “Methods” section) was used to estimate 3 epidemic parameters for each data set: the exponential growth rate during the epidemic phase (A), the start date of the exponential phase (B), and the end date of the exponential phase (C). Boxes and points indicate the median estimate for each parameter, while error bars show the 95% highest posterior density credible regions. Open boxes and points represent values estimated using a strict molecular clock model; solid boxes and points represent those estimates using a relaxed molecular clock model.
DISCUSSION
During the colonial era in much of sub-Saharan Africa, poorly effective antimicrobials were administered intravenously with reused and inadequately sterilized syringes and needles, potentially facilitating the transmission of blood-borne viruses, a risk then unknown [10]. Previous epidemiological studies have supported the iatrogenic transmission, approximately 40 to approximately 70 years ago, of 3 different blood-borne viruses: HIV-2, in Guinea-Bissau (through treatment of African trypanosomiasis and tuberculosis); HCV, in Cameroon (through receipt of antimalarials and transfusions), Egypt (through treatment of schistosomiasis), and the Central African Republic (through treatment of trypanosomiasis); and HTLV-1, in the Central African Republic (through receipt of transfusions and chemoprophylaxis of trypanosomiasis) [13, 20–22].
The current study combined 2 independent sources of information, classical epidemiology and viral gene sequences, to reconstruct the time scale and causes of past viral transmission in Kinshasa. It revealed that, among elderly long-term residents of Kinshasa, multiple risk factors from the 1950s onward drove rapid iatrogenic transmission of HCV. HTLV-1 infection was also associated with parenteral risk factors. Since Kinshasa is the location where HIV-1 group M was established some 60 years ago and from where it was ultimately exported to the rest of the world [5], it is plausible that the same factors were involved in the simultaneous amplification of HIV-1.
The high genetic diversity of HCV genotype 4 isolates supports prior findings that it originated from central Africa [23]. Intravenous antimalarials were associated with genotype 4 infection in Kinshasa, where many febrile illnesses are diagnosed as malaria without supporting evidence and where healthcare workers, often directly paid by patients, prefer to administer an injectable, desired, and, hence, more lucrative treatment. As was the case for HIV-2 in Bissau [21], HCV was transmitted in Kinshasa during the treatment of tuberculosis with intramuscular streptomycin, used throughout the second half of the 20th century [11]. While an intramuscular injection is less prone to transmit HCV (or HIV) than an intravenous injection [24], because a lower inoculum is not pushed directly into a vein, patients with tuberculosis received 60–100 streptomycin injections, daily or twice weekly, and the risk was commensurate.
Specific HCV subtypes were associated with intravenous injections, for any indication, in 2 Kinshasa hospitals, while HTLV-1 positivity correlated with intravenous injections in 2 other hospitals, illustrating the importance of founder effects generated by the introduction, or lack thereof, of a particular viral strain within the patient population of a given facility. Further, HCV subtype 4r infection was associated with injections at a colonial-era venereology clinic where hundreds of intravenous injections were performed each day, with syringes and needles merely rinsed between patients, leading to an outbreak of so-called inoculation hepatitis in 1951–1952 [12, 25, 26].
Albeit less prevalent than HCV, HTLV-1 is an interesting proxy for historical transmission of HIV-1, as it shares a simian reservoir and the capacity to infect CD4+ T cells [27]. Our results indicate that iatrogenic transmission facilitated the spread of HTLV-1 in Kinshasa, along with sexual and vertical routes, even if contaminated injections may be less prone to transmit HTLV-1 because the virus is present as proviral DNA within lymphocytes, not as free virions. Blood transfusions, which remain unscreened for viruses other than HIV, were administered to one fifth of participants and allowed the transmission of HTLV-1 and HCV, illustrating the co-occurrence in Kinshasa of multiple modes of iatrogenic transmission of blood-borne viruses. The higher HTLV-1 prevalence among women is in line with other studies and with more effective heterosexual transmission from males to females than vice versa [27].
Although our evolutionary and epidemiological analyses both have limitations, they are based on independent data (albeit from the same sample set) and on different model assumptions, and thus support each other. For some HCV-infected participants who cleared the virus, antibody titers may have waned below the cutoff for positivity [28]. Individuals who died from cirrhosis or liver cancer were not available for study, so, in theory, HCV subtypes perhaps less prone to cause liver disease might be overrepresented. Individuals who acquired HIV infection more than a decade ago, some of them parenterally, were also likely absent from this population. Incomplete recall of medical interventions is inevitable for events that occurred decades earlier. These factors may have biased our measures of association.
Further, a low HTLV-1 prevalence limited our statistical power for that retrovirus. It is likely that other modes of iatrogenic transmission of blood-borne viruses operated in Kinshasa, which we were unable to document with confidence. This is suggested by the independent association between HCV and HTLV-1 infections, which may reflect unmeasured parenteral exposures common to both viruses (residual confounding).
In cross-sectional studies such as ours, the time sequence between exposures and outcomes is unclear. However, evolutionary analyses of virus gene sequences from precisely the same study population provided an independent estimate of when HCV transmission took place. Although such analyses can be susceptible to the presence of recombination or strong natural selection in the viral population, recombination is uncommon for HCV, and the congruence of results from different viral genome regions indicates that our results are robust to the effects of selection.
Iatrogenic transmission can drive HCV to high prevalence because, in contrast with HIV-1, most patients survive and remain viremic for decades, and the per-exposure efficacy of its parenteral transmission may be higher (0.5% vs 0.3%) [29]. In Cameroon and Gabon, HCV prevalence increases steeply with age, far beyond what could be expected from cumulative exposure, representing a cohort effect [30, 31]. Here we show that in Kinshasa, the city at the center of the emergence of pandemic HIV-1, the exponential growth rate of HCV from the 1950s onward paralleled that in Egypt, a country in which millions were infected iatrogenically with the same virus during campaigns against schistosomiasis [19, 20]. Further, we estimate that HCV expanded 3 times faster than the population of Kinshasa [5].
Our study provides evidence that at least 2 lineages of HCV grew exponentially in the Belgian Congo's capital in the mid-20th century. Start dates for this growth period were estimated independently from core and NS5b alignments of subtypes 4k and 4r by using several models, and all fell between 1947 and 1965, with the great majority of posterior probability being placed before 1960 (Figure 2). These molecular clock estimates, consistent with the epidemiological results, which indicate a higher risk of HCV before 1960, coincide with the period during which HIV-1 took hold within Kinshasa [4, 5]. We therefore conclude that a nonnegligible (yet ultimately unquantifiable) fraction of HIV-1 transmission in Léopoldville during the time window critical for pandemic establishment occurred through iatrogenic routes. In the 1960s, high-risk prostitution appeared in the city [11, 26], fewer diseases required multiple administration of intravenous drugs, disease control interventions collapsed, and the relative contribution of parenteral transmission may have consequently declined.
The present findings represent the first empirical evidence for the hypothesis that iatrogenic transmission played a role in the emergence of HIV-1 in Kinshasa in the mid-20th century. The establishment of HIV-1 group M, uniquely among HIV strains, as a global pandemic undoubtedly resulted from multiple causal factors whose relative contributions may never be fully resolved. However, historical iatrogenic transmission in the hub of Central Africa appears to have been one such contributor.
Notes
Acknowledgments. We thank Charlotte Khonde (deceased), Christiane Buese, Lablonde Kingolo, and Martine Makulu, for data collection; Jean-Carol Pelletier, Guy Mercier, Jacqueline Bokoo, Erasme Kapenda, Jean Lepetit Khonde-ki-Ngimbi, Lucie Kandu, and Nestor Leta Kandu (deceased), for logistical and administrative support; Annie-Claude Labbé, for advice concerning laboratory issues; and the rectors and administrative staff of the following parishes of Kinshasa for their precious collaboration: St-Michel, St-Pierre, Notre-Dame-du-Congo, St-François-de-Sales, St-Muzeyi, Précieux-Sang, and University.
Financial support. This work was supported by institutional funds from the Université de Sherbrooke, University of Oxford, and Institut Pasteur.
Potential conflicts of interest. All authors: No reported conflicts. All authors have submitted the ICMJE Form for Disclosure of Potential Conflicts of Interest. Conflicts that the editors consider relevant to the content of the manuscript have been disclosed.
References
Author notes
C. A. H., J. I., and E. H. F. contributed equally to this work.
O. G. P. and J. P. contributed equally and are joint senior authors.

