


Abstract
Background. Piperaquine, coformulated with dihydroartemisinin, is a component of a widely used artemisinin combination therapy. There is a paucity of data on its antimalarial activity as a single agent. Such data, if available, would inform selection of new coformulations.
Methods. We undertook a study in healthy subjects, using the induced blood stage malaria (IBSM) model to test the antimalarial activity of single doses of piperaquine (960, 640, and 480 mg) in 3 cohorts. In a pilot study in the third cohort, gametocyte clearance following administration of 15 mg, or 45 mg or no primaquine was investigated.
Results. Parasite clearance over the 48-hour period after piperaquine administration was more rapid in the 960 mg cohort, compared with the 640 mg cohort (parasite reduction ratio, 2951 [95% confidence interval {CI}, 1520–5728] vs 586 [95% CI, 351–978]; P < .001). All 24 subjects developed gametocytemia as determined by pfs25 transcripts. Clearance of pfs25 was significantly faster in those receiving primaquine than in those not receiving primaquine (P < .001).
Conclusions. Piperaquine possesses rapid parasite-clearing activity, but monotherapy is followed by the appearance of gametocytemia, which could facilitate the spread of malaria. This new information should be taken into account when developing future antimalarial coformulations.
Clinical Trials Registration ACTRN12613000565741.
The continuing emergence of antimalarial drug resistance and the renewed focus on malaria elimination underline the need for new antimalarial drugs and interventions to break the chain of transmission. In addition, an improved understanding of the clinical profiles of drugs that are already licensed but whose underlying activity is incompletely documented is likely to aid the design of future combination therapies for malaria.
Piperaquine is a bisquinoline antimalarial that was developed in the 1960s. It was used as a monotherapy in China until the 1980s, when resistance developed [1]. More recently it has been coformulated with dihydroartemisinin (eg, Eurartesim), and this artemisinin combination therapy (ACT) regimen is now widely used [2]. Dose selection of piperaquine for use in coformulations has required a compromise between its variable pharmacokinetic profile in different patient groups, such as small children [3] and pregnant women [4], the pronounced effect of food on its absorption [5], and its potential to cause QT prolongation at high plasma levels [6]. In addition, there is a paucity of information on its in vivo antimalarial activity as a single agent. Such information is critical for selection of the correct dose to be used in any new coformulations. For instance, piperaquine is under study in combination with OZ439 [7] and KAE609 [8], new synthetic antimalarial drug candidates.
The development of safe and robust controlled human malaria infection (CHMI) systems has been a major advance for both drug and vaccine development for malaria. Although CHMI systems have predominantly used sporozoites, either from mosquito bites [9, 10] or from injection of cryopreserved sporozoites [11], an alternative approach, namely induced blood stage malaria (IBSM) [12], is increasingly being used for testing the efficiency of drugs active against blood stage malaria [13]. Observations of the persistence of positive polymerase chain reaction (PCR) results for P. falciparum in a clinical trial in which sulfadoxine-pyrimethamine was tested in the IBSM model [14] suggested that this was attributable to appearance of gametocytemia following treatment with this drug. While gametocytemia does not produce symptoms, it renders carriers infectious to mosquitoes and may promote subsequent spread. Therefore, testing for gametocytemia after administration of a schizonticidal drug in a clinically relevant setting would be informative.
To gain more information on the pharmacodymamic profile of piperaquine, we undertook a clinical trial, using the IBSM model. When we observed that subjects treated with a single dose of piperaquine showed evidence of gametocytemia, we undertook further study to characterize the course of gametocytemia. We conducted a nested pilot randomized controlled trial to investigate the gametocyte clearing effect of primaquine following piperaquine treatment, as this is the only antimalarial in clinical use with recognized activity against mature gametocytes of P. falciparum.
METHODS
Study Design and Subjects
This phase 2, single center study was conducted at the contract research organization Q-Pharm (Brisbane, Australia). Healthy malaria-naive males and nonpregnant females aged 18–50 years who met the inclusion and exclusion criteria (Supplementary Materials) were considered eligible for the study. The study was conducted in accordance with the protocol approved by the QIMR Berghofer Human Research Ethics Committee and was registered in the Australian and New Zealand Clinical Trials Registry (ANZCTRN12613000565741). All subjects gave written informed consent before being included in the study.
IBSM Model
IBSM was undertaken as previously described [13]. In brief, subjects were inoculated on day 0 intravenously with approximately 1800 viable Plasmodium falciparum–infected human erythrocytes of the chloroquine-susceptible 3D7 strain. Study subjects were treated following an overnight fast with a single dose of piperaquine, either 960 mg (cohort 1), 640 mg (cohort 2), or 480 mg (cohorts 3A and 3B). Parasite growth in inoculated subjects was monitored by quantitative PCR (qPCR) targeting P. falciparum 18S ribosomal DNA as described previously [15]. Treatment with piperaquine (Penn Pharmaceuticals) was triggered by parasitemia reaching designated levels (cohort 1, ≥ 800 parasites/mL; cohorts 2 and 3, ≥ 1000 parasites/mL). Piperaquine was administered on day 7 in cohorts 1 and 3B and on day 8 in cohorts 2 and 3A. Treatment of recrudescence consisted of artemether-lumefantrine (Riamet; Novartis Pharmaceuticals, Sydney, Australia) in cohorts 1 and 2 and a second dose of piperaquine (960 mg) in cohort 3. Treatment for recrudescence was determined by appearance of asexual parasitemia in cohorts 1, 2, and 3B and at a predefined time point in cohort 3A (day 17). All subjects received a curative course of artemether-lumefantrine at the end of the study (day 28). Subjects were required to have normal glucose-6-phosphate dehydrogenase activity (Trinity Biotech, Bray, Ireland). Subjects in cohorts 1 and 2 with evidence of gametocytemia, as determined by detection of pfs25 by reverse transcription qPCR (qRT-PCR) at day 28, were administered a single dose of primaquine 45 mg (Boucher and Muir, Australia). In cohort 3, a pilot nested study to investigate gametocyte clearance following administration of a single dose of primaquine was undertaken. Subjects (4 per group) were randomly assigned to receive 45 mg of primaquine, 15 mg of primaquine, or, as a control, no primaquine. Primaquine was administered 14 or 17 days after the first dose of piperaquine. The control group received primaquine treatment at the end of the study (25 or 27 days after the first piperaquine dose; Figure 1). CYP2D6 genotyping was undertaken in subjects in cohort 3 to investigate the pharmacogenetic effect of primaquine metabolism on gametocyte clearance.
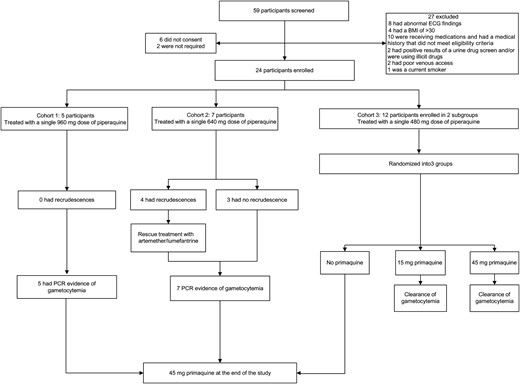
Trial profile. Abbreviations: BMI, body mass index; ECG, electrocardiography; PCR, polymerase chain reaction.
Monitoring Gametocytemia
The concentration of P. falciparum gametocytes in blood was quantified by qRT-PCR (Supplementary Materials) to measure the level of pfs25, a messenger RNA transcript expressed in female gametocytes [16]. To distinguish between recrudescence of infection and gametocytemia, the P. falciparum ring stage transcript PFE0065w was quantified in an identical fashion by qRT-PCR, using primers previously described [17].
Microscopic confirmation of the presence of gametocytes was performed by examination of Giemsa-stained thick and thin blood smears prepared using blood specimens from subjects. Fluorescence-activated cell-sorting (FACS) analysis (with a FACS ARIA III cell sorter) was used to identify P. falciparum gametocytes in whole-blood specimens. Sorting was performed at room temperature. The gating strategy used to isolate gametocytes involved CD45, to identify white blood cells, and an RNA stain, to identify reticulocytes. Distinct parasite populations were analyzed using the DNA dyes SYBR Green and Hoechst. The populations identified were sorted and placed on microscope slides to confirm the presence of gametocytes.
CYP2D6 Genotyping
Genotyping for CYP2D6 polymorphisms used established PCR based methods [18] at the Blacktown Molecular Research Laboratory (Australia). The CYP2D6 loss-of-function polymorphisms panel included CYP2D6*4 (c.353-1 G > A) rs3892097, CYP2D6*41 (c.832 + 39 G > A) rs28371725, CYP2D6*3 (c755delA) rs35742686, CYP2D6*10 (*4) (c.100C > T) rs1065852, and CYP2D6*5 (deletion).
Outcome Measures
Parasitemia was measured each morning from day 4 until PCR results became positive, after which measurements were performed every 12 hours until treatment. Once piperaquine was administered, parasitemia was measured after 2, 4, 8, 12, 24, 30, 36, 48, and 60 hours, with additional measurements every 12–24 hours thereafter until results of 2 consecutive PCRs were negative. PCR monitoring was then performed 3 times/week until artemether-lumefantrine administration, on the morning of the first artemether-lumefantrine dose, on the 2 mornings after first artemether-lumefantrine dose, and at the end of the study. The primary efficacy end point was the clearance of parasites, as determined by the parasite reduction ratio (PRR), defined as the ratio of the parasite density between admission and 48 hours after treatment [14, 19].
The activity of different doses of primaquine in clearing gametocytes from the blood of subjects who became gametocytemic after piperaquine treatment was analyzed. The outcome variables to characterize the course of gametocytemia were days to clearance of pfs25 transcripts.
Statistical Analysis
Parasite clearance was analyzed as previously reported [14], and PRRs and parasite half-lives were recoded. The PRR was estimated using the slope of the optimal fit for the log-linear relationship of the decay in parasitemia level. To investigate differences in PRRs between dose groups, an omnibus test for between-group differences was used [14, 20]. To characterize the course of gametocytemia, days to clearance of pfs25 transcripts and the slope of the curve representing the daily decline in pfs25 transcript counts, after log10 transformation of the counts, were analyzed. The number of days to clearance for one subject (R013), who had residual gametocytemia at the end of study, was extrapolated from the available data, using the slope of the decay curve. The number of days to clearance was analyzed only for the primaquine groups (the control group, which received primaquine treatment only at the end of study, was not analyzed). The Mann–Whitney U test and 1-way analysis of variance were used to test for differences between dose groups and to estimate mean values and 95% confidence intervals (CIs) for the number of days to clearance, respectively. The slope of the decay curve was estimated by simple linear regression of the log10pfs25 transcript count against days. This slope was then analyzed by general linear models, with cohort, dose, and their interaction as factors. The data for slopes were also analyzed by 1-way analysis of variance.
Sample Size
This study was designed to determine the effect of piperaquine on parasite growth kinetics. Historically, 8 participants in a dose cohort have proven sufficient to characterize the effects of a drug on malaria parasite kinetics following induction of IBSM in healthy subjects [13].
RESULTS
Subject Profile
Of 59 subjects screened, 27 did not meet inclusion criteria, 6 withdrew before enrollment, and 2 were not required for the study. A total of 24 subjects were enrolled, of whom 5 were in cohort 1, 7 were in cohort 2, and 12 were in cohort 3; the third cohort was divided into 2 groups of 6 (cohort 3A and 3B; Figure 1). The first subject enrolled in 3 June 2013, and the study was completed on 24 July 2014. Demographic characteristics of the subjects are presented in Table 1.
Demographic Characteristics of Study Subjects
| Characteristic | Value |
|---|---|
| Age, y | |
| Mean ± SD | 22.9 ± 3.5 |
| Range | 18–31 |
| Sex, no. (%) | |
| Male | 15 (62.5) |
| Female | 9 (37.5) |
| Race, no. (%) | |
| Australian white | 20 (83.3) |
| Australian Asian | 1 (4.2) |
| Other | 3 (12.5) |
| Body mass index | |
| Mean ± SD | 22.9 ± 2.5 |
| Range | 18.3–27.9 |
| Height, cm | |
| Mean ± SD | 172.7 ± 7.7 |
| Range | 149–186 |
| Weight, kg | |
| Mean ± SD | 68.1 ± 8.8 |
| Range | 51.1–86.9 |
Abbreviation: SD, standard deviation.
Pharmacodynamic Effect of Piperaquine
The typical growth pattern of asexual parasitemia was observed in all study subjects (Figure 2 and Supplementary Figure 2), with parasitemia first becoming detectable by qPCR on day 4. Initial clearance of parasitemia occurred in all subjects following piperaquine administration. No recrudescence of asexual parasitemia occurred among subjects in cohort 1 (960 mg). Among subjects in cohort 2 (640 mg), 4 of 7 (57%) experienced recrudescence and required rescue with artemether-lumefantrine. Recrudescent asexual parasitemia was detected in this group between days 16 and 26. Piperaquine instead of artemether-lumefantrine was administered for recrudescence in cohort 3 (480 mg) because of concerns that the latter could have a toxic effect on gametocytes that may confound the pilot nested study in this cohort. In cohort 3A, all subjects received a second dose of 960 mg of piperaquine per protocol on days 16 or 17, at which time recrudescence of asexual parasitemia had not occurred. In cohort 3B, a protocol amendment permitted subjects to be observed without a second dose of piperaquine until evidence of recrudescence of asexual parasitemia was detected by qPCR. In this cohort, 3 subjects showed recrudescent parasitemia on study days 11, 23, and 27 and were treated with a second dose of piperaquine (960 mg). The remaining subjects in cohort 3B did not receive a second dose of piperaquine.
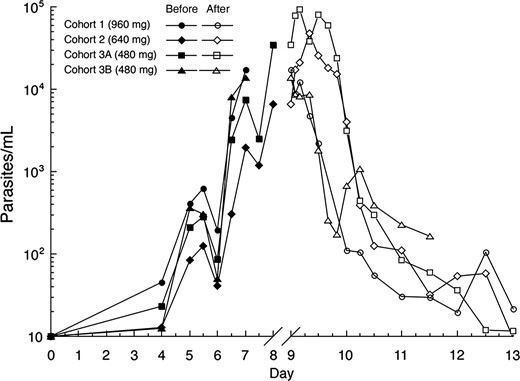
Mean parasitemia level (18S) before and after piperaquine treatment for cohort 1 (960 mg), cohort 2 (640 mg), and cohort 3 (480 mg). Day 0 corresponds to inoculation day. Piperaquine was administered to subjects in cohorts 1 and 3B on day 7 and to subjects in cohorts 2 and 3A on day 8. The scale of the x-axis is expanded on days 9–13 to better illustrate the course of parasitemia immediately after piperaquine treatment.
The PRR and parasite clearance half-lives following piperaquine treatment, as well as corresponding 95% CIs, for cohorts 1, 2, 3A, and 3B are shown in Table 2. Subject-specific PRR estimates and corresponding 95% CIs are presented in Supplementary Table 1. Investigation for differences in parasite clearance between the piperaquine dose cohorts indicated an overall significant difference (QB 53.6; df = 3; P < .001). Post hoc pair-wise comparisons taking into account multiple comparisons indicated that the PRR in cohort 1 was significantly different from that for cohort 2 (ZG statistic, 3.78; Scheffe P<.001), cohort 3A (ZG statistic, 2.98; Scheffe P = .012), and cohort 3B (ZG statistic, −4.00; Scheffe P < .001). The PRR estimate for cohort 2 did not differ significantly from that for cohort 3A (480 mg dose; ZG statistic, 1.00; Scheffe P = .61); however, it was significantly different from the PRR for cohort 3B (ZG statistic, −6.68; Scheffe P < .001). There were significant differences between the PRR estimates for cohorts 3A and 3B (ZG ZG statistic, −6.17; Scheffe P<.001).
Cohort-Specific Parasite Reduction Ratios (PRRs) and Parasite Clearance Half-lives (t1/2) With Corresponding 95% Confidence Intervals (CIs)
| Cohort (Piperaquine Dose) | No. | PRR (95% CI) | Parasite Clearance, t1/2 (95% CI) |
|---|---|---|---|
| 1 (960 mg) | 4 | 2951 (1520–5728) | 4.16 (3.84–4.54) |
| 2 (640 mg) | 7 | 586 (351–978) | 5.22 (4.83–5.68) |
| 3A (480 mg) | 6 | 841 (515–1373) | 4.94 (4.61–5.33) |
| 3B (480 mg) | 3a | 46 592 (14 350–151 277) | 3.10 (2.79–3.48) |
a The PRR was estimated using the slope of the optimal fit for the log-linear relationship of the parasitemia decay. Only data from subjects with an adequate model fit (P < .001) were used to calculate the cohort specific PRR (n = 3).
Course of Gametocytemia
Following clearance of asexual parasitemia, pfs25 transcript became detectable in the blood of all subjects by 7 days after administration of the first dose of piperaquine (day 13), and levels peaked 10–11 days after piperaquine treatment (Figure 3). A dose-response relationship was observed with the different doses of piperaquine in terms of the pfs25 transcript level observed in the blood of participants. A higher dose of piperaquine resulted in a considerably lower pfs25 transcript level (Figure 3). The presence of gametocytes in the blood was verified by thick blood smear and by flow cytometry in 2 subjects randomly selected (both were from cohort 3), which was considered representative of the study population (Figure 4).
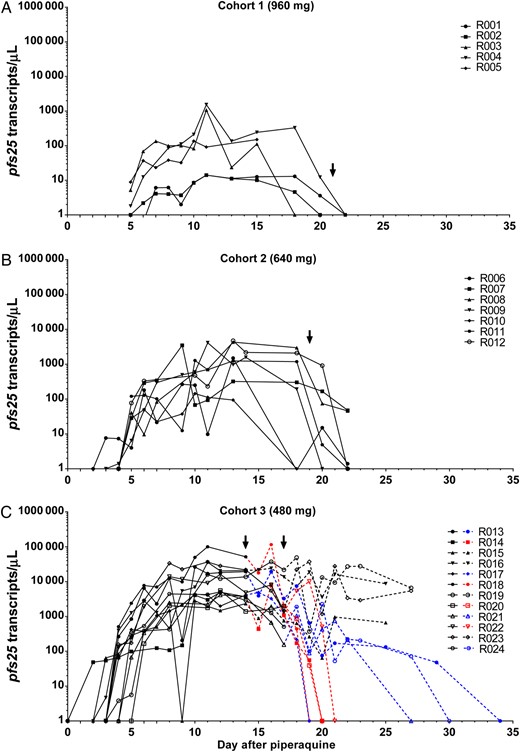
Course of gametocytemia after piperaquine treatment. A, Cohort 1 (960 mg). Subjects in cohort 1 received primaquine 21 days after piperaquine treatment. B, Cohort 2 (640 mg). Subjects in cohort 2 received primaquine 19 days after piperaquine treatment. C, Cohort 3 (480 mg). In cohort 3A (R013–R018), all subjects but R016 received a second dose of piperaquine 9 days after the first piperaquine dose. Subject R016 received a second dose of piperaquine 8 days after the first piperaquine dose. In cohort 3B (R019–R024), subjects who had recrudescence received a second dose of piperaquine (4, 16, and 20 days after the first piperaquine dose for subjects R019, R020, and R023, respectively). Subjects in cohort 3 were randomized in 3 arms to receive 15 mg of primaquine, 45 mg of primaquine, or no primaquine. Subjects in the 15 mg and 45 mg arms received primaquine treatment 14 or 17 days after the first piperaquine dose (indicated with an arrow). Subjects in the no-treatment arm only received primaquine treatment at the end of the study (25 or 27 days after the first piperaquine dose). Dashed lines in the figure represent gametocytemia after randomization for primaquine treatment. Dashed lines in blue correspond with 15 mg primaquine treatment arm; dashed lines in red correspond to the 45 mg primaquine treatment arm; dashed lines in black correspond to the no-treatment arm (control group). For the control group, clearance of gametocytemia following primaquine treatment at the end of study is not shown.
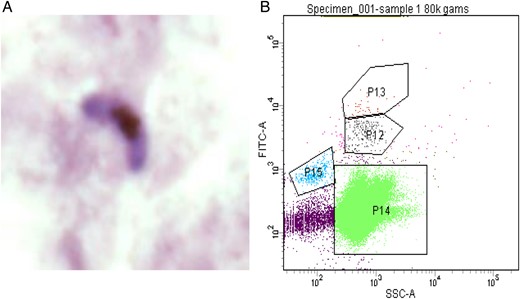
Confirmation of gametocytemia. A, A Giemsa-stained female gametocyte detected on a thick blood smear. B, Gating strategy for gametocyte detection for flow cytometry. Abbreviations: P12/P13, gametocytes; P14, red blood cells; P15, reticulocytes.
After gametocytemia was observed in all subjects in cohorts 1 and 2, the protocol was amended to undertake a pilot nested study in cohort 3 to investigate gametocyte clearance following receipt of different single doses of primaquine. Following administration of a 45 mg dose of primaquine, pfs25 transcripts cleared from the blood of the 4 recipients in a mean of 4.5 days (95% CI, 2.5–6.6 days; Table 3). Following administration of a single 15 mg dose of primaquine, clearance of pfs25 transcripts occurred in a mean of 12.0 days (95% CI, 2.0–22.0 days). For the 4 subjects who did not receive primaquine, pfs25 transcripts remained detectable for >11 days but cleared rapidly following administration of 45 mg of primaquine at the end of the study. The difference in the slope of the decay curves between the 3 primaquine dose cohorts was significant (P < .001). All pair-wise comparisons were significant (P < .05; Table 3).
Days to Clear pfs25 With 2 Doses of Primaquine Administered to Subjects in Cohort 3
| Cohort 3 | No. | Primaquine Dose | Time to Clear, d, Mean (95% CI) | Slope of Decay Curve (95% CI of Slope) |
|---|---|---|---|---|
| Group 1 | 4 | 45 mg | 4.5 (2.5–6.6) | 0.921 (.566–1.275) |
| Group 2 | 4 | 15 mg | 12.0 (2.0–22.0) | 0.400 (−.020 to .819) |
| Group 3 | 4 | 0 | >11 | 0.032 (−.008 to .070) |
One-way analysis of variance was used estimate mean and 95% confidence intervals (CIs) for days to clearance [14]. The slope of the decay curve was estimated by simple linear regression of the log10pfs25 transcript count against days. All pair-wise differences were significantly different (P < .05).
Exploratory analysis for the appearance of P. falciparum ring stage transcripts, to distinguish between recrudescence of infection and gametocytemia, using the ring stage marker PFE0065w, showed that this transcript appeared in the blood 6–8 days before detection of recrudescence and therefore served as a useful means of distinguishing whether the presence of P. falciparum DNA in the blood was due to gametocytes or asexual parasites (Supplementary Figure 1).
CYP2D6 Genotyping
Data indicate that an active metabolite of primaquine shows gametocidal activity and that CYP2D6 has a critical role in its activation [21, 22]. To study the effect of the CYP2D6 polymorphism on primaquine activity, CYP2D6 genotyping was performed in cohort 3. CYP2D6 genotyping identified polymorphisms in 6 of 12 subjects, with 4 having a CYP2D6 heterozygote genotype predicted to confer diminished enzyme activity. One subject (R013), who was a homozygote at 2 loci (CYP2D6*4+/+ and CYP2D6*10+/+), a genotype predicting poor metabolism of primaquine, responded poorly to 15 mg primaquine and remained PCR positive for pfs25 for 20 days following primaquine treatment (Supplementary Table 2 and Figure 3).
Safety Results
Adverse events were in alignment with those observed in previous IBSM studies (Supplementary Table 3). The most-common mild symptoms reported were headache (32.7% [37 of 113]), fever (23% [26 of 113]), fatigue/lethargy (8.8% [10 of 113]), and chills (8.0% [9 of 113]). The majority of the malaria-related symptoms were mild (72% [93 of 129]) or moderate (26% [33 of 129]), with 2% (3 of 129) reported as severe (fever with a temperature of >39°C experienced by 3 subjects). All symptoms either resolved without treatment (59% [76]) or after treatment with paracetamol (37% [48]). Following administration of piperaquine, 11 episodes of gastrointestinal symptoms were reported (nausea, 4 episodes; diarrhea, 4; and abdominal cramps, 3), of which 8 were of mild severity and 3 were of moderate severity. Although transient and mild derangements in laboratory test results were observed, only 3 were deemed clinically significant: an alanine aminotransferase level of 140 U/L (normal range, 5–40 U/L), peaking 7 days after piperaquine treatment; thrombocytopenia (platelet count, 111 × 109 platelets/L; normal range, 150 × 109–450 × 109 platelets/L); and leukopenia (white blood cell count, 1.9 × 10⁹ cells/L; normal range, 3.5 × 10⁹ cells/L–12.0 × 109 cells/L) 2 days after piperaquine treatment. All resolved spontaneously.
DISCUSSION
Piperaquine administered at a dose of 960 mg (cohort 1) showed notable antimalarial potency against the chloroquine-susceptible strain of P. falciparum used in this study (3D7). Its activity was significantly greater than that of atovaquone-proguanil [13]. A dose-response relationship in terms of the rapidity of parasite clearance was apparent between the 960 mg dose and the 640 mg dose (cohort 2), with the significance between the 960 mg dose and one subcohort that received 480 mg (cohort 3A) differing from that between the 960 mg dose and the other subcohort that received 480 mg (cohort 3B). The rapidity of parasite clearance with 960 mg corresponded with this dose being curative in this experimental infection setting, unlike a single dose of 640 mg or 480 mg. It is important to note that a smaller parasite biomass is present in this system, compared in clinical malaria. Therefore, in clinical malaria, a more prolonged exposure to parasiticidal drug levels would be necessary to ensure cure.
There were significant differences observed between the parasitemia clearance rates of the two 480 mg subcohorts. As the timing of inoculation in the 2 subcohorts differed by a day, differences in parasite clearance may be due to a differential effect of the drug on parasites treated at different stages of their life cycle. Sensitivity analyses to investigate the influence of consecutive time points at which the parasite level was below the limit of detection on the PRR estimates produced similar individual and cohort-specific PRR estimates and, hence, similar conclusions as the results presented here.
Following treatment of study subjects in all 3 dose cohorts, low-level parasitemia was observed, as evidenced by a low-level positive PCR signal. Apart from the 7 subjects who experienced recrudescent asexual parasitemia in the 640 mg and 480 mg cohorts, this persistent PCR positivity did not increase exponentially and was accompanied by a positive PCR result for the gametocyte-specific transcript pfs25, indicating the potential of piperaquine to permit the appearance of gametocytemia. The ring stage assay was able to distinguish between recrudescent asexual parasitemia and gametocytemia (Supplementary Figure 1). These findings are in agreement with observation of the development of gametocytemia following treatment with other antimalarials, such as chloroquine, amodiaquine, or sulfadoxine-pyrimethamine [23, 24]. These drugs used alone or in combination may permit the transmission of gametocytes to mosquito vectors [25]. Gametocytemia following subcurative treatment with antimalarial drugs would be expected to facilitate spread of drug-resistant malaria parasites [26], as well as increase the infectious reservoir [27]; both have significant implications for malaria control.
We observed significant differences in the kinetics of clearance of pfs25 transcripts between the groups treated with different doses of primaquine or no primaquine. In general, subjects administered 45 mg of primaquine cleared transcripts within 5 days, while those who did not receive any primaquine until the end of the study remained gametocytemic. Clearance of pfs25 transcripts in subjects given 15 mg of primaquine took significantly longer than in those given 45 mg. Of further interest is the observation that the one subject with a CYP2D6 homozygote genotype in 2 loci (a poor metabolizer phenotype), responded poorly to 15 mg of primaquine as assessed by clearance of pfs25 transcripts. It has been hypothesized that the activity of primaquine against liver stage hypnozoites requires redox cycling of hydroxylated metabolites to form reactive oxygen toxic to parasites, with formation of these primaquine hydroxy metabolites mediated by a CYP2D6 pathway [21]. Although this study was underpowered to determine whether this polymorphism affects the gametocytocidal activity of primaquine, it is possible that loss of function due to inactivating polymorphisms in this gene may also inhibit clearance of gametocytes, as well as liver stage parasites.
Although we have demonstrated a dose-response relationship of primaquine and clearance of gametocytemia, based on the absence of pfs25 transcripts, in this study, the assessment of its transmission-blocking effect should be interpreted with caution. Successful transmission of malaria requires the presence of both male and female gametocytes, and therefore assessment of the efficacy of gametocidal drugs should consider action on both sexes. Previous studies have indicated that male and female gametocytes of P. falciparum show different responses to antimalarial drugs, using sex-specific assays [28]. Male gametocytes are believed to be more susceptible to antimalarial drugs, and therefore transmission-blocking effects have to be carefully assessed. In this study, primaquine efficacy was measured on the basis of the clearance of pfs25 transcripts, which are specifically present in female gametocytes; such transcripts appear to be readily detected in the circulation.
Although pfs25 represents an indirect measure of gametocytemia, and it is to be more sensitive than microscopy, and the ability of people with submicroscopic gametocytemia to transmit malaria is recognized [29]. An increasing number of reports of resistance to ACT in the greater Mekong basin [30] and, more specifically, failures of the piperaquine-containing ACT regimen, Eurartesim [31–33], highlight that piperaquine has the potential to allow the emergence of gametocytemia and thereby increase the transmissibility of drug-resistant P. falciparum.
It is worth noting that the parasite strain used in this study, 3D7, is chloroquine susceptible. Thus, the pharmacodynamic effects observed in this trial may vary with the underlying drug susceptibility profile of the infecting parasite (eg, chloroquine- or ACT-resistant). Another limitation of this study is that all the subjects were malaria naive. It is well recognized that outcomes of antimalarial treatment differ in populations with different levels of immunity [34].
In conclusion, the present study confirms that the IBSM model offers a robust system to study the efficacy of antimalarial drugs already available or under development, and it provides valuable information about the antimalarial activity of piperaquine, which may be of relevance for designing future antimalarial coformulations. The ability of the IBSM model to determine whether antimalarial drugs such as piperaquine permit the development of gametocytemia also offers the opportunity to gather information on the transmission-blocking activity of candidate antimalarials.
Notes
Acknowledgments. We thank the volunteers who consented to participate in this study; the clinic team of nurses and staff at Q-Pharm; Brett McWhinney, of Pathology Queensland, for performing piperaquine drug assays; Professor Dennis Shanks, for serving as medical monitor; Dr Katharine Trenholme and Nanette Douglas, for assistance in execution of the study; and thank Dr Laura Cascales, for assistance reviewing the manuscript and helpful suggestions.
J. M. C., M. B., J. J. M., S. E., and S. S. designed the clinical trial. J. M. C., P. G., S. E., and S. S. executed the clinical trial. R. R. and C. Y. T. W. designed and executed the qRT-PCR assays. C. J. P. designed and executed flow cytometry. L. M. and P. O. R. performed statistical analysis. J. M. C., C. J. P., P. O. R., and L. M. undertook data analysis. C. J. P. and J. M. C. drafted the manuscript. All authors reviewed and commented on the manuscript. J. M. C. had full access to all the data in the study and had final responsibility for the decision to submit for publication.
Disclaimer. The opinions expressed herein are those of the authors and do not necessarily reflect those of the Australian Defense Force and/or extant Defense Force Policy.
Financial support. This work was supported by Medicines for Malaria Venture, the Government of Queensland (clinical research fellowship to J. M. C.), the National Health Medical and Research Council (practitioner fellowship [grant 1041802] to J. M. C.), and the Wellcome Trust (grant number 095909/Z/11/Z).
Potential conflicts of interest. M. B. and J. J. M. are MMV employees. All other authors report no potential conflicts. All authors have submitted the ICMJE Form for Disclosure of Potential Conflicts of Interest. Conflicts that the editors consider relevant to the content of the manuscript have been disclosed.
References
Author notes
Presented in part: 63rd Annual Meeting of the American Society of Tropical Medicine and Hygiene, New Orleans, Louisiana, 2–6 November 2014. Abstract 1490.

