


Abstract
Background. Little is known about how influenza infections caused by B/Victoria and B/Yamagata virus lineages compare with respect to disease course and susceptibility to antiviral therapy.
Methods. Data from patients with influenza B infections from the first 5 years (2009–2013) of the prospective Influenza Resistance Information Study (IRIS, NCT00884117) were evaluated. Cultured viruses were phenotypically tested for neuraminidase inhibitor (NAI) sensitivity, and sequenced to determine virus lineage (B/Victoria or B/Yamagata). Differences in clinical outcomes (viral clearance and symptom resolution) between virus lineages were assessed using Kaplan–Meier analysis.
Results. In all, 914 patients were positive for influenza B by reverse transcriptase polymerase chain reaction (RT-PCR: B/Victoria, 586; B/Yamagata, 289; not subtyped, 39); 474 were treated with antivirals. No phenotypic resistance to oseltamivir or zanamivir was found in B/Victoria or B/Yamagata viruses. Of 15 predefined resistance mutations, 2 were detected by neuraminidase sequencing: I221T had reduced sensitivity to oseltamivir, and I221V was sensitive to NAI inhibition. No consistent differences between virus lineages in times to viral clearance or to symptom or fever resolution were found in adults and adolescents or in children.
Conclusions. Influenza B virus lineage had no notable effect on disease outcomes or antiviral susceptibility in this population.
Of the 2 types of influenza virus that cause the great majority of clinical illness in humans, influenza B predominates less often in seasonal epidemics than influenza A. In terms of hospitalization and mortality rates, the disease caused by influenza B viruses has generally been milder than A/H3N2 epidemics, but more virulent than seasonal A/H1N1 epidemics [1]; however, recent data from hospitalized patients in the United States suggest that influenza A and B virus infections can be equally severe [2]. Mortality data from the 2011–2012 season showed that the impact of influenza B infections was disproportionately greater in children than adults [3]. Guidelines recommend neuraminidase inhibitors (NAIs) for the treatment of influenza A and B infections, as both types are susceptible to these drugs [4, 5]. Influenza B viruses with reduced susceptibility to NAIs have been reported, typically in patients not exposed to NAIs, but this phenomenon occurs less frequently than in influenza A viruses [6]. Influenza B viruses can be divided into 2 distinct lineages—B/Victoria and B/Yamagata [7]—based on their hemagglutinin (HA) sequence and their antigenicity, but differences between these with respect to clinical features, outcomes, and antiviral susceptibility have not been well studied.
The Influenza Resistance Information Study (IRIS) is one of the largest surveys to specifically examine how the prevalence and development of antiviral resistance correlates with clinical outcomes in adults and children. This prospective multinational observational study has enrolled approximately 4000 patients in 7 countries over 5 years and is continuing to recruit for a further 2 years. Results from the first 3 years of the study showed a low prevalence of emergent resistance, occurring in influenza A viruses only and principally affecting children aged 1–5 years [8]; naturally occurring resistance to oseltamivir was found only in seasonal H1N1 viruses isolated before October 2009 [8], and almost all influenza A viruses had mutations associated with adamantane resistance.
The objective of the current analysis was to use the large IRIS database to examine the natural history of influenza B virus infections in more detail, and to compare the baseline characteristics, antiviral susceptibility, disease course, and clinical outcomes of infections caused by B/Victoria and B/Yamagata viruses. Clinical and virology results from the first 5 years of IRIS are presented.
METHODS
The study conduct of IRIS (NCT00884117), including patient selection, assessments, and virology testing, have been described previously [8]. In summary, adults and children aged ≥1 year were enrolled at primary care centers and hospitals if they were influenza-positive by rapid test at presentation and/or had clinical signs and symptoms of influenza that had lasted ≤48 hours (≤96 hours for hospitalized adults; no time limit for hospitalized children). The study was noninterventional: clinical management and antiviral treatment were at the discretion of the investigator. Patients were evaluated on day 1 (baseline), day 6, and day 10. Scores for 7 influenza signs and symptoms (fever, sore throat, nasal congestion, cough, myalgia, fatigue, and headache) were recorded daily by patients on diary cards from days 1–12, each scored on a 4-point scale: 0 (absent), 1 (mild), 2 (moderate), or 3 (severe). These were summed to produce a total symptom score (possible range, 0–21). Symptoms were also assessed by the investigator using the same scale. Temperature (oral or tympanic) was recorded daily on the diary card. The study was performed in compliance with the principles of the Declaration of Helsinki and its amendments and in accordance with International Conference on Harmonisation Good Clinical Practice guidelines. The study protocol was approved by appropriate independent Ethics Committees, and all patients or their legal guardians gave written informed consent before participating.
Nasal or throat swabs were obtained at each visit and patients performed a self-swab on day 3. Viral load was determined using real-time reverse transcriptase polymerase chain reactions (RT-PCRs) for the matrix genes of influenza B viruses. Qualitative real-time RT-PCRs were used to identify influenza type and subtype. All day 1, 6, and 10 samples with a PCR cycle threshold value of <32 were cultured on Madin-Darby canine kidney cells and tested for phenotypic susceptibility using a chemiluminescence assay (NA-Star); the reference viruses in this assay were influenza A/PR/8/34 and influenza B/Lee/40. Susceptibility to oseltamivir carboxylate (OC) and zanamivir was expressed as the concentration required for 50% inhibition of neuraminidase (NA) activity (IC50). Genotyping of the cultured samples was done by Sanger sequencing of the HA and NA genes. In year 5 only, mutation-specific RT-PCR of uncultured samples was also performed for influenza B viruses (R150K, D197N, and N294S mutations).
Current Analysis and Statistical Methods
The lineage of all influenza B samples from patients enrolled during years 1 to 5 of IRIS (from January 2009 to March 2013) was determined by aligning their HA sequences with the reference strain B/Brisbane/60/2008e for B/Victoria and strain B/Managua/3759.01/2008 for B/Yamagata. Clinical and virological data were analyzed separately for the B/Victoria and B/Yamagata virus lineages.
The mean IC50 was calculated for all samples tested, then recalculated after excluding extreme outlier values (IC50 values >10-fold or <0.1-fold the day 1 mean). All calculations were done using actual IC50 test values. To determine whether variability in the assay conditions over the study period affected the results, a linear model was used to normalize the IC50 test values, correcting for the reference IC50 values from the same assay.
All NA and HA sequences from cultured influenza B viruses were compared with those from a reference virus (B/Brisbane/60/2008e) and analyzed for 15 prospectively defined substitutions that are associated with reduced susceptibility (Table 1). Sequences of postbaseline samples that were mild IC50 outliers were compared with the patient's day 1 sample to detect any amino acid changes. Continuous variables were summarized by number, mean, standard deviation (SD), median, and range, and categorical data summarized by number and percentage. Kaplan–Meier plots were generated for time-to-viral RNA clearance (time from onset of symptoms to the first RT-PCR-negative sample), time to resolution of diary card symptoms (time from symptom onset to first day when all symptom scores were ≤1), and time to resolution of fever (time from symptom onset to resolution of fever [<38.0°C for children and adults; <37.5°C for adults aged >65 years]). Wilcoxon tests were used to compare differences in outcomes between B/Victoria and B/Yamagata viruses. These analyses were done separately for adults and adolescents (aged ≥13 years) and children (aged 1–5 and 6–12 years).
Prospectively Defined Resistance Mutations Associated With Reduced Sensitivity to Neuraminidase Inhibition
| Neuraminidase Mutation | References | |
|---|---|---|
| N2 Numbering | Influenza B Numbering | |
| E105K | E105K | [9] |
| E119A | E117A | [10] |
| E119D | E117A | [10] |
| E119G | E117G | [10, 11] |
| E119V | E117V | [10] |
| R152K | R150K | [10, 11] |
| D198E | D197E | [10, 11] |
| D198N | D197N | [10–12] |
| I222Ta | I221Ta | [12–14] |
| I222Va | I221Va | [15, 16] |
| H274Y | H273Y | [4, 9] |
| R292K | R292K | [10] |
| N294S | N294S | [17] |
| R371K | R374K | [4] |
| G402S | G407S | [13] |
Abbreviation: IRIS, Influenza Resistance Information Study.
a Detected in 1 patient each in the IRIS.
RESULTS
Patient Characteristics at Baseline
Between 2009 and 2013, 3230 influenza-positive (RT-PCR) patients were enrolled in IRIS (excluding 21 patients with mixed influenza A and B infections). Of these, 914 (28.3%) had influenza B infections determined by RT-PCR: of the infecting viruses, 586 were B/Victoria-like and 289 were B/Yamagata-like. For the remaining 39 patients, the lineage could not be determined because HA sequences could not be obtained. The prevalence of the 2 lineages changed over time: in years 1–3, 459 of 518 patients (89%) with influenza B were infected with B/Victoria-like viruses but only 37 (7%) were infected with B/Yamagata-like viruses, whereas in year 5, 190 of 217 influenza B patients (88%) had B/Yamagata-like viruses and only 17 (8%) had B/Victoria-like viruses. Influenza B infections were more common in children during the study period; they occurred in 531 of 1644 influenza-positive children (32.3%) and in 383 of 1586 of influenza-positive adults and adolescents (24.1%). The mean age of adults in the B/Yamagata group (37.4 years) was approximately 9 years higher than that of adults in the B/Victoria group (28.2 years). Baseline characteristics of the 914 patients are shown in Table 2.
Clinical and Demographic Characteristics of Adults and Adolescents (Aged ≥13 Years) and Children (Aged 1–12 Years) With Laboratory-Confirmed Influenza B (by RT-PCR) at Baseline (Day 1)
| Parameter | B/Victoria (n = 586) | B/Yamagata (n = 289) | Lineage not Determined (n = 39) | |||
|---|---|---|---|---|---|---|
| Adults and Adolescents (n = 231) | Children (n = 355) | Adults and Adolescents (n = 130) | Children (n = 159) | Adults and Adolescents (n = 22) | Children (n = 17) | |
| Mean age, y (SD) | 28.2 (14.9) | 6.8 (3.0) | 37.4 (18.0) | 6.5 (3.0) | 40.1 (23.4) | 5.5 (3.7) |
| Males, n (%) | 96 (42) | 184 (52) | 64 (49) | 88 (55) | 16 (73) | 8 (47) |
| Mean time from symptom onset to study baseline, days (SD) | 1.4 (0.7) | 1.3 (0.8) | 1.4 (0.6) | 1.1 (0.6) | 1.6 (1.0) | 1.2 (0.6) |
| Previous or existing illnesses, n (%) | ||||||
| Cardiovascular | 15 (7) | 1 (0) | 16 (12) | 1 (1) | 6 (27) | 0 |
| Respiratory | 28 (12) | 50 (14) | 20 (15) | 25 (16) | 4 (18) | 3 (18) |
| Diabetes | 4 (2) | 0 | 5 (4) | 0 | 3 (14) | 0 |
| Recent RTI | 32 (14) | 64 (18) | 16 (12) | 42 (26) | 1 (5) | 6 (35) |
| Mean body mass index, kg/m2 (SD) | 24.2 (6.1) | 17.2 (3.6) | 24.9 (5.6) | 16.9 (3.1) | 24.7 (4.3) | 16.8 (4.1) |
| Vaccinated in previous 4 mo, n (%) | 12 (5) | 20 (6) | 4 (3) | 17 (11) | 2 (9) | 1 (6) |
| Febrile, n (%)a | 118 (51) | 225 (63) | 61 (47) | 88 (55) | 5 (23) | 6 (35) |
| Hospitalized at enrollment, n (%) | 6 (3) | 15 (4) | 12 (9) | 4 (3) | 6 (27) | 2 (12) |
| Country/region of enrollment, n (%) | ||||||
| United States | 64 (28) | 103 (29) | 37 (29) | 51 (32) | 8 (36) | 4 (24) |
| Europe | 99 (43) | 164 (46) | 47 (36) | 71 (45) | 7 (32) | 8 (47) |
| China | 47 (20) | 80 (23) | 45 (34) | 37 (23) | 7 (32) | 4 (24) |
| Australia | 21 (9) | 8 (2) | 1 (1) | 0 | 0 | 1 (6) |
| Intervention, n (%) | ||||||
| Oseltamivir (started at any time) | 115 (50) | 175 (49) | 78 (60) | 75 (47) | 14 (64) | 3 (18) |
| Other influenza antiviral | 7 (3) | 6 (2) | 1 (1) | 0 | 0 | 0 |
| No influenza antiviral | 109 (47) | 174 (49) | 51 (39) | 84 (53) | 8 (36) | 14 (82) |
Abbreviations: RTI, respiratory tract infection; RT-PCR, reverse transcriptase polymerase chain reaction; SD, standard deviation.
a Temperature ≥38°C for children and adults and adolescents, and ≥37.5°C for adults aged ≥65 years.
A total of 474 (52%) influenza B patients received antiviral treatment: 426 (47%) started oseltamivir monotherapy within 2 days of onset of symptoms and a further 34 started oseltamivir 2 or more days after symptom onset. Twelve patients received zanamivir monotherapy, 1 received amantadine, and 1 received rimantadine. A total of 440 patients (48%) did not receive any influenza antiviral.
Geographic Distribution of Patients
Eighty-seven centers contributed influenza A and B patients during years 1 to 5 of the study, from Australia, China, Europe (France, Germany, Poland, and Norway), and the United States. The ratio of type A to type B infections was similar across regions (approximately 2.5 to 1). The regional distribution of patients by influenza B lineage was very similar for children. For adults and adolescents, however, the number of B/Victoria group patients in Europe was twice the Asian total, whereas the number of B/Yamagata patients in these 2 regions were similar (see Table 2).
Antiviral Susceptibility: Phenotyping
Phenotyping results were obtained for 1048 samples from 882 patients with influenza B infections; for the remaining 32 patients, no phenotyping results could be obtained. Mean and median values for each test day are shown in Table 3; the 2 lineages showed similar susceptibility to NAI at baseline. All samples from all visits (days 1, 6, and 10) were susceptible to NAIs, with no samples classed as extreme outliers with reduced inhibition (IC50 values >10-fold the day 1 mean). Nineteen of 1048 samples (1.8%) were mild outliers (IC50 > [third quartile + 3× interquartile range]) to 1 or both NAIs (Table 4). The IC50 values of all mild outlier samples (in B/Victoria and B/Yamagata groups) were only moderately raised, being <5-fold higher than the day 1 mean IC50 for the respective lineage. Four mild outlier samples were from day 6 or day 10: these had IC50 values that were 1.3-fold to 4.8-fold higher than the corresponding day 1 sample for that patient. Of these 4 samples, 2 showed amino acid changes from the day 1 sequence (both B/Victoria-like viruses): from 119I to 119V in HA in a day 6 sample from a year 3 patient, and from 56N to 56N/T in NA in the day 10 sample of a year 4 patient. The other 2 samples had no sequence changes at any amino acid positions in NA or HA. Assay variability had no significant effect on the results.
Sensitivity to Neuraminidase Inhibition of All Virus Samples After Excluding Extreme Outliersa
| N | IC50 (nM)b | ||||
|---|---|---|---|---|---|
| Mean | SD | Median | Range | ||
| Oseltamivir carboxylate | |||||
| B/Victoria | |||||
| Day 1 | 583 | 4.7 | 2.5 | 4.3 | 0.48–18 |
| Day 6 | 97 | 5.5 | 2.7 | 4.9 | 1.4–14 |
| Day 10 | 15 | 5.8 | 2.1 | 6.2 | 2.0–9.3 |
| B/Yamagata | |||||
| Day 1 | 288 | 4.4 | 2.7 | 4.2 | 0.67–21 |
| Day 6 | 46 | 4.5 | 2.3 | 3.9 | 1.2–13 |
| Day 10 | 11 | 2.9 | 1.5 | 2.5 | 1.5–6.5 |
| Unsubtyped influenza B | |||||
| Day 1 | 7 | 4.0 | 2.2 | 4.2 | 1.4–7.6 |
| Day 6 | 0 | … | … | … | … |
| Day 10 | 0 | … | … | … | … |
| Zanamivir | |||||
| B/Victoria | |||||
| Day 1 | 565 | 1.9 | 1.4 | 1.6 | 0.19–8.6 |
| Day 6 | 96 | 2.3 | 1.5 | 2.0 | 0.20–8.8 |
| Day 10 | 15 | 2.6 | 1.7 | 2.1 | 0.88–7.1 |
| B/Yamagata | |||||
| Day 1 | 287 | 3.2 | 1.5 | 2.9 | 0.35–8.6 |
| Day 6 | 46 | 3.6 | 1.8 | 3.1 | 0.92–12 |
| Day 10 | 11 | 3.3 | 1.4 | 3.0 | 0.97–5.2 |
| Unsubtyped influenza B | |||||
| Day 1 | 7 | 3.0 | 1.3 | 2.9 | 0.66–4.7 |
| Day 6 | 0 | … | … | … | … |
| Day 10 | 0 | … | … | … | … |
Abbreviations: IC50, concentration required for 50% inhibition of neuraminidase activity; SD, standard deviation.
a The only extreme outlier samples excluded were those with markedly increased susceptibility (IC50 <0.1-fold the day 1 mean value).
b IC50 data shown are actual test values (not corrected for reference sample value).
Phenotypic Mild Outliersa by Influenza B Lineage
| Outliers (n, %) and Range of IC50 Values (nM) | |||
|---|---|---|---|
| OC Only | Zanamivir Only | Both NAIs | |
| Day 1 | |||
| B/Victoria (n = 584) | 3 (0.5%) (14–18nM) | 8 (1.4%) (6.9–8.6nM) | 0 |
| B/Yamagata (n = 288) | 3 (1.0%) (17–21nM) | 1 (0.3%) (8.6nM) | 0 |
| Day 6 | |||
| B/Victoria (n = 97) | 0 | 1 (1.0%) (8.8nM) | 1 (1.0%) (14nM, OC; 7.8nM, zanamivir) |
| B/Yamagata (n = 46) | 0 | 1 (2.2%) (12nM) | 0 |
| Day 10 | |||
| B/Victoria (n = 15) | 0 | 1 (6.7%) (7.1nM) | 0 |
| B/Yamagata (n = 11) | 0 | 0 | 0 |
Abbreviations: IC50, concentration required for 50% inhibition of neuraminidase activity; NAI, neuraminidase inhibitor; OC, oseltamivir carboxylate.
a IC50 > (third quartile + [3 × interquartile range]).
Antiviral Susceptibility: Genotyping
Two prospectively defined resistance mutations were detected by NA population sequencing in day 1 samples of 2 patients, neither of whom received influenza antiviral treatment. I221V was detected in a sample from a 24-year-old woman infected with a B/Victoria-like virus who was enrolled in the United States on 7 January 2011, and I221T was detected in a sample of a 4-year-old boy infected with a B/Yamagata-like virus who was enrolled in Poland on 15 February 2013. The I221V sample was phenotypically susceptible to both NAIs (IC50s of 9.7 nM to OC and 2.6 nM to zanamivir) and the I221T sample was a mild outlier to OC (IC50, 21 nM) and phenotypically susceptible to zanamivir (6.8 nM). No other samples from these patients were sequenced. None of the other 13 prospectively defined NAI resistance mutations were detected by sequencing in any influenza B viruses.
Viral Clearance
On day 1, mean viral load was significantly higher in patients infected with B/Yamagata-like viruses than with B/Victoria-like viruses for all 3 age groups. Mean values and SDs (log10 viral particles per mL) were 6.38 (0.85) and 5.94 (0.92; P < .0001) in adults and adolescents, 6.46 (0.92) and 6.05 (0.92; P < .001) in children aged 6–12 years, and 6.37 (0.94) and 5.83 (0.86; P < .0001) in children aged 1–5 years, respectively. In Kaplan–Meier analysis of adults and adolescents (whether or not treated with antivirals), the median time to viral clearance was 7.8 days in both the B/Victoria group (n = 231) and the B/Yamagata group (n = 130), with no significant difference between lineages (P = .67, Wilcoxon test; Figure 1A). Both subgroups of children showed slower viral clearance than in adults; in children aged 6–12 years, the median times to viral clearance were 10.0 and 8.9 days for the B/Victoria (n = 235) and B/Yamagata groups (n = 93), respectively (P = .072, Wilcoxon test), and in children aged 1–5 years, the median times were 9.9 days (n = 119) and 10.9 days (n = 66), respectively (P = .095, Wilcoxon test). The difference between lineages was not significant for either age group (Figure 1B and 1C).
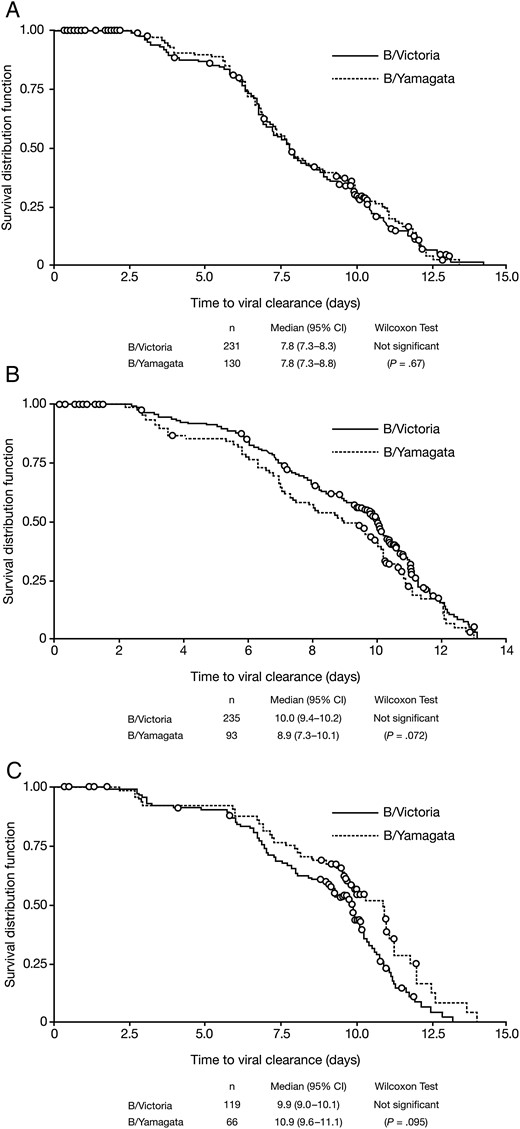
Kaplan–Meier analysis of time from symptom onset to viral clearance (no longer detectable by RT-PCR) in patients with influenza B infections, comparing by lineage. A, Adults and adolescents. B, Children aged 6–12 years. C, Children aged 1–5 years. Abbreviations: CI, confidence interval; RT-PCR, reverse transcriptase polymerase chain reaction.
Exploratory post-hoc Kaplan–Meier analysis of time to nondetection of viral RNA showed a difference between patients treated with oseltamivir and untreated patients, in both the B/Victoria and B/Yamagata groups (see Supplementary Table 1). The clinical relevance of this result is unclear, as treatment allocation in IRIS was not randomized and the study was not designed to assess antiviral efficacy.
Fever and Symptom Scores
There was no significant difference between the 2 virus lineages in the time to fever resolution in any age group; median times were 4 days in adults and adolescents and 5 days in children aged 6–12 years (Figure 2A and 2B). In children aged 1–5 years, the median time to fever resolution was 1 day shorter in the B/Victoria group (5.5 days) than the B/Yamagata group (6.5 days), a difference that approached marginal statistical significance (P = .061) (Figure 2C).
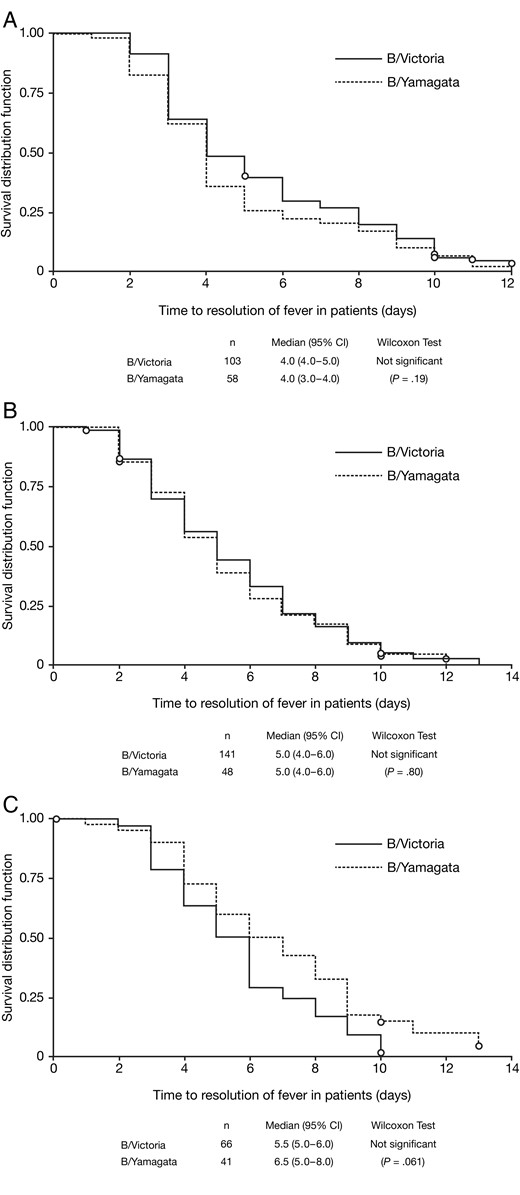
Kaplan–Meier analysis of time from symptom onset to resolution of fever (<38°C for children, adolescents and adults; <37.5°C for adults aged ≥65 years) in patients with influenza B infections, comparing by lineage. A, Adults and adolescents. B, Children aged 6–12 years. C, Children aged 1–5 years. Abbreviation: CI, confidence interval.
Symptoms were mild to moderate on day 1: mean total scores, as assessed by investigators, were 13.5 (SD, 3.8) for B/Victoria group patients and 13.2 (SD, 4.4) for B/Yamagata group patients. Mean body temperatures on day 1 were 38.2°C (SD, 0.8°C) for the B/Victoria group and 38.1°C (SD, 0.9°C) for the B/Yamagata group.
In adults and adolescents, the median duration of symptoms was 7 days for both B/Victoria (n = 216) and B/Yamagata groups (n = 120; P = .21) (Figure 3A), and in children aged 6–12 years, it was 6 days for both B/Victoria (n = 226) and B/Yamagata groups (n = 89; P = .25) (Figure 3B). In children aged 1–5 years, however, median symptom duration was significantly shorter in the B/Yamagata group (5 days; n = 61) than in the B/Victoria group (6 days; n = 113; P = .046, Wilcoxon test) (Figure 3C).
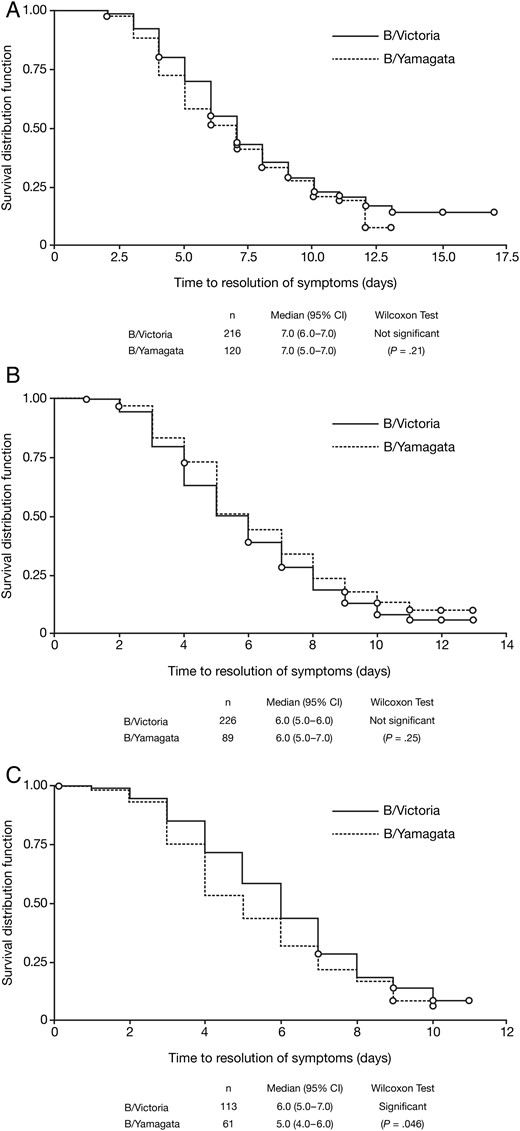
Kaplan–Meier analysis of time from symptom onset to symptom resolution (first day when all individual symptom scores were ≤1) in patients with influenza B infections, comparing by lineage. A, Adults and adolescents. B, Children aged 6–12 years. C, Children aged 1–5 years. Abbreviation: CI, confidence interval.
Exploratory post-hoc Kaplan–Meier analyses of time to resolution of fever and symptoms showed a difference between patients treated with oseltamivir and untreated patients, for all influenza B patients and for the B/Victoria group, but not for the B/Yamagata group (see Supplementary Table 1). This post-hoc analysis should be interpreted with caution, as treatment allocation in IRIS was not randomized and the study was not designed to assess antiviral efficacy. Moreover, analyses of symptom resolution by lineage or treatment are potentially confounded because symptoms were scored more conservatively by patients in Asia than in other regions (data not shown).
DISCUSSION
Analysis of influenza B viruses from over 900 patients enrolled in IRIS between 2009 and 2013 showed that all B/Victoria-like and B/Yamagata-like viruses tested were phenotypically susceptible to oseltamivir and zanamivir. The sample of patients analyzed was geographically heterogeneous, with enrollment covering 4 separate continents (Asia, Australasia, Europe, and North America).
Of 15 NA sequence mutations previously associated with antiviral resistance in influenza B viruses, analysis of IRIS samples detected only 2, both in baseline samples from patients who did not receive any influenza antiviral. The I222V mutation was detected in a patient infected with a B/Victoria-like virus enrolled in Tennessee in January 2011. Although the presence of this mutation did not affect sensitivity of the virus to neuraminidase inhibition (susceptibility 2.1-fold higher for OC and 1.4-fold higher for zanamivir than the mean of all day 1 samples in the B/Victoria group), Garg et al [15] reported a cluster of B/Victoria-like viruses with the I222V mutation in North Carolina and South Carolina in 2010–2011 that had reduced susceptibility to OC, with significantly prolonged time to illness resolution (relative to patients infected with wild-type influenza B virus) after treatment with oseltamivir. The second mutation, I221T, was detected in a patient infected with a B/Yamagata-like virus who was enrolled in Poland in February 2013; this was associated with a moderate decrease in sensitivity to OC (4.8-fold higher than the mean of all day 1 samples in the B/Yamagata group), although the sample had normal sensitivity to zanamivir. This mutation also caused moderate decreases in sensitivity to OC in influenza B viruses found by surveillance in Japan, China, and the United States [12–14]. No other samples from these patients were sequenced. None of the other 13 resistance mutations were detected at baseline or during treatment.
With respect to disease course, we found that mean viral loads on day 1 across all ages were significantly higher in the B/Yamagata group than in the B/Victoria group, by up to approximately 0.5 log10 viral particles per mL. Two other recent studies failed to find differences in clinical presentation between the 2 lineages, although viral load measurements were not reported [18, 19]. According to Kaplan–Meier analysis, virus lineage had little or no effect on the disease course in the age groups we analyzed (whether treated with influenza antivirals or not); no significant differences were found in the time taken to clear virus or the time for fever to resolve. In the younger children, alleviation of symptoms was significantly shorter in the B/Yamagata group than the B/Victoria group, although paradoxically, fever took a mean of 1 day longer to resolve in the B/Yamagata group. No difference in symptom alleviation time between the virus lineages was seen in the older children or in adults and adolescents. Exploratory post-hoc analyses of viral clearance and fever and symptom resolution showed differences between oseltamivir-treated and untreated patients, for all influenza B patients and for the B/Victoria group; in the B/Yamagata group, a treatment difference was seen for viral clearance only. Interpretation of differences in outcomes between treated and untreated patients in IRIS is complicated by selection biases resulting from the study design. The study was not intended to assess antiviral efficacy; in addition, patient allocation is nonrandomized, and decisions about whether and how to treat patients are left to the study investigator, so decisions could potentially be influenced by patient characteristics such as symptom severity, age, and previous medical history. It should also be noted that analyses of symptom resolution, whether by virus lineage or treatment status, could potentially be confounded by regional differences in the way diary card symptoms were scored by patients in IRIS, with typically lower scores in China than in other regions. For influenza B patients, the difference in geographical distribution of adult patients by lineage is an additional confounding factor.
A notable difference between the 2 groups of patients was that B/Yamagata-like viruses appeared to cause infections in an older group of adults than B/Victoria-like viruses; for patients aged 13 years and older, the mean ages of the 2 groups were 28.2 and 37.4 years, respectively. The reason for this is not related to changes in the demographics of the IRIS population over time—although B/Yamagata-like viruses were very uncommon relative to B/Victoria-like viruses during the first 3 years of the study, the age distribution of patients in IRIS in those years was very similar to that in years 4 and 5. Two other studies, however, in 182 hospitalized patients in Guangzhou, China, during 2009–2010 and 637 patients in Slovenia over 3 influenza seasons from 2010–2011 to 2012–2013, have reported a similar effect [18, 19]. In the Slovenian example, infections with B/Victoria-like viruses were more than 5 times as common as those with B/Yamagata-like viruses in adults and adolescents aged 15–34 years [18].
In-depth analysis of influenza A data from years 1–5 of IRIS is ongoing; however, initial comparisons suggest that disease symptoms resulting from influenza B infections are at least as severe as for influenza A infections (H1N1 seasonal, H1N1pdm2009, and H3N2), and global symptom scores as assessed by the physician for the 2 influenza B lineages were similar to influenza A/H3N2 and slightly higher than influenza A/H1N1 (seasonal or H1N1pdm2009; data not shown). Viral loads were also similar, or slightly higher, among adults and children infected with influenza B compared with influenza A. For both parameters, patients infected with H1N1pdm2009 viruses had the lowest values in comparison with those infected with B/Victoria-like and B/Yamagata-like viruses.
A key attribute of this dataset is its diversity, with patients being enrolled across a broad geographic area and over 5 years (9 separate influenza seasons—5 in the Northern Hemisphere and 4 in the Southern Hemisphere). This compensated for the marked variation in virus prevalence by geography and season during the period of our analysis (January 2009 to March 2013); for example, the very low prevalence of influenza B viruses during the 2009–2010 A/H1N1 pandemic and the large swings in the relative abundance of B/Victoria-like and B/Yamagata-like viruses in the United States and Europe [20]. Combined with the detailed information collected on clinical characteristics and disease course, the extensive virological data from swabs taken at several time points allowed associations between virus biology and clinical outcomes to be evaluated.
From analysis of this comprehensive dataset, we conclude that influenza B viruses of both lineages were phenotypically sensitive to NAIs, with a very low incidence of naturally occurring resistance-associated mutations and no treatment-emergent resistance. In addition, despite a difference in baseline viral load between the 2 virus lineages, the duration of viral positivity and influenza symptoms was very similar.
Notes
Acknowledgments. The authors would like to acknowledge the support of all the Influenza Resistance Information Study investigators and patients, and the clinical study management team at Roche and Micron Research.
Financial support. This work was supported by funding from F. Hoffmann-La Roche Ltd. Third-party medical writing assistance was provided by Roger Nutter and Lucy Carrier of Gardiner-Caldwell Communications, and was funded by F. Hoffmann-La Roche Ltd.
Potential conflicts of interest. D. K. M. I. received research funding from F. Hoffmann-La Roche Ltd; B. J. C. received research funding from MedImmune Inc. and Sanofi Pasteur, and consulted for Crucell NV; J. D. Z. is a current Roche employee; X. T. is a former Roche employee; M. S. is employed at Viroclinics Biosciences B. V. and has had both paid and unpaid consultancies with Genentech, Medivector, Qiagen and Hologic; C. A. B.'s institute (Erasmus Medical Center) received a research grant from Roche. All other authors report no potential conflicts. All authors have submitted the ICMJE Form for Disclosure of Potential Conflicts of Interest. Conflicts that the editors consider relevant to the content of the manuscript have been disclosed.
References
Author notes
Presented in part: 52nd Interscience Conference on Antimicrobial Agents and Chemotherapy (ICAAC) Meeting, San Francisco, California, 9–12 September 2012. Abstract V-1080; reported in the paper by Whitley RJ et al (Clin Infect Dis. 2013; 56:1197–205).
Present affiliations: Research Center for Emerging Infections and Zoonoses (RIZ), University of Veterinary Medicine, Hannover, Germany (E. v. d. V.); InnovaTID Pharmaceuticals Inc, Cambridge, Massachusetts (X. T.); AstraZeneca Pharma Poland Sp z o.o., Warsaw, Poland (K. W.).

