


Abstract
Background. The predominant strain during the 2013–2014 influenza season was 2009 pandemic influenza A(H1N1) virus (A[H1N1]pdm09). This vaccine-component has remained unchanged from 2009.
Methods. The US Flu Vaccine Effectiveness Network enrolled subjects aged ≥6 months with medically attended acute respiratory illness (MAARI), including cough, with illness onset ≤7 days before enrollment. Influenza was confirmed by reverse-transcription polymerase chain reaction (RT-PCR). We determined the effectiveness of trivalent or quadrivalent inactivated influenza vaccine (IIV) among subjects ages ≥6 months and the effectiveness of quadrivalent live attenuated influenza vaccine (LAIV4) among children aged 2–17 years, using a test-negative design. The effect of prior receipt of any A(H1N1)pdm09-containing vaccine since 2009 on the effectiveness of current-season vaccine was assessed.
Results. We enrolled 5999 subjects; 5637 (94%) were analyzed; 18% had RT-PCR–confirmed A(H1N1)pdm09-related MAARI. Overall, the effectiveness of vaccine against A(H1N1)pdm09-related MAARI was 54% (95% confidence interval [CI], 46%–61%). Among fully vaccinated children aged 2–17 years, the effectiveness of LAIV4 was 17% (95% CI, −39% to 51%) and the effectiveness of IIV was 60% (95% CI, 36%–74%). Subjects aged ≥9 years showed significant residual protection of any prior A(H1N1)pdm09-containing vaccine dose(s) received since 2009, as did children <9 years old considered fully vaccinated by prior season.
Conclusions. During 2013–2014, IIV was significantly effective against A(H1N1)pdm09. Lack of LAIV4 effectiveness in children highlights the importance of continued annual monitoring of effectiveness of influenza vaccines in the United States.
After emerging in spring 2009 and undergoing intense transmission during fall 2009, 2009 pandemic influenza A(H1N1) virus (A[H1N1]pdm09) has had more-limited circulation subsequently in the United States [1–4]. As a result, there have been few opportunities to evaluate influenza vaccine effectiveness (VE) against A(H1N1)pdm09-related medically attended acute respiratory illness. During 2013–2014, A(H1N1)pdm09 reemerged as the predominant seasonal virus [5]. Unlike in the 2009 pandemic, the burden of severe illness and hospitalization shifted to individuals aged ≥50 years, with excess attributable pneumonia and influenza mortality occurring for 8 weeks [5].
Since 2010, the Advisory Committee on Immunization Practices (ACIP) of the Centers for Disease Control and Prevention (CDC) has recommended annual influenza vaccination for persons aged ≥6 months; both inactivated (IIV) and live-attenuated (LAIV) influenza vaccines are licensed [6]. Interim data from the US Flu VE Network indicated a moderate VE against A(H1N1)pdm09-related MAARI of 62% (95% confidence interval [CI], 52%–68%) for any influenza vaccination but did not estimate VE by vaccine type [7]. In this final 2013–2014 season report, we examine VE against A(H1N1)pdm09-related MAARI for laboratory-confirmed influenza by age-group, receipt of influenza vaccination against A(H1N1)pdm09 during any season since 2009, and vaccine type. This is the first season for direct comparison of VE against A(H1N1)pdm09 by vaccine type in children since the 2009 pandemic.
METHODS
Subject Enrollment and Characteristics
The current US Flu VE Network has enrolled subjects in Pennsylvania, Michigan, Texas, Wisconsin, and Washington since 2011–2012. Details of the sites and enrollment and laboratory methods have been described previously [8–9]. Briefly, after local influenza circulation was detected in 2013–2014, study personnel at each site screened and enrolled subjects with MAARI, including cough, and onset of illness ≤7 days before enrollment; eligible subjects were born before 1 March 2013 and, based on age, were eligible for vaccination by 1 September 2013. Subjects who received antiviral medication for influenza in the previous 7 days or who were enrolled in the previous 14 days were ineligible. After we obtained informed consent from patients or parents/guardians (children provided assent when applicable), participants were interviewed to collect data on demographic characteristics, general and current health status, symptoms, and vaccination status. The presence of a high-risk condition was defined as a healthcare encounter resulting in specified International Classification of Diseases, 9th Edition, Clinical Modification, codes during the year before enrollment [6].
2013–2014 Influenza Vaccine and Documented Influenza Vaccination
Recommended reference viruses for 2013–2014 northern hemisphere vaccines were A/California/7/2009(H1N1), A/Texas/50/2012(H3N2) (A/Victoria/361/2011-like), and B/Massachusetts/2/2012 (B/Yamagata lineage); quadrivalent vaccines also contained B/Brisbane/60/2008 (B/Victoria lineage) [4]. Current-season vaccination was self-reported or reported by the parent or guardian and was documented by review of electronic medical or employee health records or state immunization registries, collectively termed “electronic immunization records” (EIR). Influenza vaccine type, including trivalent/quadrivalent inactivated (IIV3/IIV4) and quadrivalent live-attenuated (LAIV4) vaccines, was derived from the lot number, name of the vaccine/manufacturer, and route of administration. Information about receipt of vaccines from past seasons (up to 4 seasonal and 2 A(H1N1)pdm09 monovalent vaccine doses) was obtained from the EIR.
Laboratory Methods
Combined nose and throat swab specimens (nose swab specimen were only obtained from children aged <2 years) were tested by reverse-transcription polymerase chain reaction (RT‐PCR) for identification of influenza virus in US Flu VE Network laboratories [8]. Viruses isolated from a sample of specimens testing positive for A(H1N1)pdm09 by RT‐PCR were antigenically characterized by hemagglutination inhibition with a set of reference ferret antisera obtained after infection. Antigenic similarity was assessed relative to the reference virus A/California/7/2009(H1N1) [5]. Each site's influenza outbreak period was defined as the week of illness onset for the first RT-PCR–positive case through the week of 8 days past illness onset for the last PCR-positive case.
Estimation of A(H1N1)pdm09 and Any Influenza VE
We used the test-negative design to estimate VE by comparing influenza vaccination status among influenza RT-PCR–positive subjects (cases) and influenza virus–negative subjects (controls) [10–11]. All subjects with EIR-documented 2013–2014 influenza vaccination ≥14 days prior to illness onset were considered vaccinated. For 3 sites (Michigan, Pennsylvania, and Texas), subjects without EIR-documented vaccination were considered vaccinated if they reported vaccine receipt from an off-site provider at a location where vaccination records were not available (termed “plausible report of vaccination”). At the Washington site, subjects who reported vaccination ≥14 days before illness onset were considered vaccinated. For the Wisconsin site, only subjects with EIR-documented vaccination were considered vaccinated [12]. All other subjects were considered unvaccinated. Subjects vaccinated <14 days before illness onset and children aged <9 years considered partially vaccinated per 2013–2014 ACIP criteria [6] were excluded from the main analysis. We also excluded subjects with inconclusive RT-PCR results and controls with illness onset dates outside each site's influenza outbreak period. The primary analysis estimated VE against RT-PCR–confirmed A(H1N1)pdm09-related MAARI for all 2013–2014 influenza vaccines in subjects aged ≥6 months during the influenza A and B virus infection outbreak period.
Statistical Analyses
We compared the descriptive characteristics of influenza cases versus those of controls and the characteristics of vaccinated subjects versus those of unvaccinated subjects, using the χ2 test for categorical variables and the Wilcoxon–Mann–Whitney test for continuous variables. VE was estimated by comparing odds of vaccination for influenza cases versus controls and calculated as 100 × [1 − odds ratio] in logistic regression models. A parsimonious method for model selection was developed for analyzing VE during influenza seasons. In a parsimony-adjusted model, we adjusted for age and site a priori and for variables that changed the unadjusted VE by ≥3%, using a forward selection procedure, including calendar time, modeled as a categorical variable representing biweekly intervals, and the presence of any high-risk medical condition [9, 13]. For comparison with previous VE estimates [8, 9], we present comparison-adjusted VE from models that additionally included sex, race/ethnicity, general health status, and interval from illness onset to enrollment. Interaction terms such as vaccination status and presence of high-risk condition/s were not included because the model fit was worse and VE estimates did not change.
We estimated VE against any influenza virus and by virus subtypes for all ages (≥6 months) and against A (A[H1N1]pdm09) or any influenza virus in age-stratified models. In all-ages VE models, we modeled age in years as linear tail-restricted cubic-spline functions with 5 percentile knots (ie, 20th, 40th, 60th, 80th, and 90th percentiles) [9–10]. Similarly, for age-stratified models, we modeled age in months as cubic-spline functions to estimate VE for ages 6 months–8 years, 9–17 years, 18–49 years, 50–64 years, and ≥65 years.
To assess the effect of prior-season vaccination on VE against A(H1N1)pdm09-related MAARI during 2013–2014, we restricted analysis to patients with medical records available for the previous 2 or 5 years (or since the year of birth, for children <5 years old). The A(H1N1)pdm09 vaccine component has not changed since its introduction in the 2009 monovalent vaccines. Subjects never vaccinated against A(H1N1)pdm09 formed the control group. For children aged 2–8 years who were either fully or partially vaccinated per 2013–2014 ACIP definition [6], we assessed the effect of prior-season or any A(H1N1)pdm09-containing vaccine on VE against A(H1N1)pdm09-related MAARI, by 2013–2014 vaccine type. Children who had received 2 doses of A(H1N1)pdm09-containing vaccine in a single season or separate seasons were considered fully vaccinated. We estimated VE for children vaccinated in 2012–2013 and 2013–2014 or only 1 season. Additionally, we estimated residual VE for children fully vaccinated with the prior-season (ie, 2012–2013) vaccine but unvaccinated in 2013–2014, using the same reference group.
For subjects aged ≥9 years, we used a logistic regression model to examine a potential effect modification from previous season vaccination. This model included main effects of EIR-documented receipt of IIV in 2013–2014 and 2012–2013 and an interaction term of the 2 main effects. This analysis was limited to subjects who reported receiving routine health care from respective site medical systems for at least 2 years. We estimated VE for subjects vaccinated in 2012–2013 and 2013–2014 or in only one of the 2 seasons, with subjects unvaccinated during both seasons serving as the reference group. We also assessed potential effect modification of current-season IIV VE against A(H1N1)pdm09-related MAARI by receipt of any A(H1N1)pdm09-containing vaccine dose during the prior 4 seasons.
Plausible reports of vaccination were included in VE estimates for any vaccination among all subjects and for VE estimates by vaccine type only among adults. We performed sensitivity analyses by excluding subjects with plausible report of vaccination and by considering those vaccinated with EIR-documented doses only or with self-reported doses only. We also estimated VE among subjects enrolled 0–3 versus 4–7 days after illness onset. Calculation of the VE against A(H1N1)pdm09-related MAARI for all influenza vaccines and by vaccine type was limited for the sensitivity analysis to the A(H1N1)pdm09 outbreak period for each site, rather than the influenza A and B virus infection outbreak period for each respective site.
VE is presented as an unadjusted and comparison-adjusted value with 95% CIs. If the CI excludes 0, the results are statistically significant. To assess the model fit, we used the Hosmer-Lemeshow goodness of fit test [14]. Statistical analyses were performed using SAS statistical software (version 9.4; SAS Institute, Cary, North Carolina) and forest plots were created with R, version 3.1.1 (available at: http://www.R-project.org).
RESULTS
We enrolled 5999 subjects from December 2013 to April 2014, with peak enrollment in the third week of January (Supplementary Figure 1). A total of 362 subjects (6%) were excluded, including 133 partially vaccinated children aged <9 years and 178 individuals vaccinated <14 days prior to illness onset (Figure 1). Each of the 5 sites had >90% enrollees retained in the analysis. Of the 5637 analyzed subjects, 1197 (21%) had RT-PCR–confirmed influenza (the case group), and 4440 (79%) were negative for influenza virus (the control group). Of 1197 cases, 1022 (85%) were positive for A(H1N1)pdm09, 105 (9%) were positive for influenza A(H3N2) virus, and 70 (6%) were positive for influenza B virus. Among B viruses, 54 (77%) were B/Yamagata, 15 (21%) were B/Victoria, and 1 (1%) of unknown lineage. Antigenic characterization showed that 100% of 206 A(H1N1)pdm09 viruses, 98% of 26 influenza A(H3N2) viruses, 100% of 27 influenza B-Yamagata lineage viruses, and 100% of 7 influenza B-Victoria lineage viruses were similar to the respective 2013–2014 vaccine strain.
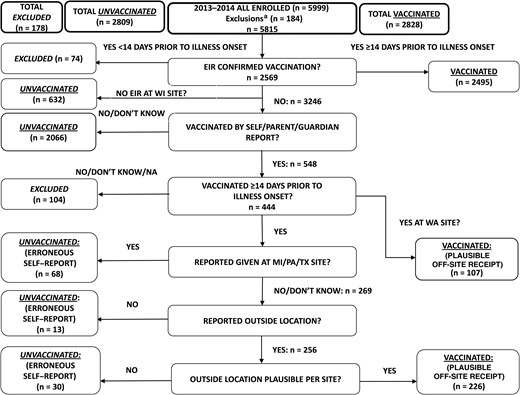
Algorithm for determination of 2013–2014 influenza vaccination status and inclusion/exclusion in the analytic data set. aExclusions denote 38 test-negative control subjects enrolled outside of the influenza A and B virus infection outbreak period, 133 partially vaccinated children, and 13 enrolled subjects with inconclusive or unrepeatable polymerase chain reaction results. Abbreviations: EIR, electronic immunization record (defined as electronic medical record, employee health record, and state immunization registry); MI, Michigan; PA, Pennsylvania; TX, Texas; WA, Washington; WI, Wisconsin.
Cases were more likely than controls to be adults aged 18–49 years, to be non-Hispanic white, to present 0–2 days after illness onset, to report excellent/very good general health, and to report exposure to cigarette smoke (Table 1). Of the 5637 subjects, 2828 (50.2%) had EIR-documented or plausible-reported influenza vaccine receipt ≥14 days from illness onset (Table 2). Eighty-eight percent of vaccinated subjects had EIR documentation, and 12% had plausible report only (Figure 1). Higher proportions were vaccinated among adults aged ≥50 years, those with any high-risk medical condition, those presenting 5–7 days after illness onset, and those with good, fair, or poor general health status.
Descriptive Characteristics of Subjects With Medically Attended Acute Respiratory Illness, by Influenza Virus Infection Status
| Characteristic | A(H1N1)pdm09-Positive Cases (n = 1022) | Influenza Virus–Positive Cases (n = 1197) | Influenza Virus–Negative Controls (n = 4440) | P Valuea |
|---|---|---|---|---|
| Site | <.001 | |||
| Michigan | 126 (12) | 141 (12) | 618 (14) | |
| Pennsylvania | 277 (27) | 297 (25) | 812 (18) | |
| Texas | 135 (13) | 176 (15) | 780 (18) | |
| Washington | 191 (19) | 240 (20) | 1310 (30) | |
| Wisconsin | 293 (29) | 343 (29) | 920 (21) | |
| Age | <.001 | |||
| 6 mo–8 y | 151 (15) | 171 (14) | 954 (21) | |
| 9–17 y | 79 (8) | 110 (9) | 515 (12) | |
| 18–49 y | 476 (47) | 545 (46) | 1623 (37) | |
| 50–64 y | 235 (23) | 269 (22) | 827 (19) | |
| ≥65 y | 81 (8) | 102 (9) | 521 (12) | |
| Male sex | 450 (44) | 530 (44) | 1837 (41) | .071 |
| Race/ethnicityb | .012 | |||
| White, non-Hispanic | 819 (80) | 958 (80) | 3372 (76) | |
| Black, non-Hispanic | 76 (7) | 85 (7) | 322 (7) | |
| Hispanic | 61 (6) | 77 (6) | 357 (8) | |
| Other, non-Hispanic | 65 (6) | 76 (6) | 322 (7) | |
| High-risk condition | <.001 | |||
| Any | 311 (30) | 365 (30) | 1800 (41) | |
| Asthma/pulmonary | 135 (13) | 158 (13) | 929 (21) | |
| Cardiovascular | 81 (8) | 100 (8) | 512 (12) | |
| Diabetes | 54 (5) | 62 (5) | 348 (8) | |
| Morbid obesityc | 64 (7) | 75 (7) | 338 (8) | |
| Other | 108 (11) | 127 (11) | 557 (13) | |
| Vaccination status 2013–2014 | <.0001 | |||
| Inactivated vaccined | 275 (27) | 335 (28) | 2215 (50) | |
| Vaccinated with IIV3e | 195 (19) | 235 (20) | 1544 (35) | |
| Vaccinated with IIV4e | 30 (3) | 37 (3) | 285 (6) | |
| Vaccinated with LAIV4d | 32 (3) | 42 (4) | 159 (4) | |
| Vaccinated with other/unknown typed | 13 (1) | 17 (1) | 60 (1) | |
| Unvaccinatedd | 702 (69) | 803 (67) | 2006 (45) | |
| Interval from illness onset to enrollment | <.001 | |||
| 0–2 d | 476 (47) | 526 (44) | 1282 (29) | |
| 3–4 d | 347 (34) | 413 (35) | 1714 (39) | |
| 5–7 d | 199 (19) | 258 (22) | 1444 (33) | |
| Reported general health statusf | .009 | |||
| Excellent/very good | 744 (73) | 881 (74) | 3070 (69) | |
| Good | 206 (20) | 239 (20) | 1062 (24) | |
| Fair/poor | 71 (7) | 76 (6) | 305 (7) | |
| Self/household exposure to smoke | 191 (19) | 211 (18) | 636 (14) | .005 |
| Children ages <12 y in household, no.g | .041 | |||
| 0 | 570 (56) | 669 (56) | 2308 (52) | |
| 1 | 192 (19) | 223 (19) | 938 (21) | |
| ≥2 | 260 (25) | 305 (25) | 1191 (27) | |
| Reported current health assessment score, median (IQR)h | 50 (40–70) | 50 (40–70) | 60 (50–75) | <.001 |
Data are no. (%) of subjects, unless otherwise indicated.
Abbreviations: A(H1N1)pdm09, 2009 pandemic influenza A(H1N1) virus; BMI, body mass index; EIR, electronic immunization record (includes electronic medical record, employee health record, and state immunization registry); IIV3/4, inactivated influenza vaccine, trivalent/quadrivalent; IQR, interquartile range; LAIV4, live attenuated influenza vaccine, quadrivalent.
a The χ2 statistic was used to assess differences between the numbers of persons with influenza virus–negative and influenza virus–positive test results, with respect to the distributions of site, age group, sex, race/ethnicity, presence of any high-risk condition, vaccination status, interval from illness onset to enrollment, general health status, self or household exposure to smoke, and number of children ages <12 years in the household. The Wilcoxon–Mann–Whitney test was used to assess differences with respect to the distribution of the current health assessment. A P value of <.05 is statistically significant.
b Data were missing for 10 enrollees.
c Defined as a body mass index of ≥40, calculated as the weight in kilograms divided by the height in meters squared. Data were missing for 312 enrollees.
d Vaccination status (≥14 days prior to illness onset) was determined by a combination of EIR and plausible off-site self-report or report by the parent or guardian. Persons aged ≥50 years with unknown vaccine type were assumed to have received inactivated vaccine (Figure 1).
e Vaccination status (≥14 days prior to illness onset) determined by EIR.
f Data were missing for 4 enrollees.
g Data were missing for 3 enrollees.
h Possible values range from 1 (the worst) to 100 (the best). Data were missing for 6 enrollees.
Descriptive Characteristics of Subjects With Medically Attended Acute Respiratory Illness, by Influenza Vaccination Status
| Characteristic | Vaccinateda (n = 2828) | Unvaccinated (n = 2809) | P Valueb |
|---|---|---|---|
| Site | <.001 | ||
| Michigan | 359 (47) | 400 (53) | |
| Pennsylvania | 452 (41) | 657 (59) | |
| Texas | 420 (44) | 536 (56) | |
| Washington | 966 (62) | 584 (38) | |
| Wisconsin | 631 (50) | 632 (50) | |
| Age | <.001 | ||
| 6 mo–8 y | 574 (51) | 551 (49) | |
| 9–17 y | 250 (40) | 375 (60) | |
| 18–49 y | 843 (39) | 1325 (61) | |
| 50–64 y | 656 (60) | 440 (40) | |
| ≥65 y | 505 (81) | 118 (19) | |
| Male sex | 1138 (48) | 1229 (52) | .008 |
| Race/ethnicityc | <.001 | ||
| White, non-Hispanic | 2247 (52) | 2083 (48) | |
| Black, non-Hispanic | 145 (36) | 262 (64) | |
| Hispanic | 194 (45) | 240 (55) | |
| Other, non-Hispanic | 239 (52) | 217 (48) | |
| High-risk condition | <.001 | ||
| Any | 1337 (62) | 828 (38) | |
| Asthma/pulmonary | 665 (61) | 422 (39) | |
| Cardiovascular | 456 (75) | 156 (25) | |
| Diabetes | 301 (73) | 109 (27) | |
| Morbid obesityd | 207 (50) | 206 (50) | |
| Other | 496 (73) | 188 (27) | |
| Interval from illness onset to enrollment | <.001 | ||
| 0–2 d | 830 (46) | 978 (54) | |
| 3–4 d | 1067 (50) | 1060 (50) | |
| 5–7 d | 931 (55) | 771 (45) | |
| Reported general health statuse | <.001 | ||
| Excellent/very good | 1905 (48) | 2046 (52) | |
| Good | 702 (54) | 599 (46) | |
| Fair/poor | 219 (58) | 162 (43) | |
| Self/household exposure to smoke | 322 (38) | 525 (62) | <.001 |
| Children ages <12 y in household, no.f | <.001 | ||
| 0 | 1574 (53) | 1403 (47) | |
| 1 | 566 (49) | 595 (51) | |
| ≥2 | 688 (46) | 808 (54) | |
| Reported current health assessment, median (IQR)g | 60 (45–75) | 60 (43–75) | .037 |
| Influenza virus infection statush | <.001 | ||
| Positive | 394 (33) | 803 (67) | |
| Negative | 2434 (55) | 2006 (45) |
Data are no. (%) of subjects, unless otherwise indicated.
Abbreviation: IQR, interquartile range.
a Defined as receiving ≥1 dose of any influenza vaccine ≥14 days before illness onset. A total of 178 participants who received the vaccine <13 days before illness onset were excluded from the vaccine effectiveness analyses (Figure 1).
b The χ2 statistic was used to assess differences between the numbers of persons vaccinated and unvaccinated, with respect to the distributions of site, age group, sex, race/ethnicity, presence of any high-risk condition, interval from illness onset to enrollment, general health status, self or household exposure to smoke, number of children ages <12 years in the household, and real-time polymerase chain reaction–confirmed influenza virus infection. The Wilcoxon–Mann–Whitney test was used to assess differences with respect to the distribution of the current health assessment. A P value of <.05 is statistically significant.
c Data were missing for 10 enrollees.
d Defined as a body mass index of ≥40, calculated as the weight in kilograms divided by the height in meters squared. Data were missing for 312 enrollees.
e Data were missing for 4 enrollees.
f Data were missing for 3 enrollees.
g Possible values range from 1 (the worst) to 100 (the best). Data were missing for 6 enrollees.
h Confirmed by real-time polymerase chain reaction.
Among patients aged ≥6 months, the comparison-adjusted VE against A(H1N1)pdm09-related MAARI for all 2013–2014 seasonal vaccines was 54% (95% CI, 46%–61%; Table 3). The all-ages VE for IIV was 58% (95% CI, 50%–65%). We observed significant age-stratified VE for IIV in children and adults, with a point-estimate range of 54%–75%. Overall, the parsimony-adjusted VE estimates were similar to the comparison-adjusted estimates, with overlapping CIs (Supplementary Table 1). The Hosmer–Lemeshow test showed that the goodness of fit was acceptable and similar for both adjusted models.
Comparison-Adjusted Effectiveness of 2013–2014 Influenza Vaccines Against 2009 Pandemic Influenza A(H1N1) Virus (A[H1N1]pdm09)–Related Medically Attended Acute Respiratory Illness (MAARI), by Vaccine Type and Age, During the Influenza A and B Virus Infection Epidemic Period
| Variable | A(H1N1)pdm09-Positive Cases | Influenza Virus–Negative Controls | Unadjusted VE, % (95% CI) | Comparison-Adjusted VE, % (95% CI)a,b | ||
|---|---|---|---|---|---|---|
| Overall, No. | Vaccinated, No. (%) | Overall, No. | Vaccinated, No. (%) | |||
| All seasonal influenza vaccinesc | ||||||
| ≥6 mo | 1022 | 320 (31) | 4440 | 2434 (55) | 62 (57–67) | 54 (46–61) |
| 6 mo–8 y | 151 | 46 (30) | 954 | 519 (54) | 63 (47–75) | 48 (22–66) |
| 9–17 y | 79 | 18 (23) | 515 | 221 (43) | 61 (32–77) | 54 (16–75) |
| 18–49 y | 476 | 115 (24) | 1623 | 711 (44) | 59 (48–68) | 53 (39–64) |
| 50–64 y | 235 | 87 (37) | 827 | 549 (66) | 70 (60–78) | 64 (48–74) |
| ≥65 y | 81 | 54 (67) | 521 | 434 (83) | 60 (33–76) | 59 (25–77) |
| IIV (ages ≥6 mo) | ||||||
| ≥6 mod | 981 | 272 (28) | 4232 | 2187 (52) | 64 (58–69) | 58 (50–65) |
| 6 mo–8 ye | 135 | 25 (19) | 885 | 417 (47) | 74 (60–84) | 63 (39–77) |
| 9–17 ye | 72 | 9 (13) | 450 | 150 (33) | 71 (41–86) | 61 (16–82) |
| 18–49 yd | 459 | 98 (21) | 1549 | 637 (41) | 61 (50–70) | 55 (41–66) |
| 50–64 yd | 234 | 86 (37) | 827 | 549 (66) | 71 (60–78) | 64 (48–75) |
| ≥65 yd | 81 | 54 (67) | 521 | 434 (83) | 60 (33–76) | 59 (26–77) |
| IIV (ages 6 mo–17 y)e | ||||||
| 6 mo to <2 y | 25 | 7 (28) | 222 | 134 (60) | 74 (36–90) | 75 (19–92) |
| 2–17 y | 182 | 27 (15) | 1113 | 433 (39) | 73 (58–82) | 60 (36–74) |
| 2–8 y | 110 | 18 (16) | 663 | 283 (43) | 74 (55–85) | 59 (28–77) |
| 2–4 y | 49 | 11 (22) | 387 | 186 (48) | 69 (37–84) | 54 (−1 to 79) |
| 5–8 y | 61 | 7 (7) | 276 | 97 (35) | 76 (45–90) | 67 (19–86) |
| LAIV4 (ages 2–17 y)e | ||||||
| 2–17 y | 172 | 24 (14) | 773 | 132 (17) | 21 (−26 to 51) | 17 (−39 to 51) |
| 2–8 y | 105 | 17 (16) | 418 | 72 (17) | 7 (−65 to 48) | −12 (−122 to 44) |
| 2–4 y | 45 | 8 (18) | 205 | 23 (11) | −71 (−312 to 29) | −178 (−820 to 16) |
| 5–8 y | 60 | 9 (15) | 213 | 49 (23) | 41 (−28 to 73) | 44 (−44 to 78) |
| 9–17 y | 67 | 7 (10) | 355 | 60 (17) | 43 (−32 to 75) | 48 (−28 to 79) |
Abbreviations: CI, confidence interval; EIR, electronic immunization record (includes electronic medical record, employee health record, and state immunization registry); IIV, inactivated influenza vaccines, trivalent/quadrivalent; LAIV4, live attenuated influenza vaccine, quadrivalent; PCR, polymerase chain reaction; VE, vaccine effectiveness.
a VE was estimated as 100 × [1 − odds ratio], where the odds ratio was calculated as the ratio of the odds of being vaccinated among subjects with MAARI who were positive for influenza virus by PCR to the odds of being vaccinated among subjects with MAARI who were negative for influenza virus by PCR. Odds ratios were estimated using logistic regression. If the 95% CI excludes 0, the results are considered statistically significant.
b The comparison model adjusted for site, age, calendar time, any high-risk condition, sex, race/ethnicity, general health status, and interval from illness onset to enrollment.
c Includes any 2013–2014 influenza vaccine per EIR or plausible off-site adult self-report and a similar report by parents or guardians for minors of any influenza vaccine (Figure 1).
d Includes any 2013–2014 inactivated influenza vaccine per EIR or plausible self-report or report by parents or guardians of receipt of an influenza vaccine after 1 July 2013 for adults and EIR of any inactivated influenza vaccine only for children <18 years. Persons aged ≥50 years with unknown vaccine type were assumed to have received inactivated vaccine.
e Includes retrospective 2013–2014 influenza vaccine per EIR only.
VE for LAIV4 was estimated in children aged 2–17 years; few adults received LAIV4. The LAIV4-adjusted VE against A(H1N1)pdm09-related MAARI was 18% (95% CI, −38% to 51%) and not statistically significant, similar to the parsimony-adjusted VE (12% [95% CI, −47% to 48%]). LAIV4 VE against A(H1N1)pdm09 was not significantly >0 in any age-stratified model. Among the youngest children, aged 2–4 years, 11% of those who were negative for influenza virus had received LAIV4, compared with 18% of those with RT-PCR–confirmed A(H1N1)pdm09; this difference was not statistically significant (P = .23).
We explored the effect of prior vaccination on the effectiveness of current-season vaccine in children aged 2–8 years, using children with no history of A(H1N1)pdm09-containing vaccine receipt as the reference group (Figure 2). We found significant protection against A(H1N1)pdm09 in fully vaccinated children aged 2–8 years who received IIV in the current season but not in children who received LAIV4. We observed significant residual VE against A(H1N1)pdm09-related MAARI (59%) among 100 children fully vaccinated with IIV or LAIV by 2012–2013 but unvaccinated in 2013–2014. Among these 100 children, IIV was the most recent vaccine type for 81, and LAIV was the most recent vaccine type for the remainder.
![Vaccine effectiveness (VE) against 2009 pandemic influenza A(H1N1) virus (A[H1N1]pdm09)–related medically attended acute respiratory illness (MAARI) during the 2013–2014 influenza season among children aged 2–8 years, by receipt or no receipt of ≥1 dose of current inactivated influenza vaccine (IIV) or live attenuated influenza vaccine (LAIV) and receipt or no receipt of any prior A(H1N1)pdm09-containing vaccine since the 2009 influenza pandemic. Trivalent IIV (IIV3) and quadrivalent IIV (IIV4) were both available only in 2013–2014, IIV3 was the only IIV available during the prior 4 seasons, and monovalent A(H1N1)pdm09-containing IIV was available in 2009–2010. Quadrivalent LAIV was the only LAIV available during 2013–2014, trivalent LAIV was available during the prior 4 seasons, and monovalent A(H1N1)pdm09-containing LAIV was available in 2009–2010. For children aged 2–8 years, we included those fully or partially vaccinated against A(H1N1)pdm09, per the definition of the Centers for Disease Control and Prevention's Advisory Committee on Immunization Practices (ACIP) [6]. Children who received 2 doses of the same vaccine type during the current season or 1 dose of either vaccine type during the current season with ≥1 dose/s of any a(H1N1)pdm09-containing vaccine since 2009 were considered fully vaccinated. Children who received both IIV and LAIV in 2013–2014 were excluded. VE was estimated as 100 × [1− odds ratio], where the odds ratio was calculated as the ratio of the odds of being vaccinated among subjects with MAARI who were positive for influenza virus by polymerase chain reaction (PCR; ie, cases) to the odds of being vaccinated among subjects with MAARI who were negative for influenza virus by PCR. Odds ratios were estimated using logistic regression. The comparison VE model adjusted for site, age, calendar time, any high-risk condition, sex, race/ethnicity, general health status, and interval from illness onset to enrollment. VEs for those with a VE or a lower bound of the 95% confidence interval (CI) of less than −25% were as follows: full in 2013–2014 (current LAIV), 21% (95% CI, −92% to 68%); partial in 2013–2014 (current IIV), 34% (95% CI, −285% to 89%); partial by 2012–2013 (no current), 30% (95% CI, −74% to 72%). aIncludes children partially vaccinated in the current season with IIV3/ or IIV4 alone, as there was no partially vaccinated child with LAIV4 administered during the current season.](https://oup.silverchair-cdn.com/oup/backfile/Content_public/Journal/jid/213/10/10.1093_infdis_jiv577/2/m_jiv57702.jpeg?Expires=1749910568&Signature=Gemyt6uELBaNyt7mpy82~H8r2MHLTv0ZQDdDqErc-5OlKgVSxMA7COEFDZqAhPGE0zp8uWLgL8vFgBarKNsKvxlQKz41uMIppxTcbifBjokfiOEIEnLyfimnqlvQ-LSbhV6~vRiQ-TFpnXXOppmPphnHS8V8aLaPPGpySg5HRuETxbKTUQeX7dFQVA2-DNwdwH~FhWWkHZM3nZA-OjQOxfMYhpHS-DxH93bFNMzbhKY-jgJk7lzq6tA-mDAtMLUDQmemP976-w3zHNe7~6ewCVWs2tfTQVt6vOxGKCKOb0z5s86TZIGhuUb2ezxkvsI2A7EgaEgJLGBa2U4~15TUxQ__&Key-Pair-Id=APKAIE5G5CRDK6RD3PGA)
Vaccine effectiveness (VE) against 2009 pandemic influenza A(H1N1) virus (A[H1N1]pdm09)–related medically attended acute respiratory illness (MAARI) during the 2013–2014 influenza season among children aged 2–8 years, by receipt or no receipt of ≥1 dose of current inactivated influenza vaccine (IIV) or live attenuated influenza vaccine (LAIV) and receipt or no receipt of any prior A(H1N1)pdm09-containing vaccine since the 2009 influenza pandemic. Trivalent IIV (IIV3) and quadrivalent IIV (IIV4) were both available only in 2013–2014, IIV3 was the only IIV available during the prior 4 seasons, and monovalent A(H1N1)pdm09-containing IIV was available in 2009–2010. Quadrivalent LAIV was the only LAIV available during 2013–2014, trivalent LAIV was available during the prior 4 seasons, and monovalent A(H1N1)pdm09-containing LAIV was available in 2009–2010. For children aged 2–8 years, we included those fully or partially vaccinated against A(H1N1)pdm09, per the definition of the Centers for Disease Control and Prevention's Advisory Committee on Immunization Practices (ACIP) [6]. Children who received 2 doses of the same vaccine type during the current season or 1 dose of either vaccine type during the current season with ≥1 dose/s of any a(H1N1)pdm09-containing vaccine since 2009 were considered fully vaccinated. Children who received both IIV and LAIV in 2013–2014 were excluded. VE was estimated as 100 × [1− odds ratio], where the odds ratio was calculated as the ratio of the odds of being vaccinated among subjects with MAARI who were positive for influenza virus by polymerase chain reaction (PCR; ie, cases) to the odds of being vaccinated among subjects with MAARI who were negative for influenza virus by PCR. Odds ratios were estimated using logistic regression. The comparison VE model adjusted for site, age, calendar time, any high-risk condition, sex, race/ethnicity, general health status, and interval from illness onset to enrollment. VEs for those with a VE or a lower bound of the 95% confidence interval (CI) of less than −25% were as follows: full in 2013–2014 (current LAIV), 21% (95% CI, −92% to 68%); partial in 2013–2014 (current IIV), 34% (95% CI, −285% to 89%); partial by 2012–2013 (no current), 30% (95% CI, −74% to 72%). aIncludes children partially vaccinated in the current season with IIV3/ or IIV4 alone, as there was no partially vaccinated child with LAIV4 administered during the current season.
Similarly, when information on vaccine type was limited to current and previous season, children who received current IIV only or IIV during both seasons were the only 2 groups with significant protection (Supplementary Figure 2). VE against A(H1N1)pdm09-related MAARI was (32% [95% CI, −79% to 74%]) not statistically significant among 42 children who received LAIV during both seasons.
We observed a significant effect modification (P = .0014) of current-season vaccination by previous-season vaccination among subjects aged ≥9 years. Compared with subjects who were unvaccinated during both seasons, a statistically significant VE was observed for those who received IIV in 2013–2014 and previous seasons; this was true for each of the 3 age groups (ie, 9–17 years, 18–49 years, and ≥50 years; Supplementary Figure 3). Similarly, VE for receipt of IIV in either 2013–2014 or 2012–2013 was statistically significant for all subjects aged ≥9 years, as well as for those 18–49 years old.
Similarly, receipt of ≥1 dose of any A(H1N1)pdm09-containing vaccine during the prior 4 seasons was associated with statistically significant VE for all patients aged ≥9 years and among those aged ≥50 years, whether or not they received 2013–2014 vaccine (Figure 3). Significant residual protection by ≥1 dose/s in any prior season without receipt of 2013–2014 vaccine was observed among patients aged ≥9 years, 9–17 years, and ≥50 years but not for those aged 18–49 years.
![Vaccine effectiveness (VE) against 2009 pandemic influenza A(H1N1) virus (A[H1N1]pdm09)–related medically attended acute respiratory illness (MAARI) for the 2013–2014 season among persons aged ≥9 years, by receipt or no receipt of current inactivated influenza vaccine (IIV; defined as trivalent IIV, quadrivalent IIV, or unknown influenza vaccine) and receipt or no receipt of any prior A(H1N1)pdm09-containing vaccine dose since the 2009 influenza pandemic. Children who received both IIV and live attenuated influenza vaccine in 2013–2014 were excluded. VE was estimated as 100 × [1− odds ratio], where the odds ratio was calculated as the ratio of the odds of being vaccinated among subjects with MAARI who were positive for influenza virus by polymerase chain reaction (PCR; ie, cases) to the odds of being vaccinated among subjects with MAARI who were negative for influenza virus by PCR. Odds ratios were estimated using logistic regression. The full VE model was adjusted for site, age, calendar time, any high-risk condition, sex, race/ethnicity, general health status, and interval from illness onset to enrollment. VE was not reported (NR) if the lower bound of the 95% confidence interval (CI) was less than −99%. VEs for those with a VE or lower bound of the 95% CI of less than −25% were as follows: ages 9–17 years (current dose only), 70% (95% CI, −169% to 97%).](https://oup.silverchair-cdn.com/oup/backfile/Content_public/Journal/jid/213/10/10.1093_infdis_jiv577/2/m_jiv57703.jpeg?Expires=1749910568&Signature=40Lgxjty~w5VmPsN9n5tY5sDNl7YJ7MX0eh5CpgurLWlA7cWU2ezTBCj6hhDwq4nglJEocKhxz~ZcmzX6NT5~LDhOq2ShxnkXIgpu~KKeAyUX3sJppz6SBqmO3GQb4E8uhPkooIBwC95J8EzTFnVZ90fuojbm~ZxzyzhePR0J~HjwV5G~lvWrIYhd2TG~FFFFoewkQPzHEtCUxj7-CSYepdmeXuZ1FRHARbBzIW81qaO4ECEkkhkY5xNUjVRMuokZCXMfdfYvcJpR0xrO73SljOcKBn3t99ytzS~82M-mrVwEkuS3FM96JI1gbMAxHGMh52zAwe5s4MEL7Snq2Y2Pg__&Key-Pair-Id=APKAIE5G5CRDK6RD3PGA)
Vaccine effectiveness (VE) against 2009 pandemic influenza A(H1N1) virus (A[H1N1]pdm09)–related medically attended acute respiratory illness (MAARI) for the 2013–2014 season among persons aged ≥9 years, by receipt or no receipt of current inactivated influenza vaccine (IIV; defined as trivalent IIV, quadrivalent IIV, or unknown influenza vaccine) and receipt or no receipt of any prior A(H1N1)pdm09-containing vaccine dose since the 2009 influenza pandemic. Children who received both IIV and live attenuated influenza vaccine in 2013–2014 were excluded. VE was estimated as 100 × [1− odds ratio], where the odds ratio was calculated as the ratio of the odds of being vaccinated among subjects with MAARI who were positive for influenza virus by polymerase chain reaction (PCR; ie, cases) to the odds of being vaccinated among subjects with MAARI who were negative for influenza virus by PCR. Odds ratios were estimated using logistic regression. The full VE model was adjusted for site, age, calendar time, any high-risk condition, sex, race/ethnicity, general health status, and interval from illness onset to enrollment. VE was not reported (NR) if the lower bound of the 95% confidence interval (CI) was less than −99%. VEs for those with a VE or lower bound of the 95% CI of less than −25% were as follows: ages 9–17 years (current dose only), 70% (95% CI, −169% to 97%).
VE against any influenza was similar to VE against A(H1N1)pdm09-related MAARI (Supplementary Table 2). The all-ages comparison-adjusted VE for all seasonal vaccines was not significant against influenza A(H3N2) virus (17% [95% CI, −45% to 53%]) and influenza B virus (29% [95% CI, −19% to 58%]).
Sensitivity analyses (Supplementary Table 3) considering self-reported vaccination only resulted in nonsignificantly higher VE against A(H1N1)pdm09-related MAARI point estimates, compared to the main analysis (Table 3), while excluding subjects with plausible report only or classifying patients with undocumented self-report as unvaccinated resulted in nonsignificantly lower VE point estimates. The VE against A(H1N1)pdm09-related MAARI did not change when we restricted the controls to the period of A(H1N1)pdm09 circulation for each site (Supplementary Table 3).
DISCUSSION
During 2013–2014, the VE against A(H1N1)pdm09-related MAARI for all seasonal vaccines was 54% in the US Flu VE Network and similar for all age groups. These results are consistent with VE estimates against A(H1N1)pdm09-related MAARI previously reported by the US Flu VE Network during 2009–2010, 2010–2011, and 2011–2012 and consistent with reports from other countries [8, 15–26]. Since there has been minimal antigenic drift in A(H1N1)pdm09 viruses and the vaccine H1N1 component A/California/7/2009 has remained unchanged since 2009, these results were not unexpected. Our results suggest some residual protection against A(H1N1)pdm09-related MAARI from prior A(H1N1)pdm09-containing vaccine receipt in subjects aged ≥9 years and among children aged ≤8 years if they had been fully vaccinated by 2012–2013. However, point estimates of VE were higher if children received the 2013–2014 IIV than if they were fully vaccinated by 2012–2013 with no current-season vaccination.
We report an unanticipated finding of no significant effectiveness of LAIV4 against A(H1N1)pdm09-related MAARI among children, despite the effectiveness of IIV. Our findings were corroborated by 2 other observational test-negative design studies among children in the United States during 2013–2014, one of which was a multisite study sponsored by the LAIV manufacturer [27]. Both studies reported reduced effectiveness of LAIV4, compared with IIV, against A(H1N1)pdm09 infection [27, 28]. Prior to 2013–2014, there were limited opportunities to directly evaluate the LAIV effectiveness against A(H1N1)pdm09 infection in children. Two studies during the 2009 pandemic suggested a high VE for the monovalent A(H1N1)pdm09 LAIV among children, although delayed availability of monovalent vaccines resulted in vaccination during declining circulation with very small numbers of vaccinated cases [15, 29]. One observational school-based study in during 2010–2011 (when A[H1N1]pdm09 cocirculated with influenza A[H3N2] and B viruses) reported LAIV effectiveness against PCR-confirmed influenza virus infections and decreased absenteeism among intervention schoolchildren, compared with children from comparison schools [30]. Secondary analysis of this study found an unadjusted total VE against A(H1N1)pdm09-related illness (comparing vaccinated schoolchildren from the intervention schools to unvaccinated children from comparison schools) of 69% (95% CI, 14%–89%) for LAIV and 60% (95% CI, −192% to 95%) for IIV and a nonsignificant unadjusted direct VE against A(H1N1)pdm09-related illness in intervention schools of 60% (95% CI, −17% to 86%) for LAIV and 48% (95% CI, −290% to 93%) for IIV (M. Gaglani, personal communication with P. Pannaraj). Finally, 2 studies reported LAIV3 effectiveness against A(H1N1)pdm09-related illness during 2013–2014. One cluster-randomized school-based study reported a significantly lower incidence of PCR-confirmed influenza among LAIV3 recipients, compared with IIV recipients (0.13 vs 1.24 cases/1000 person‐days; hazard ratio, 0.10 [95% CI, .002–.94]), where A(H1N1)pdm09 was the predominant virus [31]. An observational study using the test-negative design reported good VE for LAIV3 against A(H1N1)pdm09-related MAARI, although there were very small numbers of children who received LAIV [32].
During 2013–2014, LAIV4 was first introduced in the United States. However, it seems unlikely that the change to quadrivalent vaccine with possible viral interference could be responsible for our findings. Prior to licensure, immune response to a prepandemic influenza A(H1N1) virus in the LAIV4 was shown to be noninferior to that of LAIV3 containing a single seasonal influenza B virus in immunogenicity studies [33, 34]. Also, despite low VE against A(H1N1)pdm09, effectiveness of LAIV4 against influenza B virus during the 2013–2014 season was reported from the manufacturer-sponsored observational study [27]. One possible explanation is that prior vaccination with either vaccine type may have led to decreased current LAIV virus replication in children who had been vaccinated in earlier years. However, as seen in Supplementary Figure 2, small sample sizes limited our ability to investigate the impact of prior vaccination on the VE of current LAIV in this study. An alternative explanation for the variable effectiveness of LAIV is that A(H1N1)pdm09-containing LAIV, with the hemagglutinin (HA) from an early pandemic virus, was more susceptible than the other LAIV viruses to environmental stressors, such as breaks in the cold chain. In vitro studies have shown that either an amino acid (glutamic acid at amino acid 47 [E47]) in the stalk region of the HA present in the wild-type A/California/7/2009 vaccine virus and cold-adapted LAIV A(H1N1)pdm09 construct or the matrix gene segment encoding M2 protein of the cold-adapted A/Ann Arbor/60(H2N2) master donor virus affects thermostability [35, 36]. As A(H1N1)pdm09 continued to circulate in humans, glutamic acid was replaced with lysine (K) in HA2 position 47, resulting in more stability in in vitro assays assessing thermostability and infectiousness in the ferret model [35]. LAIV dosing studies demonstrated that even a single 1-log reduction in virus titer can result in lower efficacy [37]. Selection of an A(H1N1)pdm09 virus with improved thermostability for LAIV may improve the consistency of results but will require evaluation of effectiveness during another season when A(H1N1)pdm09 viruses circulate.
In contrast to the ineffectiveness of LAIV during 2013–2014, the effectiveness of IIV against A(H1N1)pdm09-related MAARI was observed over multiple seasons during which circulating A(H1N1)pdm09 remained antigenically similar to the A/California/07/2009 reference strain. Protection provided against A(H1N1)pdm09 by 2013–2014 IIV among previously vaccinated individuals is important because decreased antibody response to A(H1N1)pdm09 has been observed among healthcare personnel who received 2010–2011 seasonal IIV after receipt of monovalent, unadjuvanted, inactivated pandemic vaccine, compared with those who received 2010–2011 IIV only [38]. Evidence of continued effectiveness of A(H1N1)pdm09-containing vaccines among individuals vaccinated in prior seasons supports the recommendation for annual vaccination. While estimates of residual protection of any prior-season vaccination, mostly with IIV, were lower than those for receipt of 2013–2014 IIV, the effectiveness of any prior-season vaccine alone was still 38% among patients aged ≥9 years (Figure 3) and 43% for 2012–2013 IIV only (Supplementary Figure 3). In Canada, residual protection of 50% in 2013–2014 was reported for those who received trivalent IIV in 2012–2013 and were not vaccinated in 2013–2014, while no residual protection was observed 5 years after receipt of adjuvanted monovalent A(H1N1)pdm09 vaccine in 2009 [32]. We observed similar residual protection among children aged 2–8 years who were fully vaccinated by 2012–2013 and unvaccinated in 2013–2014, although protection provided by partial vaccination with either was not statistically significant. Evidence of significant residual protection provided by any prior vaccination against A(H1N1)pdm09 was consistent with previous findings of residual protection of prior vaccination against influenza A(H3N2) and B viruses among adolescents and adults [8–9, 39].
The limitations of our study include small numbers among some of the stratified groups, including children who received LAIV. We have adequate sample size for estimating overall VE, but some of the subanalyses by age groups or vaccine types yielded relatively small sample sizes, with lower power and wide CIs. The state immunization registries were important sources of vaccination data, but they were not adequate for adults. Adult vaccination could not always be validated, necessitating the use of plausible self-report for vaccination status. Self-reported vaccination status by adults has been shown to be more reliable than parental reports of children's receipt of influenza vaccine; thus, we considered only children with EIR-documented doses as having been vaccinated [12]. Since prior-season vaccination was limited to EIR-documented doses, some subjects who were classified as having been unvaccinated during prior seasons may have been misclassified. Finally, we attempted to control for possible confounders, using both parsimonious and comparison-adjusted models in our prospective observational study, but we cannot rule out residual unmeasured confounding.
In summary, the 2013–2014 influenza season in the United States was notable for resurgence of A(H1N1)pdm09 as the predominant seasonal virus for the first time since 2009. We found significant protection for IIV against PCR-confirmed A(H1N1)pdm09-related MAARI in subjects aged ≥6 months, but there was an unexpected finding of ineffectiveness of LAIV4 in children aged 2–17 years. In June 2013, based on evidence for the LAIV's superior efficacy to that of IIV in young children, including randomized, controlled trials [40–42], the ACIP had recommended a preference for the use of LAIV, when immediately available, for healthy children aged 2–8 years, beginning in 2014–2015 [43]. In February 2015, the ACIP voted not to renew the 2014–2015 preferential recommendation for use of LAIV in children 2–8 years of age for the 2015–2016 season; both LAIV and IIV are recommended for children aged 2–8 years [44]. This highlights the importance of continued annual monitoring of the effectiveness of influenza vaccines in the United States.
Notes
Acknowledgments. We thank the study participants at each of the 5 Centers for Disease Control and Prevention (CDC) US Flu VE Network sites; Madhava Beeram, Alejandro Arroliga, Donald Wesson, Richard Beswick, Monica Weir, Patricia Sleeth, Virginia Gandy, Teresa Ponder, Mary Kylberg, Hope Gonzales, Martha Zayed, Deborah Furze, Jeremy Ray, Jessica Rostocykj, and Glen Cryer, Baylor Scott & White Health; LaShondra Berman, Stephen Lindstrom, Angie Foust, Wendy Sessions, Xiyan Xu, Rebecca Garten, John R. Barnes, Jacqueline M. Katz, Swathi N. Thaker, Sarah Spencer, Angela Campbell, Joseph Bresee, Erin Burns, Jerome Tokars, and Daniel Jernigan, Influenza Division, National Center for Immunization and Respiratory Diseases, CDC; C. Hallie Phillips, Joyce Benoit, Lawrence Madziwa, Matthew Nguyen, and Julia Anderson, Group Health Research Institute; Emileigh Johnson, Rachel Truscon, MPH, and Casey Martens, University of Michigan School of Public Health, Ann Arbor; and Marcus Zervos, MD, and Lois Lamerato, PhD, Henry Ford Health System, Detroit, Michigan.
Disclaimer. The findings and conclusions in this article are those of the authors and do not necessarily represent the views of the CDC.
Financial support. This work was supported by the CDC, through cooperative agreements with the University of Michigan (U01 IP000474), Group Health Research Institute (U01 IP000466), Marshfield Clinic Research Foundation (U01 IP000471), University of Pittsburgh (U01 IP000467), and Baylor Scott and White Health (U01 IP000473); and for infrastructure by the National Institutes of Health (grants UL1 RR024153 and UL1TR000005 to the University of Pittsburgh).
Potential conflicts of interest. M. G. received grants from the CDC during the conduct of the study and grants from MedImmune/AstraZeneca outside of the submitted work. P. A. P. served on the speaker bureau at Medimmune, and within the past year he served as a scientific advisor on influenza for AstraZeneca. R. K. Z. has received grants from Sanofi Pasteur, Pfizer, and Merck. J. G. P., S. E. O., and H. Q. M. have received a grant from CDC. E. A. B. has received grants from Centers for Disease Control and Prevention and MedImmune. A. S. M. has received grants from the CDC and Sanofi Pasteur and has served as a consultant for GSK, Sanofi Pasteur, Novavax, Novartis, and Protein Sciences. M. P. N. received grants from Pfizer and Merck during the conduct of the study and a grant from MedImmune outside of the submitted work. All other authors report no potential conflicts. All authors have submitted the ICMJE Form for Disclosure of Potential Conflicts of Interest. Conflicts that the editors consider relevant to the content of the manuscript have been disclosed.
References
Author notes
Presented in part: IDWeek 2014, Philadelphia, Pennsylvania, 8–12 October 2014.
Present affiliation: Atlanta Research and Education Foundation, Georgia.

