


Abstract
Background. Few data are available on the immunogenicity of repeated annual doses of influenza A(H1N1)pdm09-containing vaccines.
Methods. We enrolled healthcare personnel (HCP) in direct patient care during the autumn of 2010 at 2 centers with voluntary immunization. We verified the receipt of A(H1N1)pdm09-containing monovalent inactivated influenza vaccine (MIIV) and 2010–2011 trivalent inactivated vaccine (TIV). We performed hemagglutination inhibition antibody (HI) assays on preseason, post-TIV, and end-of-season serum samples. We compared the proportion of HCPs with HI titer ≥40 against A(H1N1)pdm09 per receipt of prior-season MIIV, current-season TIV, both, or neither.
Results. At preseason (n = 1417), HI ≥ 40 was significantly higher among those who received MIIV (34%) vs those who did not (14%) (adjusted relative risk [ARR], 3.26; 95% confidence interval [CI], 2.72–3.81). At post-TIV (n = 865), HI ≥ 40 was lower among HCP who received MIIV and TIV (66%) than among those receiving only TIV (85%) (ARR, 0.93 [95% CI, .84–.997]). At end-of-season (n = 1254), HI ≥ 40 was 40% among those who received both MIIV and TIV and 67% among those receiving only TIV (ARR, 0.76 [95% CI, .65–.88]), 52% among those who received MIIV only, and 12% among those receiving neither.
Conclusions. HCP immunization programs should consider effects of host immune response and vaccine antigenic distance on immunogenicity of repeated annual doses of influenza vaccines.
Healthcare personnel (HCP) may be exposed to influenza viruses during direct patient care. A recent meta-analysis showed that, compared with adults working in nonhealthcare settings, HCP have significantly higher risk, especially for asymptomatic influenza [1]. Vaccination of HCP may prevent transmission, reduce staff illnesses and absenteeism, and decrease influenza-associated morbidity and mortality in high-risk persons [2, 3]. Although there are long-standing recommendations to immunize HCP, there is limited information on immunogenicity of influenza vaccines among this group [4–8].
Reports of lower immunogenicity of vaccines in primed populations have periodically raised concern regarding the effectiveness of annual revaccination [9–14]. A study in Japan reported impaired hemagglutination inhibition antibody (HI) response among HCP revaccinated during consecutive years [15]. The implications of these reports for vaccine effectiveness are unknown. We performed a prospective cohort study during 2010–2011 at 2 medical centers offering voluntary HCP immunization to examine factors that influence immunogenicity against laboratory-confirmed influenza. The administration of monovalent vaccines in 2009–2010 presented an opportunity to examine the HI response against the 2009 influenza A(H1N1) pandemic virus [A(H1N1)pdm09] among HCP who may have received vaccine containing the same antigen. Our hypothesis was that receipt of 2010–2011 seasonal A(H1N1)pdm09-containing vaccines should produce an HI response similar to that reported in clinical trials [16–20], regardless of receipt of prior-season vaccine.
METHODS
Study Design and Setting
A prospective cohort was enrolled after the 2009–2010 influenza A(H1N1) pandemic season in autumn 2010 at Scott & White Healthcare (SWH) in Temple/Round Rock, Texas, and Kaiser Permanente Northwest (KPNW) in metropolitan Portland, Oregon. Eligible HCP were aged 18–65 years, working ≥32 hours per week, receiving care from site for >12 months, and providing direct patient care. Details on cohort recruitment are presented in Thompson et al [21]. Announcements regarding a “respiratory illness in healthcare workers” study were sent to all employees before and during voluntary immunizations. Study protocol was approved by the sites' institutional review boards.
Enrollment and Follow-up Procedures
Participants completed an Internet-based questionnaire at enrollment/preseason that included demographics, health, occupation, and work setting. We assessed self-rated health status with a 5-level rating of overall health [22, 23], and calculated body mass index. We extracted data from electronic health records to characterize participants with high-risk conditions during the prior year [24]. We confirmed 2010–2011 and prior-season influenza immunization from medical/employee health records. Blood was drawn at 3 time points: at enrollment from all participants (preseason serum), approximately 30 days after receipt of 2010–2011 vaccine, (post–trivalent inactivated vaccine [TIV] serum), and approximately 7 months after enrollment from all participants (end-of-season serum).
From 18 December 2010 to 30 April 2011, participants completed weekly Internet or computer-assisted telephone surveys assessing for acute respiratory illness (ARI; cough and fever/feverishness/chills, onset ≤7 days). Internet reports were common (78%). Noncompliant participants received email/telephone reminders to complete surveys. Health records were monitored daily for ARI diagnoses (International Classification of Diseases, Ninth Revision, Clinical Modification codes 460–466, 480–488). Identified ARIs prompted a visit at home or the clinic where nasal, nasopharyngeal, and oropharyngeal swabs were collected, then tested for influenza A and B using real-time reverse transcription polymerase chain reaction (rRT-PCR) assay, with primers, probes, and reagents from the Centers for Disease Control and Prevention. A positive result from any swab was accepted.
Composition of Vaccines and Circulating Strains
Each site offered both TIV and live attenuated influenza vaccine (LAIV) during both seasons. The monovalent A(H1N1)pdm09 vaccines contained A/California/7/2009 (H1N1)–like virus, which was the predominant virus in 2009–2010 at both sites [25]. The 2010–2011 seasonal trivalent vaccines also contained A/California/7/2009 (H1N1)–like virus. The predominant circulating viruses at the sites in 2010–2011 were similar to that in the United States: 74% of all positive results were influenza A, A(H3N2) 62% of all subtyped, and the rest A(H1N1)pdm09 [26].
Lot Analysis of 2010–2011 TIV and 2009–2010 Monovalent Inactivated Influenza Vaccine
At KPNW, a single lot (A) of TIV from manufacturer W was administered to 88% of vaccinated HCPs for whom all 3 serum samples were taken; remaining lots were from W and X. At SWH, 2 lots (B and C) from manufacturer Y accounted for 91%; remaining lots were from manufacturer Z. In 2009–2010, both sites had administered many lots of monovalent inactivated influenza vaccine (MIIV) from W, X, Z, or unknown manufacturers. Of 489 HCP who received 2009–2010 MIIV and 2010–2011 TIV, 146 of 242 (60%) from KPNW received a single lot of MIIV and 193 of 247 (78%) from SWH received 2 lots from the same manufacturer Z.
Hemagglutination Inhibition Antibody Assay
Serum HI assays for each HCP were run in duplicate simultaneously using standard technique at the Battelle laboratory (Aberdeen, Maryland), after completing a Centers for Disease Control and Prevention (CDC) proficiency panel [27, 28]. A standard turkey red blood cell (RBC) suspension was prepared, and serum samples were treated with receptor-destroying enzyme to remove nonspecific inhibitors. Nonspecific agglutinins were removed by serum adsorption with packed RBCs. Serum was diluted 2-fold starting from 1:10. The HI titer was the reciprocal of the serum dilution in the last well with complete hemagglutination inhibition. The geometric mean titer (GMT) from duplicate results was reported; HI < 10 was considered to be 5 for GMT calculation.
Statistical Analyses
We performed the primary analysis at 3 time points. For time point 1, we included 1417 HCP who had a serum specimen at preseason. Because the predominant vaccine used at each site during both seasons was inactivated and we were examining the effect of second annual homologous revaccination on A(H1N1)pdm09 HI titers, we excluded monovalent LAIV recipients. For time point 2, we included HCP who had a specimen at preseason, received 2010–2011 TIV, and had a specimen approximately 30 days (from 14 to 63 days only) post-TIV. Some members of this group had received A(H1N1)pdm09 MIIV and others had not. For time point 3, we included HCP who had serum samples taken at both preseason and end-of-season. This included some who received only 2009–2010 MIIV or 2010–2011 TIV, some who received both, and some who received neither. For the end-of-season analysis, we excluded H1N1pdm09-infected HCP during 2010–2011 evidenced by a positive rRT-PCR test or seroconversion (between preseason and end-of-season serum for unvaccinated, and between post-TIV and end-of-season serum for TIV recipients). Seroconversion was defined as preseason HI < 10 and post-TIV/end-of-season HI ≥ 40; or preseason HI ≥ 10 and a minimum 4-fold rise for post-TIV/end-of-season serum (US Food and Drug Administration definition).
For the 3 primary analyses, we examined HCP characteristics: demographics, health status, vaccination history, timing of serum sampling, site, proxies for influenza exposure, and HI titer preseason. Means were compared utilizing the Wilcoxon rank-sum or 2-sample t test, and proportions by χ2 or Fisher exact test. A P value of <.05 indicated statistically significant difference. We constructed logistic regression models for each analysis with outcome variable A(H1N1)pdm09 HI ≥ 40, adjusting for HCP characteristics. As preseason HI titers correlate with post-TIV titers, controlling for baseline/preseason HI titer is recommended for single-season studies [29]. However, because we examined effects over 2 seasons, we did not adjust for preseason titers, because of a lack of true baseline before receipt of all vaccines (MIIV receipt was prior to 2010–2011 preseason titer) and doing so would have removed prior H1N1 infection and/or MIIV effect.
An HI ≥ 40 is a generally accepted laboratory correlate for at least 50% protection against influenza infection [30–32]. We thus compared the proportion of HCP with HI ≥ 40 for preseason, post-TIV, and end-of-season serum samples by vaccination history. We also assessed HI response for post-TIV and end-of-season serum samples by preseason HI < 40 or HI ≥ 40; by HI < 10, HI 10 to <40, and HI ≥ 40; and by vaccination history.
Because the outcome variable HI ≥ 40 was common, the odds ratio (OR) is not a good approximation to the relative risk (RR), so we converted adjusted ORs to adjusted relative risks (ARRs) using the following equation, where P0 = the incidence of disease in the nonexposed group: RR = OR/([1 – P0] + [OR* P0]) [33]. This conversion is recommended for cohort designs such as ours; however, we also validated the ARR conversion using Poisson regression with robust covariance, adjusting for covariates.
We conducted 4 sets of secondary analyses to confirm our findings. First, we ran logistic regression models for each site for the 3 primary analyses. Second, we compared HCP characteristics and HI titers for those who received the 3 most common lots of vaccine at our 2 sites. Third, we compared descriptive characteristics for TIV-vaccinated HCP by receipt or not of prior MIIV. Fourth, as a sensitivity analysis for the subgroup of vaccinated HCP with all 3 serum samples, we applied a linear mixed effects model. For this analysis, HI titers were first rounded down to 2-fold reciprocal serum dilutions. Only a small number of GMTs that fell in between levels were rounded down (eg, GMT of 7 or 28 was rounded down to 5 or 20, respectively). For assessment as a continuous variable, HI titers were then converted to ordinal HI levels from 0 to 9 for each 2-fold increase from 5 to 2560 by log transformation: log2 (HI titer/5) [32, 34]. The linear mixed-effects model assessed ordinal HI level as primary outcome, controlling for time and other covariates. Post-TIV days were represented with linear and quadratic time terms. We considered different error–covariance structures to account for within-subject correlation over time and selected a first-order autoregressive with random-intercept model because it had the smallest Bayesian information criterion. We evaluated the effect of prior receipt of MIIV on ordinal HI levels for the 3 serum samples. SAS version 9.2 (SAS Institute) was used for analyses.
RESULTS
Descriptive Data
Supplementary Figure 1 shows that 1417 HCP in direct patient care were enrolled and gave preseason sera. Of these, 936 (66%) received TIV and 865 (59%) had a blood specimen approximately 30 days post-TIV; the specimen was drawn between 14 and 42 days for 822 (95%) and between 43 and 63 days for 43 (5%). When compared with HCP included preseason (Table 1), those post-TIV were more likely to be aged 50–65 years, have high-risk conditions, and receive 2009–2010 seasonal vaccines, and less likely to work in the emergency department. Of 1417 HCP from preseason, 1254 (89%) had end-of-season serum samples assessed for A(H1N1)pdm09 HI titers. The proportion of HCP who had prior-season MIIV was similar among those providing preseason (42%) and end-of-season (43%) serum samples, but higher among those providing post-TIV sera (57%) (Table 1). There were modest but statistically significant differences between the 2 study sites in HCP characteristics at enrollment (Supplementary Table 1).
Descriptive Characteristics, Vaccination History, and 2009 A(H1N1) Pandemic Influenza Virus Hemagglutination Inhibition Antibody Seroresponse of Healthcare Personnel
| Characteristic | Preseason | After 2010–2011 TIV | End-of-Season |
|---|---|---|---|
| Serum (n = 1417) | Serum (n = 865) | Serum (n = 1254) | |
| Descriptive characteristics | |||
| Demographics | |||
| Age, y | 42 (12) | 43 (12) | 42 (12) |
| Age group | |||
| 18–34 y | 523 (37%) | 279 (32%) | 442 (35%) |
| 35–49 y | 508 (36%) | 300 (35%) | 449 (36%) |
| 50–65 y | 386 (27%) | 286 (33%) | 363 (29%) |
| Female | 1132 (80%) | 712 (82%) | 1011 (81%) |
| White | 1117 (79%) | 696 (80%) | 988 (79%) |
| Hispanic | 165 (12%) | 99 (11%) | 144 (11%) |
| Health | |||
| Body mass index, kg/m2 | 28 (7) | 29 (7) | 28 (7) |
| Subjective health status (1–5) | 4.1 (0.7) | 4.1 (0.7) | 4.1 (0.7) |
| HCP with high-risk condition(s) in 2009–2010 | 477 (34%) | 316 (37%) | 431 (34%) |
| Proxies for exposure to infection | |||
| HCP with ≥1 MAARI during A(H1N1)pdm09 | 176 (12%) | 106 (12%) | 164 (13%) |
| HCP with ≥1 MAARI during 2010–2011 influenza season | 141 (10%) | 89 (10%) | 126 (10%) |
| Household size | 2.1 (1.6) | 2.1 (1.5) | 2.1 (1.5) |
| Hours of direct patient care per week | 32.6 (11.2) | 31.8 (11.0) | 32.4 (11.1) |
| Emergency department HCP | 375 (26%) | 202 (23%) | 328 (26%) |
| Site | |||
| Kaiser Permanente Northwest, Oregon | 418 (29%) | 286 (33%) | 395 (32%) |
| Scott & White Healthcare, Texas | 999 (71%) | 579 (67%) | 859 (69%) |
| Timing of sera collection | |||
| No. of days from preseason serum to 2010–2011 TIV | 15 (13) | ||
| No. of days from 2010–2011 TIV to post-TIV serum | 31 (8) | ||
| No. of days from preseason to end-of-season serum | 212 (15) | ||
| Influenza vaccination history | |||
| 2009–2010 seasonal influenza (TIV or LAIV) vaccination | 1007 (71%) | 736 (85%) | 894 (71%) |
| MIIV vaccination | 598 (42%) | 489 (57%) | 545 (43%) |
| 2010–2011 seasonal TIV vaccination | 936 (66%) | 865 (100%) | 894 (71%) |
| Vaccination interactions for 2009–2010 and 2010–2011 | |||
| No MIIV and No 2010–2011 TIV | 398 (28%) | 0 (0%) | 304 (24%) |
| No MIIV and Yes 2010–2011 TIV | 421 (30%) | 376 (43%) | 405 (32%) |
| Yes MIIV and No 2010–2011 TIV | 83 (6%) | 0 (0%) | 56 (4%) |
| Yes MIIV and Yes 2010–2011 TIV | 515 (36%) | 489 (57%) | 489 (39%) |
| Preseason serum HI antibody titer | |||
| GMT of A(H1N1)pdm09 HI titers | 11.9 (3.1) | 12.4 (3.1) | 11.9 (3.1) |
| Ordinala A(H1N1)pdm09 HI level | 1.3 (1.6) | 1.3 (1.6) | 1.2 (1.6) |
Data are presented as mean (SD) or No. (%).
Abbreviations: GMT, geometric mean titer; HCP, healthcare personnel; HI, hemagglutination inhibition antibody; LAIV, live attenuated influenza vaccine; MAARI, medically attended acute respiratory illness; MIIV, 2009–2010 A(H1N1) pandemic monovalent inactivated influenza vaccine; TIV, trivalent inactivated vaccine.
a Ordinal HI levels are represented with 0–9 levels based on log transformation of HI titers: Log2 (HI titer/5).
Primary Analyses
In the time 1/preseason analysis, an HI ≥ 40 for A(H1N1)pdm09 was found in 34% of those receiving prior-season MIIV vs 14% for those without (ARR = 3.26 [95% confidence interval {CI}, 2.72–3.81]) (Table 2). In the time 2/post-TIV analysis, among 865 HCPs receiving 2010–2011 TIV, receipt of prior-season MIIV was associated with a significantly lower proportion with HI ≥ 40 (66% vs 85% for those receiving TIV only; ARR, 0.93 [95% CI, .84–.997]). Among those with preseason HI ≥ 40, almost all had post-TIV HI ≥ 40 (ARR, 1.00 [95% CI, .95–1.02]). For post-TIV-serum samples, HI ≥ 40 was associated with female sex and SWH site and inversely associated with age and direct patient care hours (data not shown).
Serum Hemagglutination Inhibition Antibody (HI) Titer ≥40 Among Healthcare Personnel at 2010–2011 Preseason, Post–Trivalent Inactivated Vaccine, and End-of-Season by Influenza Vaccination History and by Preseason HI Titer
| No. of HCP With preseason, post-TIV and End-of-Season serum by Influenza Vaccination History | No. of HCP With HI Titer ≥40 at Post-TIV, or End-of-Season/No. of HCP With Preseason HI Titer <40 | No. of HCP With HI Titer ≥40 at Post-TIV, or End-of-Season/No. of HCP With Preseason HI Titer ≥40 | No. of HCP With HI Titer ≥40 at Preseason, Post-TIV, or End-of-Season/All HCP | Adjusteda Odds Ratio of HCP With HI Titer ≥40 (95% CI) | Adjustedb Relative Risk of HCP With HI Titer ≥40 (95% CI) |
|---|---|---|---|---|---|
| No./No. (%) | No./No. (%) | No./No. (%) | |||
| Time 1 (preseason serum) (n = 1417) | |||||
| Yes MIIV and No TIV (n = 598) | NA | NA | 205/598 (34%)c | 5.24 (3.82–7.18) | 3.26 (2.72–3.81) |
| No MIIV and No TIV (n = 819) | NA | NA | 117/819 (14%) | 1.00 | 1.00 |
| Time 2 (post-TIV serum) (n = 865) | |||||
| Yes MIIV and Yes TIV (n = 489) | 171/335 (51%) | 150/154 (97%) | 321/489 (66%) | 0.66 (.45–.98) | 0.93 (.84–.997) |
| No MIIV and Yes TIV (n = 376) | 266/322 (83%) | 53/54 (98%) | 319/376 (85%) | 1.00 | 1.00 |
| Time 3 (end-of-season serum) (n = 1254) | |||||
| No MIIV and No TIV (n = 304) | 1/263 (0%) | 35/41 (85%) | 36/304 (12%) | 1.00 | 1.00 |
| No MIIV and Yes TIV (n = 405) | 219/350 (63%) | 54/55 (98%) | 273/405 (67%)d | 16.24 (10.34–25.52) | 5.79 (4.91–6.54) |
| Yes MIIV and No TIV (n = 56) | 0/26 (0%) | 29/30 (97%) | 29/56 (52%) | 10.87 (5.52–21.43) | 5.01 (3.60–6.27) |
| Yes MIIV and Yes TIV (n = 489) | 49/334 (15%) | 147/155 (95%) | 196/489 (40%)d | 8.33 (5.19–13.38) | 4.46 (3.47–5.43) |
Abbreviations: CI, confidence interval; HCP, healthcare personnel; HI, hemagglutination inhibition antibody; MIIV, 2009–2010 A(H1N1) pandemic monovalent inactivated influenza vaccine; NA, not applicable; TIV, 2010–2011 trivalent inactivated influenza vaccine containing 2009 A (H1N1) pandemic component.
a Adjusted odds ratios (AORs) with 95% CIs are from multivariable logistic regression models adjusted for all descriptive characteristics listed in Table 1, including age and excluding age group and geometric mean titer and ordinal level of preseason A(H1N1)pdm09 HI titers. Statistically significant AORs (P < .05) are bolded. The covariates that were most influential in changing the AORs were age and site at preseason, post-TIV, and end-of-season and receipt of 2009–2010 seasonal influenza vaccine at preseason. Multiple other covariates changed AORs at end-of-season.
b Using the conversion formula proposed by Zhang et al [37], validated by Poisson regression with robust covariance.
c Bolded: Statistically significant difference in proportions with P < .05 by the χ2 test.
d HCP who received both 2009 MIIV and 2010–2011 TIV were significantly less likely to have HI ≥ 40 than those who received TIV only (AOR, 0.51 [95% CI, .38–.70]); adjusted relative risk, 0.76 [95% CI, .65–.88]).
In the time 3/end-of-season analysis, we found a statistically significant interaction between receipt of MIIV and TIV and therefore stratified the analysis into 4 groups (Table 2). Among all 1254 HCPs without lab-confirmed A(H1N1)pdm09 infection in 2010–2011, HI ≥ 40 was maintained in 40% among those who received both MIIV and TIV, 67% among those receiving only TIV, 52% among those who received only MIIV, and 12% among those receiving neither. HCP who received both MIIV and TIV were significantly less likely to have HI ≥ 40 than those receiving TIV only (ARR, 0.76 [95% CI, .65–.88]). This finding remained significant after adjusting for the 6 possible pairwise comparisons using the Bonferroni correction. Our finding did not change after including the 31 HCP who had lab-confirmed A(H1N1)pdm09 influenza in 2010–2011.
Site-specific models showed that the direction of this effect modification was similar at both sites, and was statistically significant at SWH (ARR, 0.77 [95% CI, .64–.89]) but not at KPNW (ARR, 0.79 [95% CI, .42–1.29]. Among those with preseason HI < 40, end-of-season HI ≥ 40 was much less common in those who received both TIV and MIIV (15%) vs those receiving only TIV (63%) (Table 2).
Secondary Analyses
Among the 834 vaccinated HCP with all 3 sera, the mean fold-change in HI titers was highest among those with preseason HI < 10 (Table 3). Post-TIV serum HI ≥ 40 was acquired in more than half of HCP with preseason HI < 10 (61%) and HI 10 to <40 (79%). However, at end-of-season, these proportions dropped to 35% and 43%, respectively. In contrast, 96% of those with preseason HI ≥ 40 remained so through end-of-season (Table 3). Among these 834 vaccinated HCP, history of receipt of MIIV was associated with lower HI GMTs for post-TIV and end-of-season regardless of preseason HI GMTs (Figure 1). This finding was seen at both sites but was more pronounced at SWH (Supplementary Figure 2).
Changea in 2009 A(H1N1) Pandemic Influenza Virus Hemagglutination Inhibition Antibody Titers After 2010–2011 Trivalent Inactivated Influenza Vaccine by 3 Levels of Preseason Titers Among 834 Healthcare Personnel With All 3 Serum Samples
| Change in HI Titer | Preseason HI < 10 (n = 398 [48%]) | Preseason HI 10 to <40 (n = 235 [28%]) | Preseason HI ≥ 40 (n = 201 [24%]) |
|---|---|---|---|
| HCP with seroconversionb at post-TIV | 61% | 66% | 33% |
| Mean (95% CI) fold change of HI titers from preseason to post-TIV | 32 (26–37) | 15 (11–18) | 4 (3–5) |
| HCP with HI titer ≥40 at preseason, post-TIV, and end-of-season | 0%; 61%; 35% | 0%; 79%; 43% | 100%; 99%; 96% |
| GMT (geometric SD) of HI titers at preseason, post-TIV, and end-of-season | 5 (1); 49 (5); 18 (4) | 14 (1); 81 (4); 30 (3) | 69 (2); 162 (2); 86 (2) |
Abbreviation: CI, confidence interval; GMT, geometric mean titer; SD, standard deviation; HCP, healthcare personnel; HI, hemagglutination inhibition; TIV, trivalent inactivated vaccine.
a Change in HI titers among 2010–2011 TIV vaccinees is described from preseason serum to post-TIV and end-of-season.
b Seroconversion was defined as a preseason serum HI titer <10 and a post-TIV serum HI titer ≥40 or a preseason titer ≥10 and a minimum 4-fold rise in HI antibody titer for post-TIV sera.
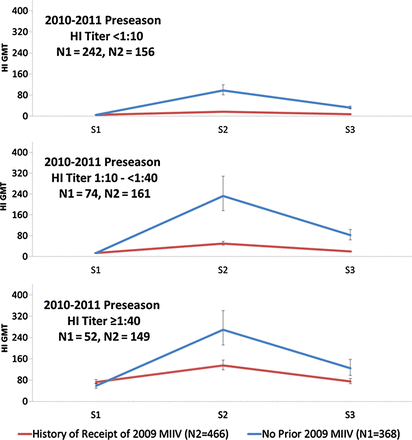
Influenza A(H1N1)pdm09 hemagglutination inhibition antibody (HI) geometric mean titer (GMT) at 2010–2011 preseason (S1), about 30 days post–trivalent inactivated vaccine (TIV) (S2), and end-of-season (S3) among 834 TIV recipients, by those who received 2009 A(H1N1)pdm09 monovalent inactivated influenza vaccine (MIIV) vs those not vaccinated during the prior season and stratified by 2010–2011 preseason HI titers.
Table 4 presents the descriptive characteristics of 865 HCP who received TIV by receipt or not of prior MIIV, including high-risk conditions and PCR-confirmed H1N1 infections in 2010–2011. The preseason HI GMTs of those with no prior MIIV were significantly lower than those receiving 2009–2010 MIIV. When we controlled for preseason HI titers in the logistic regression models, even though HI ≥ 40 post-TIV and end-of-season was associated with preseason baseline titers, the effect of receipt of 2009–2010 MIIV on HI titers noted in Table 2 increased (data not shown).
Descriptive Characteristics at 2010–2011 Preseason Baseline for 865 Eligible Enrolled Healthcare Personnel Who Received 2010–2011 Trivalent Inactivated Vaccine, by Receipt of 2009 A(H1N1) Pandemic Monovalent Inactivated Influenza Vaccine
| Characteristic | No 2009–2010 MIIV and Yes 2010–2011 TIV Vaccinees With Post-TIV Serum (S2), n = 376 | Both 2009–2010 MIIV and 2010–2011 TIV Vaccinees With Post-TIV Serum (S2), n = 489 | P Value |
|---|---|---|---|
| Descriptive characteristics | |||
| Demographics | |||
| Age, y | 39 (11) | 46 (11) | <.001 |
| Age group | |||
| 18–34 y | 171 (45%) | 108 (22%) | <.001 |
| 35–49 y | 130 (35%) | 170 (35%) | |
| 50–65 y | 75 (20%) | 211 (43%) | |
| Female | 314 (84%) | 398 (81%) | .418 |
| White | 281 (75%) | 415 (85%) | <.001 |
| Hispanic | 58 (15%) | 41 (8%) | .001 |
| Health | |||
| Body mass index, kg/m2 | 28 (7) | 29 (7) | .398 |
| Subjective health status (1–5) | 4.1 (0.7) | 4.1 (0.7) | .790 |
| HCP with high risk condition(s) in 2009–2010 | 115 (31%) | 201 (41%) | .001 |
| Chronic lung diseasea | 20 (5%) | 56 (11%) | .002 |
| Malignancy | 11 (3%) | 30 (6%) | .028 |
| Proxies for exposure to infection | |||
| HCP with ≥1 MAARI during 2009 A(H1N1)pdm | 31 (8%) | 75 (15%) | .002 |
| HCP with ≥1 MAARI during 2010–2011 influenza season | 35 (9%) | 54 (11%) | .405 |
| Household size | 2.2 (1.5) | 2.0 (1.5) | .049 |
| Hours of direct patient care per week | 32.8 (11.3) | 31.0 (10.8) | .001 |
| Emergency department HCP | 108 (29%) | 94 (19%) | .001 |
| Site | |||
| Kaiser Permanente Northwest | 44 (12%) | 242 (49%) | <.001 |
| Scott & White Healthcare | 332 (88%) | 247 (51%) | |
| Timing of sera collection | |||
| No. of days from S1 to 2010–2011 TIV | 18 (14) | 13 (12) | <.001 |
| No. of days from 2010–2011 TIV to S2 | 29 (8) | 32 (8) | <.001 |
| Influenza vaccination history | |||
| 2009–2010 seasonal influenza (TIV or LAIV) vaccination | 292 (78%) | 444 (91%) | <.001 |
| No. of days from 2009 MIIV to 2010–2011 TIV | NA | 245 (20) | NA |
| Preseason/baseline HI | |||
| GMT of 2009 A(H1N1)pdm HI titers | 8.7 (2.5) | 16.4 (3.3) | <.001 |
| Ordinalb 2009 A(H1N1)pdm HI titers | 0.8 (1.3) | 1.7 (1.7) | <.001 |
| PCR-confirmed H1N1 infection in 2010–2011 | 1 (0.3) | 4 (0.8) | .3948 |
Data are presented as mean (SD) or No. (%). Bolded: Statistically significant difference in means or proportions with P < .05.
Abbreviations: GMT, geometric mean titer; HI, hemagglutination inhibition antibody; HCP, healthcare personnel; LAIV, live attenuated influenza vaccine; MAARI, medically attended acute respiratory illness; MIIV, 2009 A(H1N1) pandemic monovalent inactivated influenza vaccine; NA, not applicable; PCR, polymerase chain reaction; TIV, trivalent inactivated vaccine .
a High-risk condition categories compared included pregnancy, chronic lung, heart, kidney, bladder, liver, neurological/musculoskeletal, immunodeficiency, malignancy, endocrine/diabetes, and metabolic conditions. Only statistically significant comparisons are shown.
b Ordinal antibody levels are represented with 0–9 levels based on log transformation of the HI titer: Log2 (HI titer/5).
The linear mixed-effects model included 2502 HI titers, 3 for each of 834 vaccinated HCP (who provided all 3 serum samples). The model confirmed results from our primary analyses (data not shown). After controlling for covariates, those receiving MIIV had higher preseason ordinal HI level (GMT ratio estimate: 2.31) than those who had not (Table 5). However, they also had lower ordinal HI level (GMT ratio estimates: 0.57 and 0.74 for post-TIV and end-of-season, respectively), than those who had not.
Comparison of Serum Ordinala Hemagglutination Inhibition Antibody Levels Against 2009 Influenza A(H1N1) Pandemic Virus Among 834 Healthcare Personnel With Preseason, Post–Trivalent Inactivated Vaccine, and End-of-Season Serum Samples in 2010–2011 From the Linear Mixed-Effects Model, by Vaccination Status
| Comparison Between Groups | Mean Difference Estimate | Standard Error | P Value | GMT Ratio Estimate (95% CI)b |
|---|---|---|---|---|
| MIIV vs No prior MIIV on day of receipt of 2010–2011 TIVc | 1.2056 | 0.1368 | <.0001 | 2.31 (1.92–2.78) |
| MIIV vs No MIIV 31d days post-TIV | −0.8088 | 0.1373 | <.0001 | 0.57 (.47–.69) |
| MIIV vs No MIIV 198e days post-TIV | −0.4383 | 0.1398 | .0017 | 0.74 (.61–.89) |
Abbreviations: CI, confidence interval; GMT, geometric mean titer; MIIV, 2009–2010 A(H1N1) pandemic monovalent inactivated influenza vaccine; TIV, trivalent inactivated vaccine.
a Ordinal hemagglutination inhibition antibody (HI) levels are represented with 0–9 levels based on log transformation of HI titers: Log2 (HI titer/5).
b GMT ratio estimate was calculated by 2 to the power of mean difference estimate. The 95% CI was calculated by 2 to the power of mean difference estimate ± 1.96 × Standard Error.
c Day 0: date of receipt of 2010–2011 TIV (used as proxy for preseason, adjusting for days from preseason serum to TIV receipt).
d Day 31: mean number of days from 2010–2011 TIV to post-TIV serum.
e Day 198: mean number of days from 2010–2011 TIV to end-of-season serum.
There was no significant difference in preseason HI titers for HCP receiving 3 major TIV lots (at KPNW: lot A, n = 238; at SWH: lot B, n = 291 and lot C, n = 221). However, mean fold change in HI titer from preseason to post-TIV serum samples was significantly lower for HCP with preseason HI < 10 for KPNW lot A (mean, 7.4 [95% CI, 5.0–9.9]) when compared with SWH lot B (mean, 50.4 [95% CI, 39.2–61.7]) or lot C (mean, 37.1 [95% CI, 22.7–51.5]). Similarly, the mean fold change in HI titer was significantly lower for KPNW lot A recipients with preseason HI titers of 10 to <40 but not for those with preseason HI ≥ 40 (data not shown). These differences may partly be related to participant characteristics at KPNW site (Supplementary Table 1).
DISCUSSION
In our prospective HCP cohort, the effect of the 2010–2011 TIV on maintaining a serum HI titer ≥ 40 against influenza A(H1N1)pdm09 at end-of-season was modified by the receipt or no receipt of 2009–2010 MIIV; receipt of MIIV also significantly reduced the odds of achieving a post-TIV HI ≥ 40 approximately 30 days after receipt of 2010–2011 A(H1N1)pdm09-containing TIV. The inverse association between MIIV vaccination and HI ≥ 40 remained after adjusting for other covariates including time to serum collection, age, and site.
When HI titers were measured at end-of-season, compared to those who had never received any A(H1N1)pdm09-containing vaccine, HCP who were vaccinated both seasons had significantly higher probability for maintaining HI ≥ 40. However, those vaccinated with TIV in 2010–2011 but not MIIV in 2009–2010 ended the season with significantly higher odds of HI ≥ 40 than HCP vaccinated both seasons. Thus, HCP who were naive to the A(H1N1)pdm09 vaccine antigen in 2010–2011 had the best HI response post-TIV and at end-of-season.
We noted similar trends for seroconversion post-TIV, and these effects were expected and noted at both study sites (data not shown). Periodically, there have been reports of reduced immunogenicity and effectiveness associated with consecutive annual vaccination [9–15]. Nabeshima et al [15] found lower immunogenicity of revaccination in 2003 among Japanese HCP compared with those unvaccinated in 2002, unrelated to prevaccination HI titers [15]. Other studies have reported better serologic response among previously unvaccinated adults [13, 35–37] although findings regarding revaccination and vaccine effectiveness have been mixed [38, 39].
One explanation for variation in immunogenicity could be a limited B-cell immune response to revaccination. During 2005–2006, Sasaki et al [40] examined the effect of prior vaccination on antibody and B-cell responses in adults receiving different vaccines the prior year: LAIV, TIV, or neither. Serum antibody and effector and memory B-cell responses were greater in TIV recipients than in LAIV recipients. Prior-season TIV recipients had significantly higher preseason HI titers, but lower HI response after vaccination with either TIV or LAIV in the study season compared with those who were not vaccinated during the previous season. These subjects also had a lower effector B-cell (antibody-secreting cell) response to new TIV but not LAIV. A possible mechanism is that some of the injected hemagglutinin protein in TIV could form antigen–antibody complexes with preexisting HI antibodies, which could reduce the amount of HI antigen available for stimulating B cells [40]. In our study, we observed differences in HI antibody response based on receipt of MIIV even in participants with preseason HI < 10, suggesting that HCP with HI < 10 despite prior MIIV were primary vaccine nonresponders who were also less likely to respond to repeat vaccination. We speculate that this nonresponse may be related to exhaustion of memory B cells from prior influenza infections.
Another explanation is the “antigenic distance hypothesis” [41]. By comparing the predictions from a computer model to 7 influenza outbreaks from 2 studies [9, 42], Smith et al [41] accurately predicted year-to-year variations in vaccine efficacy, and specifically predicted that revaccination would negatively interfere with serologic response when the antigenic distance between strains in consecutive vaccines is small. Because MIIV and 2010–2011 TIV contained an identical A(H1N1)pdm09 antigen, this theory would predict lower response among those receiving a second annual vaccination with A(H1N1)pdm09, which fits what we observed.
In a recent report of T-cell and antibody responses against influenza A(H1N1)pdm09, similar CD8 recall T-cell responses to H1N1 from 1934 and 2009 implied cross-reactive T-cell responses [43]. Almost 60% of a Toronto cohort had cross-reactive memory T-cell responses to influenza virus at 1 year after the pandemic. The size of the long-lived pandemic H1N1-reactive memory T-cell pool was not different between infected, vaccinated, and unvaccinated individuals, suggesting that the memory T-cell response increased only transiently postinfection and was not boosted by adjuvanted MIIV. On the basis of the findings in a single donor, the authors postulate that these T cells could expand significantly postinfection. Also, 46% of vaccinated and 15% of unvaccinated donors from their seroprevalence cohort had HI ≥ 40 during summer 2010, suggesting that antibody levels were not maintained at high levels postvaccination/infection. Similar to our HCP cohort, those vaccinated with 2009–2010 MIIV were more likely to have preseason HI ≥ 40 compared with those unvaccinated in their entire cohort [43].
HCP characteristics and TIV vaccines used differed at the 2 sites. The major TIV lot from KPNW was associated with lower mean fold-change postvaccination for those with low or intermediate HI titers at preseason compared with the response to the 2 lots from SWH. This effect was at least partially mediated by KPNW HCP characteristics and does not impact the interpretation of our results overall. This is so because when we stratified analyses by site, the same inverse association between receipt of MIIV and HI response to subsequent TIV was found, statistically significant for SWH albeit not for KPNW.
The proportion of HCP with preseason HI ≥ 40 against A(H1N1)pdm09 was 14% among 819 HCP not receiving MIIV, suggesting that some had past infection (or cross-reactive antibody). Our finding is similar to previous studies reporting 19% of emergency department providers who had HI ≥ 40 after the first wave [44] and to an estimated 20% of the US population infected with A(H1N1)pdm09 prior to the 2010–2011 season [45].
Randomized clinical trials reported that 90%–100% of healthy adults had HI ≥ 40 post-MIIV [16–20]. For our cohort, the proportion of HCP with HI ≥ 40 after A(H1N1)pdm09-containing TIV was 74% (95% CI, 71%–77%) overall; 85% (95% CI, 81%–88%) among those who had only TIV and 66% (95% CI, 61%–70%) among those who had both MIIV and TIV. However, the overall proportion we observed is higher than that reported for HCP in Hong Kong [46] of 54% (95% CI, 44%–63%) and in Japan [47] of 38% (95% CI, 33.2%–42.9%) after receipt of 1 unadjuvanted MIIV dose. What we observed is closest to HI ≥ 40 of 80% among HCP in the Netherlands, after 1 MF-59 adjuvanted MIIV dose [48].
Strengths of our study include its large sample size, and the ability to compare findings across study sites and major vaccine lots. There are also several limitations to our study. First, although HI ≥ 40 is considered a surrogate marker of protection for licensure of influenza vaccines [29, 34], its association with vaccine effectiveness is limited and the clinical meaningfulness of the differences we observed is unknown. Second, the observational nature of this study introduced differences in timing of blood draws, site, and participant characteristics, which could only be adjusted for statistically in multivariate models and by subsetting our data by site. Because HCP aged ≥50 years and those with high-risk conditions are more likely to be revaccinated, we cannot rule out residual confounding. Although we included medically attended acute respiratory illness as a covariate in models, we are limited by variable prior exposure to influenza viruses and vaccines, and underlying health and immunologic status of our participants. Other potentially serious limitations include selection bias, as MIIV or TIV recipients were not randomized, and possible variable potency of many lots of 2009–2010 MIIV. There are possibly other unknown biases inherent to any nonrandomized study.
Additional study is needed to ascertain if our finding of lower immunogenicity to A(H1N1)pdm09 antigen with second annual inactivated vaccination applies to other antigens or LAIV. Whether or not lower HI titers have clinical significance also requires further research, through vaccine-effectiveness studies, especially among HCP. Finally, although annual vaccination for HCP remains a safe and effective prevention strategy [2, 24, 49], the imperfect immune response and afforded protection [38, 39] imply that HCP should remain vigilant for wintertime respiratory illness irrespective of vaccination history to limit transmission of influenza to their patients.
Notes
Acknowledgments. The authors thank the following persons at the Influenza Division, National Center for Immunization and Respiratory Diseases, CDC, for critical review of this manuscript: Joe Miller, PhD; Jackie Katz, PhD; David Shay, MD, MPH; Alicia Fry, MD, MPH; Joe Breese, MD; and Jerry Tokars, MD. We appreciate the research teams at Scott & White Healthcare, Kaiser Permanente Center for Health Research, and Abt Associates. We also thank the healthcare personnel in direct patient care at the study sites who volunteered to participate in this study.
Disclaimer. The findings and conclusions in this report are those of the authors and do not necessarily represent the views of the CDC, Abt Associates, Inc, Kaiser Permanente Center for Health Research, or Scott & White Healthcare.
Financial support. This work was supported by the CDC (contract 200-2010-F-33396 to Abt Associates Inc). This research was supported in part by an appointment to the Research Participation Program at the CDC administered by the Oak Ridge Institute for Science and Education through an interagency agreement between the US Department of Energy and the CDC.
Potential conflicts of interest. M. G. has received research funding from MedImmune and Novartis, and A. N. has received research funding from GlaxoSmithKline. All other authors report no potential conflicts.
All authors have submitted the ICMJE Form for Disclosure of Potential Conflicts of Interest. Conflicts that the editors consider relevant to the content of the manuscript have been disclosed.

