


Abstract
When resources are limited, mean fitness is constrained and competition can cause genes and phenotypes to enhance an individual’s own fitness while reducing the fitness of their competitors. Negative social effects on fitness have the potential to constrain adaptation, but the interplay between ecological opportunity and social constraints on adaptation remains poorly studied in nature. Here, we tested for evidence of phenotypic social effects on annual fitness (survival and reproductive success) in a long-term study of wild North American red squirrels (Tamiasciurus hudsonicus) under conditions of both resource limitation and super-abundant food resources. When resources were limited, populations remained stable or declined, and there were strong negative social effects on annual survival and reproductive success. That is, mean fitness was constrained and individuals had lower fitness when other nearby individuals had higher fitness. In contrast, when food resources were super-abundant, populations grew and social constraints on reproductive success were greatly reduced or eliminated. Unlike reproductive success, social constraints on survival were not significantly reduced when food resources were super-abundant. These findings suggest resource-dependent social constraints on a component of fitness, which have important potential implications for evolution and adaptation.
Genetic variation in fitness is foundational to the process of adaptive evolution (Shaw and Shaw 2014). For any trait to adaptively evolve, the Price equation indicates that the trait must genetically covary with fitness (Price 1970), which requires that there is additive genetic variance in fitness (Price 1972; Frank and Slatkin 1992; Burt 1995; Frank 1997; Hadfield et al. 2011). In the absence of a change in the environment, we might expect the presence of genetic variance in fitness to lead to the evolution of increased mean fitness (i.e., adaptation: Fisher 1930). However, there are circumstances in which the environment ought to, and in some cases must, counterbalance an evolved increase in mean fitness such that overall mean fitness does not change across generations (Fisher and McAdam 2019).
When organisms interact socially, the phenotype of one individual is affected by the phenotype and genotype of the individual(s) with whom it interacts (Moore et al. 1997; Wolf et al. 1999; McGlothlin et al. 2010). While the term “social” often implies close physical interactions (Whitehead 2008), individuals can affect one another’s phenotypes even in the absence of direct physical interactions (e.g., maternal oviposition effects Crespi and Lessig 2004; extended phenotypes: Fisher et al. 2019a). Indirect genetic effects (IGEs) represent the genetic component of these social effects on phenotypes and can be defined as the effect of one individual’s genotype on another individual’s phenotype (Moore et al. 1997; Wolf et al. 1999; McGlothlin et al. 2010). IGEs provide an additional source of evolutionary potential that can affect the rate and direction of evolution (Wolf et al. 1999; Bijma and Wade 2008). Importantly, IGEs on fitness often tend to constrain the adaptive increase in mean fitness when interacting organisms compete for limited resources (Wolf 2003; Bijma et al. 2007; Wilson 2014; Fisher and McAdam 2019). If fitness is considered a trait influenced by social interactions, then conspecifics influence each other’s fitness as (Bijma 2011):
where individual i’s fitness (Wi) can be modeled based on the population mean fitness (µ), and deviations from this mean due to individual i’s direct competitive ability (Ci), the sum of social effects of all n individuals with whom it interacts (), and an environmental component (Ei: Bijma 2011). Based on this representation of fitness as a trait, we can predict the rate of change of mean fitness across generations due to the evolution of fitness following Bijma (2011) as:
where represents the covariance between direct and IGEs on fitness multiplied by the number of individuals with whom a focal individual interacts (n). This notation makes clear that an evolutionary increase in mean fitness caused by genetic variance in fitness () will be reduced by a negative covariance between direct and IGEs on fitness (). In some cases, can be large enough to completely counterbalance or even reverse the evolutionary increase in mean fitness that we might otherwise expect based on genetic variance in fitness (Bijma and Wade 2008; Fisher and McAdam 2019; Fisher and Pruitt 2019) and represent a form of social-environmental deterioration (sensuFisher 1930). This covariance represents the degree to which genes affecting an individual’s own fitness (direct effects) also affect the fitness of others with whom the focal individual interacts socially (indirect effects). A positive covariance indicates that genes affecting an individual’s own fitness affect the fitness of others in the same direction. In contrast, a negative indicates that genes that positively affect an individual’s own fitness detract from the fitness of others (and vice versa).
In dyadic competition over a limited resource, direct effects on resource acquisition must be perfectly balanced by indirect effects on the resource acquisition of the competitor because resource acquisition is zero-sum (Wilson et al. 2011). For example, in interactions between red deer (Cervus elaphus) any genes that enhance the probability of an individual winning in a dyadic encounter will necessarily detract from the probability of the competitor winning (Wilson et al. 2011). The mean probability of winning a dyadic encounter cannot evolve; there must always be one winner and one loser. In such a scenario, there must be a negative association between direct genetic effects on the probability of winning and the IGEs on the conspecific in the competitive dyad interaction, which is what Wilson et al. (2011) found empirically. By extension, when individuals compete for fitness then will be negative—genes that enhance an individual’s fitness will detract from the fitness of its competitors (Matsuda and Abrams 1994; McGlothlin and Fisher 2021). In this way, a negative for fitness acts as “social evolutionary resistance” to a perpetual increase in mean fitness in the presence of genetic variance in fitness (Equation 2). When fitness is an absolutely limited resource (i.e., completely zero-sum) the negative will be strong enough to completely counterbalance the increase in mean fitness (Equation 2) that we would otherwise expect to evolve based on genetic variance in fitness (Bijma 2010a; Hadfield et al. 2011; Queller 2014; Fisher and McAdam 2019). The degree to which fitness is zero-sum will, therefore, be reflected in the magnitude of . Equation 2 highlights the importance of to adaptation (i.e., the change in mean fitness over generations), and begs the question: when do we expect fitness to be absolutely constrained (i.e., where IGEs perfectly counterbalance DGEs and we see no adaptation) and when is fitness no longer zero-sum?
Although we can conceptualize fitness in many ways (Hendry et al. 2018), it is often convenient to represent it as an individual’s annual or lifetime contribution of offspring to the population (Lande and Arnold 1983). Lifetime reproductive success (LRS) and its annual counterpart (annual reproductive success [ARS]) are useful measures of fitness because they can be measured empirically and they directly connect an individual’s fitness to population growth (Coulson et al. 2006). In the context of LRS, mean fitness refers to the population growth rate at the scale of a generation. For ARS and annual adult survival (hereafter, survival), changes in the mean fitness of these 2 measures represent intrinsic population growth rate at the annual scale. Evolutionary changes in these measures of mean fitness will, therefore, have direct ecological consequences for population growth rates (Pelletier et al. 2007; Travis et al. 2013).
From an ecological perspective, population size is constrained and thus fitness is zero-sum at carrying capacity. That is, any increase in fitness for one individual requires a decrease in fitness for another individual. At carrying capacity, increases in mean fitness that would otherwise occur through DGEs are completely counter-balanced by the negative covariance between IGEs and DGEs (denoted as in Equation 2), similar to the outcome of dyadic encounters. This does not require direct combat over resources. This relationship simply must be true if the population size is to remain stable (i.e., at carrying capacity). In contrast, when populations are below carrying capacity, fitness is no longer zero-sum and individuals can recruit offspring and survive from year-to-year without necessarily detracting from the fitness of conspecifics. In the extreme case where resources are unlimited, an individual’s fitness can in principle be completely independent of the fitness of others. When fitness is no longer zero-sum (i.e., a growing population), DGEs on fitness might not necessarily be offset by a negative covariance between DGEs and IGEs, and mean fitness can evolve across generations. We would, therefore, predict the presence of a strongly negative for fitness when populations are at their carrying capacity, but that this social constraint on adaptation (increase in mean fitness across generations) would be relaxed in populations that are below the carrying capacity set by available resources. These predictions have yet to be tested empirically.
Here, we tested for the presence of social effects on fitness in a population of North American red squirrels (Tamiasciurus hudsonicus, hereafter “red squirrels”). Although we quantified phenotypic rather than genetic social effects on fitness, these estimates provide an important first step toward testing the importance of social genetic constraints on adaptation in the wild. Red squirrels are a useful wild model for addressing these questions because they live on exclusive territories (Smith 1968) and as a result, we can quantify their spatial position relative to competitors. Their territorial social system also imposes some degree of density-dependence (Steury and Murray 2003; Lamontagne et al. 2013). Red squirrels in our study system feed primarily on the seeds of white spruce (Picea glauca) cones (Fletcher et al. 2013). White spruce is a masting species that produces very large cone crops every 4–7 years (i.e., mast years) interspersed with non-mast years when few cones are produced (Lamontagne and Boutin 2007). During mast years, red squirrel populations approximately double in size, but typically decline during non-mast years (McAdam et al. 2019). Thus, non-mast years represent years in which fitness is likely to be zero-sum, whereas this absolute constraint on fitness is weakened during mast years when resources are abundant and population growth rates increase dramatically. Within our system, carrying capacity fluctuates based on the availability of resources, where populations during non-mast years exist at a relatively low carrying capacity due to limitations in food availability. By contrast, the super-abundance of food in mast years relieves the population from the constraints that maintain relatively low carrying capacity in other years. In addition, the swamp and starve effects of repeated mast events (Fletcher et al. 2010; McAdam et al. 2019) tend to result in mast years occurring when squirrel densities are low, whereas non-mast years tend to occur when squirrel densities are higher (Dantzer et al. 2020).
We, therefore, tested the hypothesis that social effects on fitness are density-dependent using annual measures of fitness (ARS, annual survival). We predicted that during non-mast years, in which population density tends to be high and populations remain stable or decline, mean ARS and survival would be lower (ecological effect on fitness), but also that there would be strong negative social effects on ARS and survival (social effects on fitness; Table 1). That is, an individual’s survival and reproductive success in non-mast years would be negatively affected by the survival and reproductive success of other squirrels in the population. Second, during resource-rich mast years when populations are generally smaller but exhibit large increases in population growth due to an elevated carrying capacity, we expected mean ARS and survival to be higher, but also social effects on ARS and survival to be much weaker or absent (Table 1).
Summary of predictions
| Year | Visual depiction | Ecological context | Evolutionary expectations |
|---|---|---|---|
| Non-mast | Prediction 1: during non-mast years (high density), a focal individual’s (orange squirrel) fitness (brown squirrels) is negatively affected by fitness of other squirrels (blue squirrels) | • Food resources are limited • Populations tend to be large, but declining | The effect of one individual’s ability to obtain resources and convert them into survival and reproduction will come at the expense of another individual being able to use those resources to convert them into fitness. • Fitness is zero-sum • Strong negative social effects on fitness |
| Mast | Prediction 2: during mast years (low density), a focal individual’s (orange squirrel) fitness (brown squirrels) is minimally affected by the fitness of other squirrels (blue squirrels) | • Food resources are unlimited • Populations tend to be small but increase rapidly (~2×) between a mast year and the next year | An individual’s ability to obtain resources and convert them into survival and reproduction is no longer constrained by the fitness of competitors. • Fitness is not zero-sum • Social effects on fitness are weak or absent |
Methods
Study Area and Subjects
Individually marked red squirrels were studied within the traditional territories of the Champagne and Aishihik First Nations in the southwest Yukon Territory of Canada between 1989 and 2020. During this time, we studied squirrels in up to 6 study areas (Dantzer et al. 2020), but here we focus on 2 study areas that have been monitored consistently and without experimental manipulation during this entire period (Kloo and Sulphur). These study areas are separated by the Alaska Highway but do not function as distinct biological populations.
During the spring and summer of each year, we monitored the survival and reproduction of individually marked squirrels using regular live-trapping (McAdam et al. 2007; Dantzer et al. 2020). Squirrels were marked with unique alphanumeric ear tags and unique combinations of colored wires to discriminate individuals from a distance. Red squirrels defend exclusive individual territories throughout the year and with the exception of females occasionally bequeathing their territory to one of their offspring (Price and Boutin 1993; Berteaux and Boutin 2000; Lane et al. 2015), they defend this same territory for their entire life. Territory size varies in response to pulses of food resources, but adult territory sizes are on average ~0.3–0.4 ha (Lamontagne et al. 2013). As part of our long-term monitoring protocols, we censused the entire population and recorded the location of each individual’s primary cache of spruce cones (midden) in May of each year. A squirrel’s primary midden is usually located near the center of its territory, so we used this midden location as a measure of the spatial location of each individual within the population each year.
Annual survival of each individual was tracked through regular behavioral observations and live-trapping. Previous mark-recapture analyses have indicated that our protocols result in a detection probability that does not differ from 1 (Descamps et al. 2008a) whereby the disappearance of adults can reasonably be inferred to represent their death. Survival was measured for each individual alive on May 15th of each year based on whether or not they survived a further 200 days. Our seasonal monitoring protocols mean that this de facto represents survival to the next spring.
Regular live-trapping of females allowed us to track the progressive increase in weight and sudden decline in weight and onset of lactation that is indicative of pregnancy and parturition. Nests were located through behavioral observations and radio-telemetry and pups were temporarily removed from their natal nest to count, sex, mark, and weigh them soon after birth (McAdam et al. 2007). This procedure was repeated again at approximately 3 weeks of age, at which point offspring are old enough to be permanently marked with unique metal ear tags. This allowed us to track the survival of all offspring from birth until their death or disappearance from the population. We measured female ARS as the total number of offspring produced that survived until the following spring (>200 days of age), which represents recruitment. Here, we considered ARS to represent the number of recruited pups summed across all litters produced during a given year. Red squirrels typically produce only a single litter per year (McAdam et al. 2007), but occasionally attempt a second litter if their first litter fails (Williams et al. 2014), or following a successful first litter if it is a mast year (Boutin et al. 2006). This measure of fitness mixes offspring (survival) and maternal fitness (fecundity), which can be problematic for quantitative genetic predictions (Wolf and Wade 2001; Thomson and Hadfield 2017), but ARS has the benefit of representing a female’s contribution to annual population growth through fecundity.
Social Interactions
We were interested in how the survival and reproductive success of squirrels were affected by the survival and reproductive success of other individuals in the population with whom they interact. Although red squirrels defend exclusive territories, they interact or compete with one another with respect to offspring recruitment through the process of juvenile dispersal. During dispersal and settlement, offspring interact and compete for vacant territories more intensely with other offspring born nearby than they would interact with offspring born farther away. ARS can also be affected by where other squirrels die. For example, if a female’s neighbor dies then this creates a vacancy in which her offspring might settle, potentially enhancing her ARS. Alternatively, if an individual dies 500 m away, it is less likely that this female’s offspring will secure this vacancy, so this mortality will be unlikely to affect her ARS. We, therefore, operationalized the strength of social interaction between any 2 squirrels over fitness based on the distance between their territories weighted by the observed distribution of juvenile dispersal distances in these populations. Observed juvenile dispersal distances in both study areas were measured as the linear distance between the natal location and recruitment location of 1012 non-philopatric juveniles born between 1989 and 2019 (Supplementary Figure S1). From these observed dispersal distances, it is clear that offspring born within 100 m of one another have a higher probability of settling in the same location and thus affecting the ability of the other to recruit in that same location than individuals born 400 m apart, for example. Similarly, a territory vacancy that arises because of adult mortality 100 m from a female’s territory is much more likely to be acquired by one of her offspring than a vacancy 400 m away. As such, we used the distance between 2 squirrels in the population to calculate the proportion of this juvenile dispersal distribution that fell beyond this distance as a measure of the strength of social interaction for fitness between these 2 squirrels.
We, therefore, weighted the survival and reproduction of other individuals in the population using the following equation:
Here, the social effect experienced by focal individual i is represented by , which is the sum of all n−1 interactions with each other individual j within the population. The strength of each pairwise social effect was based on the fitness of the social partner, , weighted by the proportion of the juvenile dispersal kernel that fell beyond the linear distance between the focal individual, i, and its social partner j, . The fitness of the social partner could represent their survival (0, 1) or female reproductive success (number of recruited offspring). Although males sire offspring, they do not produce offspring that disperse from their territory and compete with other juveniles for territory vacancies. As such, females do not compete with males for limited female reproductive success, so all males were scored as zero for the effect of their reproductive success on other squirrels. As a result, a female living near only males would experience weak competition for ARS similar to what she would experience if she were living near unsuccessful females.
Although there is no direct interference competition for survival as there might be for reproductive success in this territorial social system, a focal individual’s survival might be affected by the survival of other individuals in 1 of the 2 ways. First, the survival of nearby conspecifics might result in greater local resource competition or intruder pressure (Donald and Boutin 2011; Dantzer et al. 2012; Siracusa et al. 2021). Alternatively, mortality of nearby conspecifics might not only reduce local competition, but cached resources left undefended through the mortality of the territory owner become available for pilferage (Gerhardt 2005; Donald and Boutin 2011). For example, in temporary experimental removals of territory owners, neighbors began pilfering food an average of ~56 min from when the territory owner was removed (Siracusa et al. 2017). These short-term benefits of nearby mortalities are likely to be offset to some extent by longer-term costs due to reduced familiarity with neighbors following the settlement of new individuals on nearby vacancies (Siracusa et al. 2021), but these costs would manifest through reduced ARS or survival in subsequent years or perhaps reduced LRS (Siracusa et al. 2021) and not immediate reductions in ARS or survival in the year of the mortality. As a result, we expect a short-term benefit to ARS and the survival of nearby mortalities. The survival of a focal individual might, therefore, be either disadvantaged by the survival of nearby conspecifics or advantaged by the mortality of nearby conspecifics, which would provide undefended food resources that could be pilfered. Differentiating these 2 processes is important because they need to be modeled separately.
In our main analysis, we scored the survival of other squirrels in the population as survived (0.5) and died (−0.5). We used this coding because it allowed the survival of both the squirrels that died and the squirrels that survived to be weighted by the distance between them (Equation 3). In the Supplementary Material, however, we also report results for 2 alternative ways for coding survival that have different interpretations. In the second scenario, the survival of other squirrels was coded using the more traditional coding of survived = 1 and died = 0. In this case, the distance between squirrels that died and the focal individual is not considered because the product of “distance” and zero (i.e., mortality) is always zero. As a result, this coding considers only the costs to survival through local resource competition. That is, it matters how close surviving individuals were. In a third scenario, we considered complementary models in which we distance-weighted the location of squirrels that died (i.e., it matters how far away the mortalities are but the distance to survivors is irrelevant) by instead coding the survival of conspecifics as survived (0) and died (−1). This coding of survival maintained the direction of the effect of conspecific survival but distance-weighted mortalities of conspecifics rather than distance-weighting the locations of survivors.
All measurements of social effects of other individuals within the population were standardized (mean = 0, SD = 1) within grid-year combinations prior to analysis. Since juveniles cannot usurp territories from adult territory owners (McAdam et al., personal observations), there is no mechanism by which the reproductive success of other individuals might affect the survival of focal individuals, so we did not consider this possible social effect.
Statistical Analyses
We tested for social effects on fitness using generalized linear mixed models using the lme4 package (Bates et al. 2015) in R version 4.0.2 (R Core Team 2020). In all cases, the fitness of the focal individual was fitted as the response variable. Survival was fitted using binomial models (logit link) and female ARS was fitted using Poisson models (log link). All models contained the same base fixed effect structure, where we included a linear and quadratic effect of the age of the focal individual to account for senescent effects on fitness (Descamps et al. 2008b; Siracusa et al. 2021). In addition, we controlled for differences between the 2 study areas by fitting the identity of the study area as a fixed effect. In all models, we also fitted the identity of the squirrel and year as random effects. We tested our overall hypothesis that social effects on fitness would be negative in non-mast years but reduced or absent during mast years by fitting an interaction between the social effect on fitness and whether or not it was a mast year (mast).
Mast years were 1993, 1998, 2005, 2014, and 2019. In addition to the random effects of squirrel identity and year, we also included random social effects among years. These random social effects (slopes) were assumed to be uncorrelated with the random year effects (intercepts). In 2 models (Supplementary Tables S2 and S4), the among-year variance in the social effect was very small and these models did not converge but the parameters and inferences of these models did not differ from the simpler models in which the random social effect among years was not fitted (not shown). In the survival model, the only social effect that we fitted was the survival of other individuals in the population, but separate models were fitted for social survival coded as (−0.5, 0.5), (0, 1), and (−1, 0), as described above. In the female reproductive success models, we fitted both a social reproductive success effect as well as a social survival effect and their interactions with mast. As above, separate models were fitted for the different coding of social survival. We used the DHARMa package (Hartig 2020) to assess model diagnostics. There was no indication of heteroscedasticity, over-dispersion, or zero-inflation in our models suggesting that our binomial and Poisson models were appropriate for the data.
In one year (2008) on 1 study area (SU), there was only a single female that recruited any offspring and she happened to live at the edge of the study area (Supplementary Figure S2). This led to very strong social effects of ARS on her nearest neighbor and this observation, therefore, had very high leverage. Our conclusions, however, were robust to the exclusion of all observations from SU in 2008 (Supplementary Table S7; Supplementary Figure S3).
In our analyses, an individual’s fitness appeared as a focal observation once, but this observation was also included many times as part of the social environment of others. This could lead to deterministic relationships between a focal animal’s fitness and the fitness of others that are independent of biological effects resulting from competition. We, therefore, implemented a permutation test where we randomized distances between squirrels to determine the degree to which our observed relationships were independent of this measure of social interaction strength (see Supplementary Methods).
Results
Survival
We tracked 4834 instances of annual survival by 1761 squirrels between 1989 and 2019. Annual survival followed the expected quadratic relationship with age where 2- and 3-year-old squirrels had the highest survival and survival was lower in older and younger squirrels (Table 2). Survival was slightly lower during mast years, although this effect was not significant (Table 2). When we equally distance-weighted mortalities (i.e., coded survival of other individuals as dead = −0.5, alive = 0.5), there was a significant negative social effect of the survival of other squirrels on the survival of focal squirrels (β = −0.16 ± 0.05, Z = −2.98, P = 0.003; Table 2). Survival was similar in mast and non-mast years, although there was a trend toward lower survival in mast years (β = −0.39 ± 0.24, Z = −1.62, P = 0.10) and the social effect of survival was not significantly weaker during mast years (survival of others × mast: β = 0.05 ± 0.12, Z = 0.41, P = 0.69; Table 2; Figure 1) as we had predicted.
Social effects on survival. The only social effect considered in this model was the survival of other squirrels in the population. Survival of other squirrels was coded as survived (0.5) and died (−0.5), such that survival and mortality of other squirrels were equally distance-weighted
| Variable | Estimate ± SE | Z value | P |
|---|---|---|---|
| Intercept | 0.73 ± 0.16 | 4.48 | <0.0001 |
| Age | 0.34 ± 0.08 | 4.13 | <0.0001 |
| Age2 | −0.09 ± 0.01 | −6.89 | <0.0001 |
| Study area (SU) | 0.11 ± 0.07 | 1.66 | 0.10 |
| Survival of other squirrels | −0.16 ± 0.05 | −2.98 | 0.003 |
| Mast (yes) | −0.39 ± 0.24 | −1.62 | 0.11 |
| Mast (yes) × survival of other squirrels | 0.05 ± 0.12 | 0.41 | 0.68 |
Continuous fixed effects were standardized to a mean of zero and unit variance prior to analysis. For nominal fixed effects, the level corresponding to the parameter is specified. The fitted model was a generalized linear mixed-effect model with a binomial error distribution and a logit link function. This model was based on 4834 observations of 1761 squirrels in 31 years. Residual deviance = 5557; residual df = 4825. Random effects: among-squirrel variance = 0.08; among-year variance in survival = 0.03; among-year variance = 0.25.
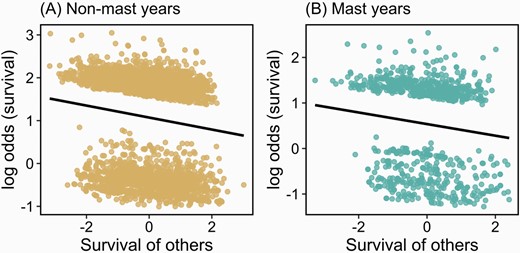
Social effects of the survival of other squirrels in the population on the survival of focal squirrels during non-mast (A) and mast (B) years. The survival of other squirrels was coded as survived (0.5) and died (−0.5) such that survival and mortality of other squirrels were equally distance-weighted. Plots represent partial plots from binomial generalized linear mixed models of survival (Table 2).
Similarly, when we distance-weighted mortalities (i.e., dead = −1, alive = 0), there was a significant negative effect of the survival of other squirrels (Supplementary Table S1). In contrast, there was no social survival effect when survivors were distance-weighted (i.e., dead = 0, alive = 1; Supplementary Table S2). In neither of these models was there a significant interaction between social survival and mast years (Supplementary Tables S1 and S2).
Reproductive Success
We tracked the ARS of 1045 female squirrels across 31 years (2933 total observations). Similar to survival, there were important linear and quadratic effects of age on ARS, such that squirrels between the ages of 3 and 5 had the highest ARS (Table 3). Squirrels in the SU study area also had lower ARS than squirrels in the KL study area and ARS was higher in mast years than in non-mast years (Table 3). As predicted, ARS was reduced by the increased reproductive success of other squirrels (β = −0.35 ± 0.06, Z = −5.49, P < 0.0001) and this negative social effect was significantly weaker during mast years (ARS of others × mast: β = 0.26 ± 0.11, Z = 2.26, P = 0.02; Figure 2). These model parameters indicate that the strong negative social effect on ARS that we documented during non-mast years (non-mast social effect: −0.35) was nearly completely eliminated during resource-rich mast years (mast social effect: −0.35 + 0.26 = −0.09).
Social effects on female ARS. In this model, we considered the effects of the survival and female ARS of other squirrels on the female ARS of focal animals. Survival of other squirrels was coded as survived (0.5) and died (−0.5), such that survival and mortality of other squirrels were equally distance-weighted.
| Variable | Estimate ± SE | Z value | P |
|---|---|---|---|
| Intercept | −2.52 ± 0.19 | −13.5 | <0.0001 |
| Age | 0.74 ± 0.08 | 9.17 | <0.0001 |
| Age2 | −0.10 ± 0.01 | −8.41 | <0.0001 |
| Study area (SU) | −0.16 ± 0.07 | −2.39 | 0.02 |
| Survival of other squirrels | 0.10 ± 0.05 | 2.30 | 0.02 |
| Mast (yes) | 1.53 ± 0.32 | 4.81 | <0.0001 |
| Reproduction of other squirrels | −0.35 ± 0.06 | −5.49 | <0.0001 |
| Mast (yes) × survival of other squirrels | −0.02 ± 0.08 | −0.21 | 0.83 |
| Mast (yes) × reproduction of other squirrels | 0.26 ± 0.11 | 2.26 | 0.02 |
Continuous fixed effects were standardized to a mean of zero and unit variance prior to analysis. For nominal fixed effects the level corresponding to the parameter is specified. The fitted model was a generalized linear mixed-effect model with a Poisson error distribution and a log link function. This model was based on 2933 litters by 1045 squirrels in 31 years. Residual deviance = 4460; residual df = 2920. Random effects: among-squirrel variance = 0.22; among-year variance in reproduction = 0.03; among-year variance in survival = 0.002; among-year variance = 0.47.
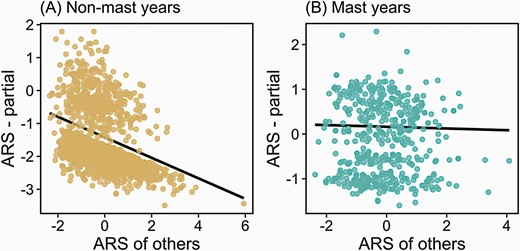
Social effects of the female reproductive success (ARS) of other squirrels in the population on the ARS of focal female squirrels during non-mast (A) and mast (B) years. Plots represent partial plots from Poisson generalized linear mixed models of ARS (Table 3). Unusual patterns of ARS in 1 study area (SU) in one year (2008) led to some points with very large positive leverage (see panel A), but the exclusion of this year of data for this study area did not affect the results (Supplementary Table S7).
In contrast to our prediction, ARS increased as a function of the increased survival of other squirrels (β = 0.10 ± 0.05, Z = 2.30, P = 0.02), but the significance and direction of this effect, depended on how the survival of others was coded (Supplementary Tables S3 and S4). When survivors were distance-weighted there was a positive effect of the survival of others on ARS (β = 0.21 ± 0.05, Z = 3.89, P < 0.0001; Supplementary Table S3), which was opposite to what we predicted, but when mortalities were distance-weighted, ARS was significantly reduced by the increased survival of other squirrels (β = −0.11 ± 0.04, Z = −2.74, P = 0.006; Supplementary Table S4) as predicted. In no situation, however, was there a significant social survival × mast year interaction as we had predicted.
Discussion
In systems where resources are limited and individuals compete for fitness, the success of one competitor necessarily comes at the expense of others. This constraint is most extreme in dyadic encounters where there can only be one winner and one loser (Wilson et al. 2011), but the same principles are likely to play out to a lesser degree in systems for which fitness is not completely zero-sum. When populations are at their carrying capacity, mean fitness is constrained by the environment and fitness becomes zero-sum. In contrast, when resources are plentiful, population growth (and hence mean fitness) is no longer constrained, and fitness is no longer zero-sum. In one respect, these relationships are inevitable and somewhat obvious, but their consequences for genetic variation in fitness and adaptation are important and perhaps underappreciated. When fitness is zero-sum, genes that enhance the fitness of their carrier will necessarily reduce the fitness of competitors. The resulting negative covariance between DGEs and IGEs on fitness () will constrain adaptation (evolved increase in mean fitness across generations), although traits associated with competitive ability can still evolve (Fisher and McAdam 2019). As such, IGEs on fitness ought to constrain adaptation under conditions of density-dependence, whereas IGEs may be less important and no longer constrain fitness when population growth is density-independent (Fisher and McAdam 2019). Although we have used a quantitative genetic framework of social evolution, these relationships do not depend on interactions between individuals that we might envision as “social.” These constraints on adaptation ought to arise inevitably from competition for fitness when fitness is zero-sum. We, therefore, have a crucial need to better understand the degree to which IGEs on fitness constrain adaptation in nature in scenarios where fitness is zero-sum and in scenarios where fitness is not constrained.
Here we tested these basic ideas using an empirical system in which a natural population of red squirrels experiences pulses of food resources from the episodic masting of spruce seeds (Lamontagne and Boutin 2007). Spruce mast events provide a super-abundance of food (Fletcher et al. 2010), which results in populations approximately doubling in size (McAdam et al. 2019) and we hypothesized individual annual survival and reproductive success would not be constrained by the success of other individuals in the population during mast years. In contrast, we predicted that during resource limited non-mast years, in which populations were stable or declined (McAdam et al. 2019), annual survival and reproductive success would be constrained by the survival and reproductive success of other individuals in this population. In territorial species, the mortality of adults creates vacancies, which can be claimed by dispersing juveniles. Once a juvenile acquires a vacant territory, however, the territory can no longer be claimed by another juvenile. When food limitation prevents the creation of new territories, territorial space is zero-sum and recruitment is limited by the availability of vacant territories resulting from adult mortality. We, therefore, expect territory acquisition by juveniles, and hence female ARS, to be strongly affected by the survival and reproductive success of nearby competitors, which will affect the availability of vacancies on which juveniles can recruit. Furthermore, territorial space is equivalent to fitness (i.e., survival and ARS) in systems such as red squirrels where territory ownership and the cached food contained within a territory are essential for overwinter survival.
In our analysis of the past 31 years of data from red squirrels in the Yukon Territory of Canada, we provided phenotypic evidence of density-dependent social effects on ARS. As we predicted, female ARS was reduced by increased reproductive success of other individuals in the population during non-mast years when populations were stable or declined. However, during resource-rich mast years in which populations doubled, the negative social effects of other squirrels’ ARS was almost completely eliminated (see main effect and interaction parameters in Table 3). Similarly, there were negative social effects of the survival of other squirrels on the survival of focal squirrels during non-mast years, as predicted. Contrary to our predictions, however, negative social effects of the survival of other squirrels on ARS and adult survival of focal squirrels persisted during mast years. Similarly, for guppies (Poecilia reticulata), individuals with larger neighbors had smaller body size, a result which was stronger at high density (Potter et al. 2019), whereas for chipmunks (Tamias striatus), individuals with larger neighbors had lower fitness (Santostefano et al. 2019). Our study, in combination with similar work in other systems, suggests the potential for density-dependent competitive ability that affects performance-based traits, that is, body size and fitness, an outcome with potential implications for our understanding of eco-evolutionary dynamics in the wild (Bassar et al. 2016, 2021). Overall, our predictions were strongly supported with respect to ARS being socially constrained during non-mast years but socially unconstrained during mast years, whereas the social effects of survival were more nuanced and persisted even in mast years when food resources were abundant.
To ensure our analyses of social effects were not spurious, we developed a series of permutation tests where the distances between squirrel dyads were randomized, and social effects were recalculated. These methods are similar to those developed for traditional social network analyses to account for inherent non-independence in relational data (Farine 2017), which, in our case were distances between pairs of squirrels. Our permutation tests indicated that even when removing the effects of distance in our measures of social effects (see Equation 3) by randomizing distances between squirrels, there remained a negative association between an individual’s fitness and that of other squirrels in the population during non-mast years (Tables 2 and 3; Supplementary Table S5). These relationships within the permuted datasets, however, were significantly weaker than the observed effects indicating that competition for fitness is stronger between nearby squirrels than squirrels farther apart (Fisher et al. 2017).
Interestingly, the effects of other squirrels’ survival on the survival and reproductive success of focal squirrels seemed to be driven by the benefit of having a competitor die nearby rather than the costs of having competitors survive nearby. We found stronger social effects on survival and ARS when we distance-weighted mortalities (Supplementary Tables S1 and S4), but social effects were absent when we distance-weighted survivors (Supplementary Tables S2 and S3). Our overall analyses in which we distance-weighted both survivors and mortalities (Tables 2 and 3) represented the net effects of these contrasting patterns. These contrasting results suggest that there are no costs associated with the survival of nearby competitors. Instead, there appear to be important short-term fitness benefits of having nearby individuals die. The death of a nearby conspecific is thought to be the result of luck (Snyder and Ellner 2018) and focal individuals that are “lucky” enough to live nearby to individuals that die reap the benefits of these vacancies through opportunities to pilfer cached food (Donald and Boutin 2011) and for offspring to recruit, which enhances female ARS. In contrast, there was no detectable cost associated with the survival of nearby competitors. In fact, there was an apparent benefit to female ARS of having nearby individuals survive. This suggests that previously documented intruder pressure (Siracusa et al. 2017) and pilferage (Donald and Boutin 2011) do not impose strong overall costs to survival and ARS at the scale at which we measured these effects. The short-term benefits of having a nearby squirrel die, will be offset by longer-term costs associated with reduced familiarity with neighbors (Siracusa et al. 2021), but these costs would only occur following settlement on these vacancies. Small-scale spatial heterogeneity in habitat quality affecting fitness (e.g., food abundance, predation risk, disease, parasitism), would tend to create positive associations between nearby fitness and a focal animal’s fitness. Any such effects would reduce evidence of negative social effects on fitness and could explain the positive effect of nearby survival on ARS, although previous studies in this system have not found evidence of meaningful spatial autocorrelation in fitness (Siracusa et al. 2021) and fitness-related traits (Fisher et al. 2019b).
It is often difficult to know a priori how the strength of social interactions decays with distance between the interactants. A key component of our distance-weighting of social effects was the use of the empirical dispersal distance distribution from this population (Supplementary Figure S1) to quantify how social interactions over fitness decay with the distance. If an adult squirrel dies and leaves a vacancy, this vacancy is beneficial to a nearby squirrel whose offspring can settle in the vacancy but is irrelevant to a squirrel for which the vacancy is beyond the dispersal range of their offspring. Similarly, the degree of competition between 2 females over limited ARS will depend on how likely their offspring are to encounter and compete for the same territory vacancy. This empirical dispersal distribution, therefore, calibrates how the distance between 2 squirrels translates into their interactions over offspring recruitment (ARS). A potentially important caveat to note is that our dispersal distance distribution only included offspring that settled within the study areas and did not account for emigration outside of the monitored study area. Ongoing studies explicitly designed to track juvenile dispersal in this population indicate that this empirical distribution underestimates long-distance dispersal (Martinig et al. 2020) and emigration can extend over 1 km from the natal site (Martinig 2021). In so much as we have underestimated long-distance recruitment, our distance-weighting of the social effects will be biased toward a heavier weighting of nearby individuals than is warranted. How this could affect the overall conclusions, however, is not known.
The social effects on fitness that we have documented were phenotypic and not genetic. As such, it is currently unclear the degree to which adaptation in red squirrels is constrained during non-mast years as opposed to mast years. Assuming population growth (and hence mean fitness) is environmentally constrained during non-mast years (McAdam et al. 2019), then we would expect adaptation to be constrained during non-mast years but not during mast years when population growth rates increase. Previous estimates of the heritability of ARS (measured as pup production rather than recruitment) in mast and non-mast years were similarly very low (McFarlane et al. 2014), but it is unclear how unmodelled IGEs might have biased these previous estimates. Nevertheless, these previous estimates suggest potential for our observed phenotypic patterns to deviate from the underlying genetic patterns.
Connecting ecological limitations in nature with genetic constraints on adaptation remains challenging. Our empirical evidence of negative phenotypic constraints on fitness provides some support for the interconnectedness between density-dependence, competition for fitness, and genetic constraints on adaptation acting through IGEs on fitness, but further empirical investigation is needed. In particular, empirical tests of the association between ecological constraints on mean fitness and of fitness are needed to understand the degree to which IGEs on fitness constrain adaptation. In addition to the degree of social constraint on adaptation can also depend on the number of other individuals with whom a focal individual interacts (see Equation 2). Empirical evidence from the animal breeding literature, however, indicates that the strength of social interactions () tends to be diluted as group size increases (Bijma 2010b; Ellen et al. 2014)—an individual cannot continue to interact as strongly with an increasing number of other individuals. At a crude scale, we did not find evidence of this dilution in our study. Non-mast years have higher population sizes yet exhibited stronger social effects on fitness. More generally, our expectations about the importance of this dilution effect might differ depending on whether we are talking about group/population size or density per se (Fisher and McAdam 2019).
Our results can also be interpreted through the lens of social selection (i.e., effects of the traits of other individuals on the fitness of a focal individual; West-Eberhard 1979). In our case, the social trait of interest is fitness itself. The negative effects of the fitness of other individuals on the fitness of the focal individual represent a misalignment of social (negative effects) and non-social selection (positive by definition), which can constrain adaptation or in some cases lead to the evolution of maladaptation (McGlothlin and Fisher 2021). Our conceptualizations of phenotypic and genetic trade-offs between direct and indirect effects on fitness and how these ought to be influenced by the degree to which fitness is zero-sum, is analogous to the social selection framework (Wolf et al. 1999; Bijma and Wade 2008; McGlothlin et al. 2010), which would correspondingly predict an increased misalignment between social and non-social selection when fitness is zero-sum. Empirical studies suggest that social and non-social selection are often misaligned (Fisher and Pruitt 2019), although the degree to which this misalignment is affected by density or resource levels and the degree to which fitness is zero-sum is not yet clear and further empirical work is needed. In forked fungus beetles (Bolitotherus cornutus), non-social selection for individual body size and social selection for average body size of social partners are misaligned, and this result was density-dependent (Formica et al. 2011). However, in this case, misalignment was greater at low density. Specifically, at low density larger males that associate with smaller social partners are most successful at inseminating females (Formica et al. 2011, 2021). By contrast, at high density, there was no difference in non-social and social selection. The mechanism driving this misalignment across a density gradient may be related to behavior of males. Specifically, it is possible that as social interactions among males increase as a function of density it is harder for any form of phenotypic association to be maintained (Formica et al. 2011). Similarly, increased resources have been found to facilitate negative social interactions in other systems (e.g., Dubuc et al. 2017). The degree to which density and food resources influence trade-offs between direct and social effects on fitness (or the alignment of social and non-social selection) and constrain adaptation requires further empirical investigation.
Fitness is the currency that connects ecology and evolution (Hendry et al. 2018). Quantifying the genetic basis to fitness provides an important measure of the adaptive potential of a population (Shaw and Shaw 2014), the potential for traits associated with fitness to evolve (Price 1970), and how much we expect mean fitness (population growth) to change across generations due to evolution (Fisher 1930). Ecological limitations, however, inevitably place limits on population growth and mean fitness, which results in competition for limited resources including fitness. IGEs on fitness provide a framework for understanding evolution and adaptation when fitness is constrained by the environment (Fisher and McAdam 2019). Here we provide evidence that social constraints on fitness are greater when ecological constraints limit mean fitness but are reduced or relieved when abundant food resources eliminate constraints on mean fitness. Our aim in demonstrating phenotypic social effects on fitness is to encourage further study into the connections between density-dependence and IGEs on fitness in nature.
Acknowledgments
We thank Kim Hughes and Anjanette Baker for organizing the symposium and this special issue and two anonymous reviews and Kim Hughes for their helpful feedback on this manuscript. We thank Agnes MacDonald and her family for long-term access to her trapline, and the Champagne and Aishihik First Nations for allowing us to conduct our work within their traditional territory. We thank the hundreds of field assistants who have helped to collect the data over the decades, Ainsley Sykes for data and project management and Matt Strimas-Mackey for assistance with database management and coding. This is publication 115 in the Kluane Red Squirrel Project.
Funding
The Kluane Red Squirrel Project has been supported through grant funding from the Natural Sciences and Engineering Research Council and Polar Knowledge Canada and the National Science Foundation.
Data Availability
All original data are available on Dryad (https://doi.org/10.5061/dryad.02v6wwq41).
Analysis code can be found at https://github.com/KluaneRedSquirrelProject/Fitness-Social-Effects
References
