


Abstract
Mixed-species groups describe active associations among individuals of 2 or more species at the same trophic level. Mixed-species groups are important to key ecological and evolutionary processes such as competition and predation, and research that ignores the presence of other species risks ignoring a key aspect of the environment in which social behavior is expressed and selected. Despite the defining emphasis of active formation for mixed-species groups, surprisingly little is known about the mechanisms by which mixed-species groups form. Furthermore, insects have been almost completely ignored in the study of mixed-species groups, despite their taxonomic importance and relative prominence in the study of single-species groups. Here, we measured group formation processes in Drosophila melanogaster and its sister species, Drosophila simulans. Each species was studied alone, and together, and one population of D. melanogaster was also studied both alone and with another, phenotypically distinct D. melanogaster population, in a nested-factorial design. This approach differs from typical methods of studying mixed-species groups in that we could quantitatively compare group formation between single-population, mixed-population, and mixed-species treatments. Surprisingly, we found no differences between treatments in the number, size, or composition of groups that formed, suggesting that single- and mixed-species groups form through similar mechanisms of active attraction. However, we found that mixed-species groups showed elevated interspecies male–male interactions, relative to interpopulation or intergenotype interactions in single-species groups. Our findings expand the conceptual and taxonomic study of mixed-species groups while raising new questions about the mechanisms of group formation broadly.
Mixed-species groups (also called multispecies groups) describe associations between individuals from 2 or more species at the same trophic level (Farine et al. 2012; Goodale et al. 2017). Animals in natural populations may interact with each other in a variety of ways; what distinguishes mixed-species groups from these other types of interactions is that mixed-species groups form through active attraction of individuals to one another (like single-species groups) and the stipulation that the species are on the same trophic level (i.e., predator–prey interactions or parasite–host interactions would not be considered mixed-species groups; Goodale et al. 2017).
Mixed-species groups are important because they are widespread (Stensland et al. 2003; Sridhar et al. 2009; Goodale et al. 2017; Beaudrot et al. 2020), impact ecological processes such as predation (Fitzgibbon 1990; Gibson et al. 2002; Stensland et al. 2003; Beaudrot et al. 2020), and can shape the selective forces acting on the participating species (Harrison and Whitehouse 2011). Furthermore, the possibility that individuals of different species actively form mixed-species groups is fundamentally important for the ways we think about and study group dynamics. For example, experimental studies of single-species groups may be missing a key “player”—other species—that fundamentally shape group dynamics in nature. In other words, the presence and behavior of one species may serve as an environment for the other species in the mixed-species group. Thus, studying mixed-species groups may illuminate links between social behavior and its evolution across interacting species.
Similarly, many studies measure behavioral interactions among species in no-choice contexts (e.g., rates of interspecific mating or aggression; Kacsoh et al. 2018; Gupta et al. 2019). Interpreting the results of these studies, and especially their evolutionary implications, requires information about whether and how often these species form groups together in nature. In other words, the choices of individuals to form groups together, or not, “sets the stage” for direct behavioral interactions within and between species. Thus, studying mixed-species groups has the potential to illuminate the dynamics, development, and evolution of animal associations and group behaviors (Farine et al. 2012; Goodale et al. 2017).
Given that a key defining feature of mixed-species groups is that they form through active associations, it is surprising that studies of mixed-species groups have primarily focused on the ecological and fitness outcomes of mixed-species groups, with few studies investigating how such groups form in the first place. This gap in knowledge may arise partially because many studies of mixed-species groups focus on free-living populations of relatively large-bodied animals (mammals and birds), which are not always amenable to manipulative experimentation.
Fortunately, a number of methodological and statistical approaches have been developed to study how single-species groups form (Stamps 1988; Croft et al. 2005; Reiczigel et al. 2008; Wey et al. 2008; Saltz and Foley 2011; Saltz 2011; Carter et al. 2013; Silk et al. 2013; Geiger and Saltz 2020), and some of these can be readily used to study the formation of mixed-species groups as well (e.g., Farine et al. 2012). One of the hallmarks of active social attraction is the availability of suitable, but empty, habitat patches (Alexander 1974; Stamps 1988; Danchin and Wagner 1997). Animals are often found near resources, and aggregations can form without active attraction solely because animals are using the same preferred resource. When multiple high-quality habitat patches are available, competitors should spread out among patches in order to maximize resource gain (i.e., the foundation of the ideal free distribution; Fretwell and Lucas 1969). Yet, animals often show a clumped distribution that leaves some patches under-utilized, suggesting active social attraction (Alexander 1974). In the wild, spatial distributions consistent with social attraction must be tested against other important hypotheses, for example, that the empty patches are actually unsuitable for some reason, that the animals are not aware of all patches on the landscape, etc (Danchin and Wagner 1997). In the lab, investigators have designed and validated experimental approaches that minimize these other possibilities (Cote et al. 2008; Kohn et al. 2011; Saltz and Foley 2011; Silk et al. 2013). Key features of such experiments include 1) providing patches of nearly identical quality; 2) acclimating animals to a relatively small arena so that they can “discover” all available patches; and 3) providing opportunities for individuals to move among groups or potential grouping sites freely. By measuring the number and composition of groups that form under these carefully controlled conditions, investigators can identify active conspecific attraction (Stamps 1988; Stamps, McElreath, et al. 2005; Reiczigel et al. 2008; Silk et al. 2013). Applying these same methods to study the formation of mixed-species groups should be straightforward in many taxa, especially those species whose behavior can be studied under controlled conditions; yet, to our knowledge, this experimental approach has rarely been employed to examine the dynamics of mixed-species group formation.
Furthermore, insects have been nearly entirely neglected in the study of mixed-species groups (Goodale et al. 2017, but see Broly et al. 2016). This is surprising because insects include some of the most spectacular examples of aggregation behavior (e.g., locusts) and some of the most intricate examples of complex societies (e.g., ants, termites). Therefore, much remains to be learned about the formation, dynamics, and evolution of mixed-species groups in all animals, but especially insects.
Here, we investigated how group formation differed when individuals could form groups with 1) other individuals from their own population; 2) conspecifics from a different population; or 3) heterospecifics from a sympatric sister species. This approach allowed us to quantitatively identify how group formation differs between single-species and mixed-species groups (if at all) and some of the consequences of these processes for the resultant group dynamics. We measured the number, sizes, and composition of the groups that formed, in addition to some of the behavioral dynamics (the frequencies of male–female and male–male interactions) that occurred within groups. Thus, we were able to identify whether mixed-species groups formed, or not; and, we could measure how mixed-species groups might differ in size, number, and behavioral dynamics, compared with single-species groups.
Furthermore, because the populations we chose have previously described phenotypic (and genetic) differences, we were also able to identify whether any differences between single-species and mixed-species group formation might be due to phenotypic differences among individuals or to species identity per se. For example, if individuals form larger groups with individuals from their own population, but smaller groups when with another species or with a different population (mixed-population treatment), this result would suggest that individuals avoid phenotypically dissimilar individuals and that this mechanism informs the formation of mixed-species groups (or their absence).
Our work focused on fruit fly species Drosophila melanogaster and Drosophila simulans. These morphologically similar sister species co-occur over large areas of their recorded ranges, but little is known about direct interactions between the species in either the lab or field. D. melanogaster group formation and group dynamics have been characterized previously (Saltz and Foley 2011; Billeter et al. 2012; Durisko and Dukas 2013; Saltz 2013, 2017; Durisko et al. 2014; Kilgour et al. 2018; Dukas 2020; Geiger and Saltz 2020), and in particular, social behavior has been studied in the D. melanogaster population known as the Drosophila Genetic Reference Panel (DGRP) from North Carolina (Mackay et al. 2012). In contrast, D. simulans social behavior is less well studied. Based on this and other previous research (Wang and Anderson 2010; Saltz and Foley 2011; Foley et al. 2015; Gupta et al. 2019), we hypothesized that male–male interactions among species—interactions which are primarily aggressive—would limit opportunities for mixed-species groups to persist (Beaudrot et al. 2020). Thus, we predicted that mixed-species groups would be relatively rare compared with mixed-population and single-population groups. Our results expand our understanding of mixed-species groups, both conceptually and taxonomically, and raise new questions about the behavioral and evolutionary mechanisms that produce mixed-species groups.
Methods: Experimental Methods
Study System
Our study focused on 2 sister species of fruit flies, Drosophila melanogaster and Drosophila simulans. With rare exceptions (Ranz 2004; Barbash and Lorigan 2007), hybrids between these species are either inviable or sterile (depending on the direction of the cross; (Sturtevant 1920)). The 2 species have highly overlapping ranges; both species form semistable single-species groups on food substrates in nature (Wertheim et al. 2002, 2003, 2006; Dukas 2020). A few studies have been able to collect the 2 species from the same food patch in the wild (McKenzie and McKechnie 1979; Nunney 1990), suggesting the presence of mixed-species groups. Despite this, little is known about when and how these mixed-species groups might form (Dukas 2020). In particular, the limited previous research on these species has focused on the potential for niche partitioning among the species (McKenzie and McKechnie 1979; Nunney 1990) without considering the possibility that co-occurrence might be due to active formation of mixed-species groups.
In the lab, D. melanogaster are well-known to form social groups on food patches (Wang and Anderson 2010; Saltz and Foley 2011; Schneider et al. 2012; Anderson et al. 2016); furthermore, several lines of evidence demonstrate that these social groups are the result of active social attraction (Saltz and Foley 2011; Durisko et al. 2014; Geiger and Saltz 2020). Group formation in D. simulans has received much less attention, although recent evidence indicates that D. simulans do interact socially with conspecifics (Jaffe et al. 2020). It is currently unclear whether the social dynamics understood in D. melanogaster may be valid for D. melanogaster groups that also include D. simulans, assuming that such mixed-species groups exist.
Populations and Genotypes
We included 2 populations of D. melanogaster, one collected in the United States (North Carolina) and one collected in the Caribbean. Previous research has demonstrated that Caribbean and North American populations differ in pheromone production, courtship behavior, morphology, and likely other traits (Yukilevich and True 2008).
Our one population of D. simulans was collected in the United States (California).
For each population of each species, we included 3 genotypes to represent a small sample of genetic variation within that species. Each genotype was the F1 progeny of 2 inbred lines from the same population. This ensures that the same, heterozygous genotypes can be recurrently produced, and that any inbreeding effects on behavior are minimized. D. melanogaster Caribbean inbred lines were kindly provided by Roman Yukilevich, and D. simulans inbred lines were kindly provided by Sergey Nuzhdin. D. melanogaster United States lines were from the Drosophila Genetic Reference Panel (DGRP), collected in North Carolina. The D. melanogaster United States F1 genotypes used were as follows: 360/335, 732/775, and 486/380, where the number/number designation refers to the maternal and paternal inbred line, respectively. The numbers assigned to each DGRP line are arbitrary and have no numeric meaning. For the D. melanogaster Caribbean and D. simulans lines, no standardized identifiers are available, so we named them arbitrarily (Supplementary Table S1).
Rearing
All flies were reared on standard lab medium. Newly eclosed flies were collected onto fresh medium 1–2 days after eclosion, and aged in mixed-sex vials with 10–20 other individuals of their own genotype for an additional 1–2 days to allow them to reach maturity. Next, flies were anesthetized with CO2 and marked with a small dot of paint on their pronotum, allowing observers to identify the genotype and sex of individuals in groups (Stamps, Buechner, et al. 2005; Saltz 2013, 2017). Flies were stored in single-sex vials, with 10 individuals of their own genotype, for a further 1–2 days to recover from being painted.
Group Formation Assay
Twenty flies—10 males and 10 females—were allowed to interact in an environment containing 4 identical food patches. Each food patch was created by filling a small petri dish (4 cm in diameter and 0.5 cm high) with fly food, composed of standard fly food with 100% grapefruit juice added (each batch made with 9.5-g agar, 18-g yeast extract, 13.5-g malt sugar, 0.25-L water, and 0.25-L 100% grapefruit juice; Saltz and Foley 2011; Saltz 2013, 2017; Geiger and Saltz 2020). The 4 patches were contained inside a larger circular arena, 13.5 cm in diameter and 2 cm high. Individuals were free to move throughout the arena, and could choose to land on any of the 4 patches, or to avoid patches altogether. We have previously demonstrated that this assay captures important variation in group formation dynamics, at least for single-species groups of D. melanogaster (Saltz and Foley 2011; Foley et al. 2015).
The evening before observations began, we placed the 20 flies into the arena using gentle aspiration without anesthesia. Flies were allowed to acclimate to the arena overnight, which also allowed them the opportunity to find and sample all the available patches. Video recordings of behaviors were taken for 4 h the following morning (starting 15 min after subjective dawn) and again for 4 h that evening (ending 30 min before subjective dusk). These sampling periods capture peak activity times for flies (Allada and Chung 2010).
Treatments
All trials contained males from 2 different genotypes and females from one or 2 genotypes (Table 1). Treatments differed in which population and species those genotypes came from. In 3 of the treatments, all genotypes were from the same populations: all Caribbean D. melanogaster, all US D. melanogaster, or all D. simulans. The other 2 treatments consisted of genotypes from different populations: (1) a mixed-population treatment containing individuals from Caribbean D. melanogaster and US D. melanogaster; and (2) a mixed-species treatment containing US D. melanogaster and D. simulans. As described above, this nested-factorial approach allowed us to examine how group formation varied based on the population or species of the other individuals present.
Summary of treatments
| Treatment | Genotype 1 | Genotype 2 |
|---|---|---|
| Single population | Caribbean D. melanogaster | Caribbean D. melanogaster |
| US D. melanogaster | US D. melanogaster | |
| D. simulans | D. simulans | |
| Mixed population | US D. melanogaster | Caribbean D. melanogaster |
| Mixed species | US D. melanogaster | D. simulans |
In all treatments, the 2 genotypes were represented at equal ratios for each sex. For example, in the mixed-species treatment, there were 5 D. melanogaster males (all from a single D. melanogaster genotype), 5 D. melanogaster females (all from a single D. melanogaster genotype), 5 D. simulans males (all from a single D. simulans genotype), and 5 D. simulans females (all from a single D. simulans genotype). In the single-population treatments, there were 2 male genotypes present at equal frequency (e.g., 5 US D. melanogaster from a single genotype, 5 US D. melanogaster males from a different genotype) and usually 2 female genotypes as well. Genotypes were included in each trial based on how many individuals of that genotype eclosed on each day from each genotype. Our focus was on the species- and population-level comparisons, but we tested for an effect of which genotypes were included in each arena (and found no support for such an effect, see below). A full list of which genotype combinations were measured is available in Supplementary Table S1.
Subsampling Group Compositions and Interactions From Videos
A 10-s segment was randomly selected from the videos of each trial. We sampled 66 videos from 60 trials, representing 37 morning videos, and 29 evening videos. Six of the 60 trials had videos from both morning and evening. For each video segment, group composition was recorded for all 4 patches at time = 0 s. Social interactions were recorded for all 4 patches during the subsequent 10 seconds. While 10 s is a very short period of time, we captured 744 s of interactions in our overall sample. Furthermore, previous studies of group formation using this same approach have been successful with only still images (Saltz and Foley 2011).
Measuring Group Size and Group Composition
As in previous studies, a “group” was defined as all the individuals located on the same food patch (Saltz and Foley 2011). This criterion is appropriate because individuals on the same food patch are more likely to interact with one another than with other individuals in the population, due to their spatial proximity. Group size was measured as the number of individuals on the same patch. Group composition was measured by counting the number of individuals in each group from each genotype and sex, which was possible because individuals were marked. We also recorded the number of empty patches, out of 4, in the arena. Patches were counted as empty if no flies were perched on them during our scan sample.
Definitions of Interactions
We recorded the duration of social interactions occurring in each group, which individuals were interacting, and who initiated the interaction. Participants in the interaction could be identified by genotype and sex because individuals were marked. Behaviors were counted as social interactions if they matched any of the sub-behaviors known to be associated with aggression (i.e., fencing, lunging, wing threats; Nilsen et al. 2004) or courtship (i.e., wing extension, circling, attempted copulation; Greenspan and Ferveur 2000). Because female–female aggression only occurred in one possible instance (perhaps because of the environment we used; Kilgour et al. 2018), female–female interactions were excluded from our analysis. Anecdotally, we observed that the vast majority of male–male interactions were aggressive in nature, with only a very few instances of male–male courtship; similarly, nearly all male–female interactions were males courting females. However, we did not explicitly record the type of interactions, only the interaction’s participants, who initiated the interaction, and the interaction duration.
Each interaction’s duration was recorded in the number of “fly-seconds.” For example, if 2 males of genotype A were each courting 2 females of genotype B for the entire 10-s duration, this would represent 20 fly-seconds of genotype A-initiated male–female interaction with genotype B. Interactions lasting less than one second were given a duration score of one.
It is important to note that in some cases, group composition changed very rapidly; thus, we were unable to directly connect group composition and group dynamics at the single-patch level. For example, in the mixed-species treatment, we observed interactions between D. melanogaster and D. simulans individuals in groups that were initially recorded to only contain D. melanogaster individuals. This occurred because a D. simulans individual joined the group at some point during the 10-s observation period.
Replication
Each trial, containing 20 individuals, was considered a single replicate. For the single-population treatments, we conducted 3–14 replicates (3 for D. simulans only, 3 for US D. melanogaster only, and 14 for Caribbean D. melanogaster only). For the mixed-population treatment, we conducted 22 replicates, and for the mixed-species treatment, we conducted 18 replicates. Overall, we conducted 60 trials representing observations of 1200 flies.
Methods: Analysis Methods
Overview
The goal of our analysis is to understand variation in group formation and behavioral dynamics across treatments. To this end, we fit a series of generalized linear mixed models to measures of group formation and measures of male–male and male–female interactions within groups. We chose an appropriate error distribution for each response variable by considering the underlying process that generated the data (e.g., many of the response variables were counts) and then checking whether residuals from initial models adequately fit the data using Q–Q plots generated by the package DHARMa (Hartig 2020). GLMMs were fit using the glmmTMB package, which allows for a variety of error distributions and also the option to fit additional parameters to account for zero inflation (Brooks et al. 2017). This latter option was necessary in several cases (see below) due to the fact that some of the patches had no individuals, and some of the groups had no social interactions recorded during our sample. Ordered multinomial models were fit using cumulative link mixed models implemented in the package ordinal (Christensen 2019). This approach is appropriate for finite discontinuous scales, such as rating scales commonly used in psychology (Christensen and Brockhoff 2013). Cumulative link mixed models are an extension of logistic regression whereby response variables with more than 2 categories can be modeled; an unobserved underlying process is assumed to contribute to the likelihood of observing the arena in a particular state, for example, 3 patches occupied by flies and 1 patch empty.
Each model included fixed predictors for treatment (describing which populations and species were present) and the time of day (morning or evening) when the observation occurred. We also included a random effect describing which genotypes were present. For example, if genotypes A, B, C, and D were present in a particular trial, the level of the parameter “genotype combination” for this trial would be “ABCD.” This parameter was never found to be significant and was dropped from the final models. Finally, we included a random effect of trial ID to account for repeated measures (i.e., the 4 patches and 2 time points where relevant) of each trial.
All analyses were conducted in R version 4.0.1, “See Things Now” (R Core Team 2020). All code is available as Supplementary R File.
Planned Contrasts
If treatment was significant in any model, we conducted planned contrasts using the package emmeans (Lenth 2019). We tested whether the treatment effects were due to 1) differences between the single-population treatments (US D. melanogaster only, Caribbean D. melanogaster only, and D. simulans only) and the mixed-population (i.e., US D. melanogaster and Caribbean D. melanogaster) treatment; 2) differences between the mixed-species (i.e., US D. melanogaster and D. simulans) treatment and all others; and 3) differences between the mixed population (i.e., US D. melanogaster and Caribbean D. melanogaster) treatment and the mixed-species treatment. To further ascertain the direction of any differences, we consulted least-squares means that were detransformed to the scale of the original data, again using the package emmeans.
Analysis of Group Formation
The number of empty patches is, in principle, a count; however, in practice, it only took on 4 values in our data set. Thus, we modeled the number of empty patches as an ordered multinomial using cumulative link mixed models.
Group size, similarly, is a count of the number of individuals on the same patch. Thus, group size variation was initially modeled with a Poisson error distribution (Lambert 1992; Bolker et al. 2009); however, the Q–Q plots indicated that this model was a poor fit to the data. Therefore, we instead used a negative binomial model to account for overdispersion, which was a better fit to our data.
To quantify group composition, we took 2 approaches. First, we measured the number of groups including dissimilar individuals, which we refer to as “mixed” groups. For the mixed-species treatments, this corresponded to the number of groups including at least one D. melanogaster individual and at least one D. simulans; for the mixed-population treatments, this corresponded to the number of groups including at least one US D. melanogaster and at least one Caribbean D. melanogaster; and for single-population treatments, this corresponded to the number of groups including at least one individual from each of the 2 genotypes present. Like the total number of groups, this response variable was modeled as an ordered multinomial using cumulative link mixed models. Second, for mixed groups only, we measured the proportion of individuals in a group who were the same, i.e., number individuals from one genotype / total number of individuals. (This measure is also known as Duncan’s dissimilarity index; Broly et al. 2016.) For the mixed-species treatments, this corresponded to the proportion of individuals in the group who were D. melanogaster; for the mixed-population treatments, this corresponded to the proportion of individuals in the group who were from the US population; and for single-population treatments, this corresponded to the proportion of individuals in the group who were from one of the genotypes (arbitrarily chosen). Values of this measure that are close to 0 or 1 indicate relatively homogenous groups (most individuals were the same), whereas intermediate values indicate groups with similar numbers of individuals from each species or population. Variation in this ratio was modeled using a Gaussian error distribution after confirming normality of residuals using the Q–Q plot and a Shapiro–Wilk test.
Male–Male and Male–Female Interactions
To examine the effect of treatment on group interactions, we first modeled the total number of “fly-seconds” of male–male and male–female interactions, respectively.
Next, we quantified the directionality of these interactions. We modeled the amount of interaction that occurred among individuals from different species, populations, or genotypes (corresponding to mixed-species, mixed-population, and single-population treatments, respectively). We refer to these interactions as “heterogeneous interactions.” We included fixed effects of treatment and time of day as above. In these models, we also included a fixed effect quantifying the amount of interaction that occurred among individuals of the same species, populations or genotypes (depending on the treatment) in the group. We refer to these interactions as “homogeneous interactions.” Including homogeneous interactions as a covariate accounted for the fact that some groups had more total social interactions than others, as indicated by a positive correlation between heterogeneous and homogeneous interactions across groups for both male–male and male–female interactions (male–male: Kendall’s tau = 0.376, z = 6.2682, P < 0.0001; male–female: Kendall’s tau = 0.253, z = 4.554, P < 0.0001).
Models of social interactions were fit using a Poisson error distribution and accounted for zero inflation.
Hypothesis Testing
To test the significance of random effects, we used likelihood ratio tests. To evaluate the significance of fixed effects, we used type-III analysis of deviance tests implemented in the car package (Fox and Weisberg 2011).
Results
Key results are compiled in Table 2.
Summary of results
| Process | Response variable | Mean | Error distribution | Degrees of freedom | Test statistic | P-value | Result |
|---|---|---|---|---|---|---|---|
| Group formation | Group size | 3.173 | Negative binomial | 4 | χ 2 = 0.972 | 0.914 | No difference in group size distributions among treatments |
| Group composition in mixed groups | 0.488 | Gaussian | 4 | χ 2 = 1.806 | 0.737 | Mixed groups contained similar numbers of individuals from each genotype, population, or species | |
| Number of empty patches in an arena | 0.894 | Ordered multinomial | 4 | F = 0.950 | 0.434 | No differences in the frequency of empty patches across treatments | |
| Number of mixed groups in an arena | 1.606 | Ordered multinomial | 4 | F = 0.214 | 0.935 | Individuals from different species formed groups together as often as individuals from different populations or genotypes | |
| Group dynamics | Total male–male interactions | 2.804 | Poisson | 4 | χ 2 = 2.526 | 0.64 | No difference in total male–male interactions across treatments |
| Total male–female interactions | 5.2 | Poisson | 4 | χ 2 = 23.895 | <0.0001 | Carribean D. melanogaster show less male–female interactions than every other population | |
| Heterogeneous male–male interactions | 0.28 | Poisson | 4 | χ 2 = 10.710 | 0.03 | Male–male interactions were elevated between males of different species | |
| Heterogeneous male–female interactions | 0.93 | Poisson | 4 | χ 2 = 4.460 | 0.347 | Male–female interactions among genotypes, populations, and species occurred at similar rates |
Testing the Assumption That Patches Were of Similar Attractiveness
Although we took every precaution to ensure that the 4 food patches were identical, we were also aware that seemingly minor (to humans) environmental differences may shape fly attraction to food patches (Stamps et al. 2013; Burns et al. 2020). Thus, we tested for biases in which patches within the arenas were used for group formation. First, we tested whether groups were larger in some parts of the arena by adding a fixed effect corresponding to the location of each patch to the model for group size. We found no consistent differences in the group sizes across the 4 patches (χ 2 = 6.5866, df = 3, P = 0.086), and including this term in the model did not change anything else (see below). Next, we tested whether “mixed” groups (i.e., groups containing at least one individual from each genotype, population, or species) were likely to form in any particular area of the arena using a Fisher’s exact test. We found no evidence that mixed vs. unmixed groups were especially likely on any particular patch (P = 0.1119). Therefore, we did not detect any systematic biases in the locations where groups were likely to form within the arena.
Group Formation
Empty patches were common (Figure 1); we observed at least one empty patch in 2/3 of trials. However, we found no evidence that the number of empty patches varied across treatments (F4 = 0.950, P = 0.4338).
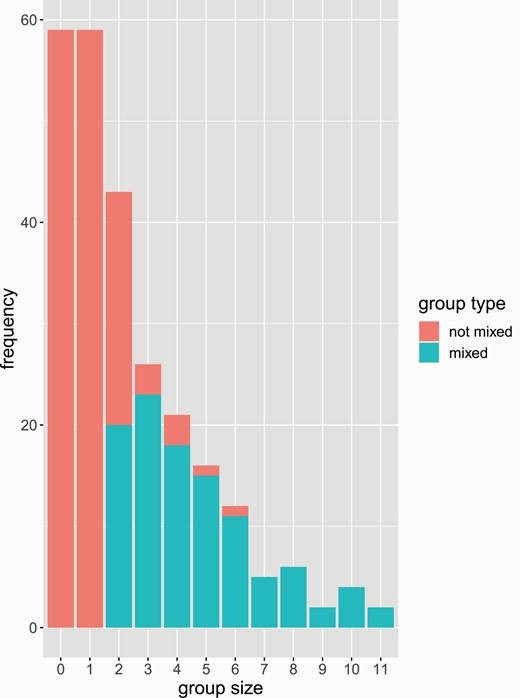
Histogram of group sizes observed across the entire experiment. Empty patches correspond to a “group” size of 0. Stacked bars provide information about group type, with “mixed” groups (i.e., groups containing at least one individual from each genotype, population, or species) in lighter grey and non-mixed groups in darker grey.
Groups ranged in size from 1 to 11 individuals (Figure 1). We found no evidence that group size varied across treatments (χ 2 = 0.9721, df = 4, P = 0.914).
Similarly, we found no evidence that the number of “mixed” groups (i.e., groups containing at least one individual from each genotype, population, or species) differed across treatments (F4 = 0.214, P = 0.9305). Overall, we saw a median of 2 mixed groups (range 0–3) per trial. Within mixed groups, we found no evidence that the proportion of individuals who were the same varied among treatments (χ 2 = 1.8062, df = 4, P = 0.7714).
Taken together, these results, in particular the high frequency of unoccupied patches, do not support the hypothesis that individuals from different populations or species avoid each other (Figure 1). Instead, our results indicate that mixed-species groups, like single-species groups, form through active attraction.
Group Dynamics
In groups where male–male interactions were observed, we saw a mean of 2.8 fly-seconds of male–male interactions (range: 1–11 fly-seconds). We saw no evidence that the total amount of male–male interactions varied across treatments (χ 2 = 2.5261, df = 4, P =0.63997).
Although we found no treatment effects for the total amount of male–male interactions, the directionality of male–male interactions—that is, the number of “fly-seconds” of heterogenous interactions—did vary across treatments (χ 2 = 10.71, df = 4, P =0.030). Our planned contrasts indicated no significant differences between single-population and mixed-population treatments (estimate = −0.702, t-ratio = −1.184, P = 0.2376) in the number of fly-seconds of heterogeneous male–male interactions. We did see support for differences between the mixed-species treatment and the mixed-population treatment (estimate = 0.873, t-ratio = 1.983, P = 0.0485) and the mixed-species treatment and all other treatments (estimate = 1.4, t-ratio = 2.854, P = 0.0047). Together, these results indicate that the mixed-species treatment showed different levels of heterogenous male–male interactions, compared with all the other treatments. Inspection of least-squares means indicated that the mixed-species treatment showed elevated amounts of heterogeneous male–male interactions, compared to the other treatments (Figure 2, top). These findings together indicate that males interact with males of a different species at a higher rate than males of the same species.
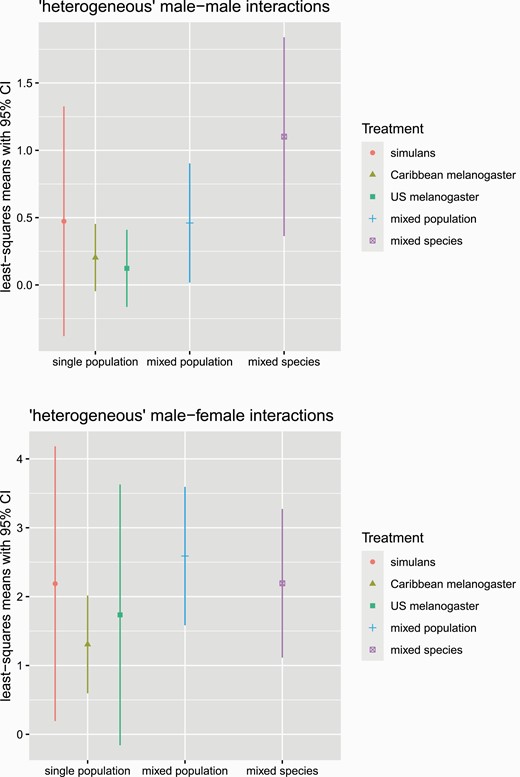
Estimated marginal means of heterogeneous male–male interactions (top) and heterogeneous male–female interactions (bottom). Error bars show the 95% confidence intervals. The mixed-species treatment showed elevated heterogeneous male–male interactions, compared with all other treatments (χ 2 = 10.71, df = 4, P = 0.030; for details, see text). There was no difference in the number of heterogeneous male–female interactions among treatments (χ 2 = 4.4601, df = 4, P = 0.3473). N = 60 trials, 1200 flies.
In groups where male–female interactions were observed, we saw a mean of 5.2 fly-seconds of male–female interactions (range: 1–23 fly-seconds). We found that the total amount of male–female interactions varied across treatments (χ 2 = 23.8951, df = 4, P < 0.0001). Our planned contrasts indicated no significant differences between the mixed-species treatment and the mixed-population treatment (estimate= 0.277, t-ratio = 1.261, P = 0.2084) or the mixed-species treatment and all other treatments (estimate = −0.44, t-ratio = −1.739, P = 0.0833). We found significant differences between the single-population treatments and the mixed-population treatment (estimate = 0.607, t-ratio = 2.655, P = 0.0084). Inspection of least-squares means indicated that the Caribbean-D. melanogaster-only treatment showed substantially lower male–female interactions than the other treatments. Consistent with these findings, we saw no variation across treatments in the amount of heterogeneous male–female interactions (χ 2 = 4.4601, df = 4, P = 0.3473; Figure 2, bottom).
Discussion
Studying if and how individuals of different species form groups and interact is an important part of understanding the ecology and evolution of group behaviors. Although the role of biogeography and resource distributions in shaping individual- and species-level interactions have been intensively studied, much less is known about the role of specific group-formation behaviors, such as aggression or active attraction, in shaping interactions among species. Indeed, few studies have measured the formation of mixed-species groups, in particular under conditions in which individuals can choose among multiple options (Gibson et al. 2002). This gap in knowledge is particularly surprising because active choice is a key defining feature of mixed-species groups (Goodale et al. 2017). In this study, we allowed fruit flies to form groups on food patches and measured the behavioral interactions that occurred in the resultant groups. In contrast to some previous assumptions about mixed-species groups, we find that mixed-species groups form readily (as readily as single-species groups) even when they are not ecologically “necessary” (Fitzgibbon 1990; Broly et al. 2016; Beaudrot et al. 2020). Indeed, in all treatments we saw signatures of active social attraction (e.g., empty patches, moderate-sized groups), and group formation did not appear to depend on the number of species or populations present. However, the behavioral dynamics within mixed-species groups were different than in single-species groups: mixed-species groups showed elevated male–male interactions, but only between D. melanogaster males and D. simulans males.
Although mixed-species groups have been observed in a variety of taxa, our study is one of the first to focus on insects (Goodale et al. 2017). Studying group formation in insects and other small animals is particularly important because relatively small spaces can still leave ample opportunities for individuals to avoid each other. In our study, flies of different species could avoid each other by colonizing unoccupied patches (at least one patch remained unoccupied in 2/3 of the trials), by choosing a social group with no members of the other species, or by avoiding food patches (and social interactions) altogether. Although some individuals chose these options, the rates of empty patches and “opting-out” were similar across all treatments. This uniformity included the mixed-population treatment, which is significant because the 2 populations we studied are known to have several phenotypic differences (Yukilevich and True 2008). These results demonstrate that fly groups form through active social attraction, and that flies either cannot or do not avoid phenotypically dissimilar individuals.
The finding that male–male interactions were elevated between the species is important for several reasons. As a reminder, the majority of male–male interactions recorded were sub-components of aggressive behaviors, such as lunging and chasing. Thus, our finding is consistent with other recent studies (Gupta et al. 2019) finding unusually high levels of aggression between D. melanogaster and D. simulans, compared to other Drosophilid species pairs. In these previous studies, aggression was measured in arenas that did not allow for males to avoid one another. The fact that qualitatively similar dynamics prevail even when males could easily choose not to engage in male–male interactions supports the inference that previous results were not a byproduct of the constrained experimental setup. Second, we did not see elevated male–male interactions between the 2 D. melanogaster populations. These 2 populations are phenotypically different, which suggests that elevated male–male interactions seen between D. melanogaster and D. simulans are not solely due to the existence of phenotypic differences between the 2 species. Third, the seeming absence of any link between male–male interactions and group-formation processes stands in contrast to previous studies of group formation within D. melanogaster, which have found that aggression disrupts group formation (Wang and Anderson 2010; Saltz and Foley 2011; Foley et al. 2015). Why mixed-species groups can withstand elevated male–male interactions without fragmenting is unclear. More detailed behavioral quantification is necessary to understand nature of these male–male interactions, and future experiments examining group formation over a longer time frame would potentially reveal more information about how groups both form and fall apart.
Previous work on mixed-species groups has emphasized the benefits of mixed-species groups for processes such as resource defense, foraging, and predator avoidance (Stensland et al. 2003; Sridhar et al. 2009; Goodale et al. 2017). In this study, we saw elevated levels of male–male interactions with heterospecifics in mixed-species groups, which might indicate a cost, rather than a benefit, to mixed-species groups. Similarly, male–female interactions between the species were common in the mixed-species treatment—as common as male–female interactions within species. This finding is unexpected because heterospecific matings are not expected to produce viable and/or fertile progeny. It is possible that these findings are specific to the laboratory environment, in which food is nearly unlimited and predators are absent. However, it is well-known in studies of single-species groups that animals will readily form sub-optimal groups (Sibly 1983), suggesting that mixed-species groups may also form (perhaps transiently) even when they do not provide net fitness benefits to members. Considering the fitness costs as well as the benefits of mixed-species groups (and who accrues the costs and benefits) is essential to understanding the evolution of group dynamics and group formation behaviors (Sridhar et al. 2009).
Our study was limited in several ways. First, although we measured more than a thousand flies, our sample sizes were small, particularly for the D. simulans-only treatment. This is unfortunate because group formation processes are understudied in this species. Further, our behavioral observations occurred during very short windows of time. Although there is no reason to think that this sampling protocol biased our results, it is certain that many informative behaviors were missed. In addition, we only compared 2 populations of D. melanogaster and one population of D. simulans. Future studies that consider more populations of both species will be important. Studies over longer timescales (e.g., multiple days) would also enable us to evaluate the role of learning in shaping mixed-species group dynamics. For example, male D. melanogaster learn to avoid courting D. simulans females following experience (Dukas 2004). Thus, the dynamics of mixed-species groups may reflect ecological processes in combination with the prior experiences of the group members.
Future studies with more replication at the genotype level would provide the opportunity to study interspecific indirect genetic effects, IIGEs. IIGEs describe the situation when the phenotype of an individual is influenced by the genotype of an interacting, heterospecific social partner (Whitham et al. 2003; Genung et al. 2013). Under IIGEs, trait interactions between heterospecifics depend not only on the species identities, but also on the genotypes of the interacting pair. IIGEs have rarely been studied in animals but have been described in plants (Genung et al. 2013). IIGEs represent the “raw material” for the evolution of mixed-species group formation and group dynamics, and therefore will be important to consider when investigating the evolution of mixed-species groups.
Overall, studying the formation and dynamics of single-species and mixed-species groups is critical for understanding which social interactions are most likely to occur in natural populations and why. Allowing animals to choose which social interactions to engage in provides an important way to contextualize the results of no-choice behavioral experiments. More studies of the mechanisms and outcomes of mixed-species group formation are needed to gain a full understanding of social behavior.
Supplementary Material
Supplementary data are available at Journal of Heredity online.
Table S1. Genotype combinations in each trial.
The D. melanogaster United States F1 genotypes used were designated as follows: genotype B = 360/335, genotype C= 732/775, genotype F = 486/380, where the number/number designation refers to the maternal and paternal inbred line, respectively. The numbers assigned to each DGRP line are arbitrary and have no numeric meaning. F1 genotypes produced from the D. melanogaster Caribbean inbred lines were arbitrarily labeled Q, R, and S, and the F1 genotypes produced from the D. simulans inbred lines were arbitrarily labeled X, Y, and Z.
Acknowledgments
We thank Sergey Nuzhdin and Roman Yukilevich for providing fly stocks. We thank Lydia Beaudrot and Scott Egan for helpful discussion about mixed-species groups. We thank Kim Hughes and 2 anonymous reviewers for feedback during peer review.
Funding
This work was supported by the National Science Foundation (IOS-1856577).
Data Availability
The data underlying this article are available in Dryad at datadryad.org, and can be accessed with http://doi.org/10.5061/dryad.1c59zw3vw.
References
Author notes
Brad R. Foley is now at Jam City, 3562 Eastham Dr, Culver City, CA 90232, USA
