


Abstract
How successful an individual or cohort is, in terms of their genetic contribution to the future population, is encapsulated in the concept of reproductive value, and is crucial for understanding selection and evolution. Long-term studies of pedigreed populations offer the opportunity to estimate reproductive values directly. However, the degree to which genetic contributions, as defined by a pedigree, may converge on their long-run values within the time frames of available data sets, such that they may be interpreted as estimates of reproductive value, is unclear. We develop a system for pedigree-based calculation of the expected genetic representation that both individuals and cohorts make to the population in the years following their birth. We apply this system to inference of individual and cohort reproductive values in Soay sheep (Ovis aries) from St Kilda, Outer Hebrides. We observe that these genetic contributions appear to become relatively stable within modest time frames. As such, it may be reasonable to consider pedigree-based calculations of genetic contributions to future generations as estimates of reproductive value. This approach and the knowledge that the estimates can stabilize within decades should offer new opportunities to analyze data from pedigreed wild populations, which will be of value to many fields within evolutionary biology and demography.
The concept of fitness is central to the study of natural selection and evolution (Endler 1986). At a given time, natural selection, in the absence of frequency dependence, is generally expected to lead to the maximization of mean population fitness (Lande 1976). However, fluctuating environments greatly complicate this maximization (Lande 2007). Overlapping generations and fluctuating environments are frequently present in natural populations, and make it less clear how to effectively estimate the fitness that selection is acting on in these systems. It is possible that insights can be gained using data from long-term studies which include pedigree information. Such studies not only offer a chance to look at fitness, realized and expected, many generations in the future, but also provide the opportunity to access what predictions would have been made only a few generations after data collection started. Modern genotyping has further increased the value of these studies by allowing construction of high-accuracy pedigrees (Sardell et al. 2010; Huisman 2017). This means that questions about fitness that were previously limited to theoretical studies can start to benefit from information using empirical pedigree data.
Regardless of the exact definition, estimating individual fitness is about characterizing how many descendants individuals have left, usually for the purpose of understanding how environmental conditions, class structure, or phenotypic traits influence the underlying propensities of individuals to leave descendants. This is commonly thought of as the genetic contribution that an individual makes to the following generation, relative to other individuals in that population. It is, therefore, common to the use the number of offspring produced as a fitness estimate (Clutton-Brock 1988) or the total number of grandoffspring (Hunt et al. 2004; Bolund and Lummaa 2017), accounting accordingly for the relationships to different descendants. This kind of fitness definition can be problematic when parents and offspring interact (Wolf and Wade 2001; Hadfield 2012; Thomson and Hadfield 2017). Furthermore, fitness estimates of this type are complicated by the presence of age structure and overlapping generations in a population. There is general agreement, at least in theory, that fitness is a measure of genetic representation in the future population (Stearns 1976; Charlesworth 1980; Endler 1986). This appears to naturally lead to an estimate of individual fitness that is determined by a combination of an individual’s reproductive output and the survival, and reproduction, of its descendants.
An alternative concept closely related to fitness, which accounts for both age structure and overlapping generations, is the reproductive value. As a concept it has caused much debate and confusion since the idea was first published (Samuelson 1978; Caswell 2001; Crow 2002). The idea is usually attributed to Fisher in 1930 although he actually first discussed it in a paper 3 years earlier (Fisher 1927). The discovery of this 1927 paper has gone a long way to explaining much of the confusion that has surrounded his writing in 1930 (Crow 2002). Despite this, there are still questions around the correct interpretation in its original form and there has been much discussion about what exactly Fisher meant, under what conditions it applies, and to what extent the ideas were already present in the literature (Crow 2002; Grafen 2006; Galindo 2007). However, there is general consensus that the reproductive value is the expected contribution an individual will make to some future population given its current age (Crow 2002; Grafen 2006). Theoretically it tracks a gene down an individual’s pedigree, seeing how well that gene is represented in the future population with the expectation conditional on the pedigree. It does not, therefore, take into account the effect of the genetic background on which that gene finds itself, and is expected in most situations to differ greatly from the realized genetic contribution (Barton and Etheridge 2011). As time passes estimations initially considered as expected genetic contributions will converge on the theoretical idea of a reproductive value (Grafen 2006).
Typically, reproductive values are calculated using survival and fecundity information arranged in matrix projection models, which give a reproductive value for each age or stage included in the Leslie matrix (Caswell 2001). This approach can be extended to get trait value-specific reproductive values using integral projection models (Merow et al. 2014). By necessity these models use current information to project forward, assuming that the life history of the population remains constant through time (Caswell 2001). In situations where these assumptions may not hold it is difficult to assess the accuracy of predictions from these models. Theoretical work, using simulated biparental pedigrees, has shown that individual reproductive values are expected to stabilize within 10 generations. The value at which these, theoretical, individual reproductive values stabilize is largely determined within a few initial generations (Barton and Etheridge 2011). However, work on how the expected genetic contribution actually behaves over time, in wild populations and in fluctuating environments, is currently lacking.
To investigate the potential use of pedigree-based estimates of genetic representation as empirical proxies for reproductive value, we developed an approach for calculating genetic representation of any individual, or group of individuals, from an additive genetic relatedness matrix. It became apparent at an early stage that these calculations can be greatly affected by pedigree incompleteness, which can be particularly acute when populations are not closed, as is the case for most monitored wild populations. We therefore present a method that accounts for pedigree incompleteness by expressing genetic representation of focal individuals in proportion to all representation attributable to them and their contemporaries. We developed this system in the course of analyses of the pedigree from the Soay sheep (Ovis aries) population on St Kilda, in the Outer Hebrides (Clutton-Brock and Pemberton 2004). We present results using our method, and investigate the time frame required for calculations of expected genetic contributions to stabilize, such that they may be interpretable as estimates of reproductive value.
Algorithm
In this section, we describe a general system for calculation of genetic representation in a population conditional on a pedigree, that would be interpretable as realizations of reproductive value, once stabilized. In the next section, we apply this algorithm to an empirical data set, in order to investigate the time frames required for this stabilization to be approached.
In order to generate statistics on genetic representation arising from descent, we developed a system of truncating a pedigree such that relatedness between a set of focal individuals and the rest of the pedigree would represent only relatedness arising from direct descent. For a population which consists of a set of individuals, Pt, at time, t, a focal individual, or set of individuals (e.g., a specific sex and/or cohort), Ft, are identified for which calculation of future genetic contributions are required. A separate set of all the individuals alive in the population, , at the future time point of interest, , is also compiled. For any Ft, pedigree links between these focal individuals and their parents are deleted while links to all known descendants are retained, creating a truncated pedigree. An additive genetic relatedness matrix, , for Pt consists of elements (Walsh and Lynch 2018, chapter 19), where is the coefficient of coancestry between individuals i and j (Lynch and Walsh 1998, chapter 7). An altered genetic relationship matrix, , can instead be constructed using the truncated pedigree based on Ft. In a pedigree from which all ancestors of a focal individual (or individuals) i have been removed, coancestry between such individuals and another individual j arises solely from descent. The sum of the relationships in this matrix between each individual, i, in Ft and is calculated, , where i indexes the individuals in Ft (which may be a single individual) and j indexes the individuals in . This values gives an estimated genetic contribution, for each focal individual, i to the future population (Box 1). For example, if a focal individual was still alive, then their existence would contribute a value of 1 to the summed value. Similarly, offspring add 0.5 each. Repeating the process for , using increasing values of , allows investigation of how the estimated genetic contribution of Ft to the population changes temporally. As , the , where is the combined reproductive value for Ft. Calculations of genetic representation may be made separately for different sets of Pt, for example, for male and female focal individuals, and for specific cohorts, estimated genetic contributions must be calculated using all extant individuals at , regardless of their sex or year of birth.
Calculations of genetic contributions as described to this point represent the absolute representation of individuals or groups in terms of expected genome copies. The relevant quantity for most biological questions will concern not the absolute number of copies, but the proportional representation in the future state of the population. As such, expected number of genome copies must be standardized by dividing by population size at . More generally, the standardization may be made by the maximum possible representation of an individual or group of individuals in , in relation to the representation from all extant individuals in the population at the time of the focal individuals’ birth (i.e., when ). This more general standardization will provide for sensible calculations of reproductive value in open populations (Box 1). In practice, this standardization requires that the pedigree-based representation of all extant individuals, Pt be calculated, exactly as described above for Ft. All extant nonfocal individuals may be treated as 1 large cohort of unrelated individuals, by deleting all parental links for extant individuals at a given time. Then, as above, their contributions to may be obtained using the relationship matrix derived from this modified pedigree.
Application
Study System
The Soay sheep (O. aries) population of St Kilda, in the Outer Hebrides, has been the subject of an individual-based, long-term study since 1984 (Clutton-Brock and Pemberton 2004). All sheep that are part of the core population are individually marked. The date of birth of the majority of lambs born within the study area is known through observational data. Adult migrants into the population are also tagged so that they can be individually identified. Detailed population monitoring ensures that the date that most individuals appeared in the population, through birth or migration, and the date that individuals died, can be determined with high precision. Population size can vary greatly between years (Clutton-Brock and Pemberton 2004). Highly reliable maternities are known from observational data during the spring. Maternities are regularly confirmed, and occasionally corrected (primarily for the attribution of maternity to stillborn lambs) using genetic data. Paternities are assigned on the basis of 384 SNP loci, chosen on the basis of high minor allele frequency and an even distribution throughout the genome (Bérénos et al. 2014). Paternity assignment is conducted using MasterBayes (Hadfield et al. 2006) and SEQUOIA (Huisman 2017). Paternity assignments are made with >99% confidence in the majority of cases (6542 of 7014 individuals).
Data Selection
Our analysis includes individuals born alive during or after the spring of 1985 up until the spring of 2015. The majority of mortality occurs over the winter and early spring. We therefore consider an individual to have survived a given year, and transitioned to the next age group, if they were known to have survived until the end of April of the following calendar year. This allowed an estimate of the number of individuals of each age group alive in any given year, with the first age group consisting of new born individuals. After this point any reference to a year will refer to a census year, rather than a calendar year. Winter survival, and inclusion in the following census year, is defined as survival into May.
In order to acquire annual, age-specific, survival estimates each individual needs to be assigned as currently being either alive or dead and all dead individuals need to have a year of death. For individuals with no recorded death information, the last time the sheep had been 1) assigned as a parent, indicating that it was alive during a specific rut (November) for males, or spring for females 2) captured, or 3) observed in 1 of 30 annual censuses of the study area, was used to estimate a minimum possible date of death. Individuals were assumed to have died during the winter following the last evidence that they were alive. For individuals without a known birth year the date that they first appeared in the data set was estimated similarly. Ignoring rare cases where individuals did not have a sex recorded (or were castrates) there were 4912 female and 5387 male individuals in the pedigree, of which 3223 females and 3491 males have both a birth and death year recorded. Individuals that were known to be born after 1984 numbered 3354 and 3955. A total of 2247 individuals (1144 males and 546 females) required an estimated death year.
We applied the calculations described in the “Algorithm” section, using the makeA() function of the nadiv package (Wolak 2012) to generate the modified representing relatedness between focal and descendant individuals, arising only from direct descent. The process was repeated with each cohort separately set as Ft with being each consecutive year after birth.
Properties of Pedigree-Based Expected Genetic Contributions in Individuals and Cohorts
There is a nontrivial level of immigration of males into the population, with a mean of 9 individuals per year since 1985 (Figure 1A). These males do not generally take up residence in the study area, but rather are individuals that are observed in the study area during the rut, and that sire offspring. Female immigration is much lower, with a mean of 1.4 (Figure 1A) individuals per year. While the numbers of immigrants are modest, immigrants tend to have substantial reproductive success, with immigrant males, in particular, siring on the order of 20% of lambs born in the study area (Figure 1B). Consequently, the denominator in our standardization for genetic contributions, that is, the total discernible contribution to the future genetic constitution of the population, decreases with the length of time that elapses between the existence of the focal individual(s) and the time at which subsequent genetic contribution is ascertained (Figure 2). The calculation we make that spans the greatest time period is for the total contribution of males extant in 1985 to the genetic composition of the population in 2015. The proportion of the genomes in the population in 2015 accounted for by the pedigree from extant males in 1985 is 0.078 (out of a possible 0.5 in complete absence of immigration and other causes of pedigree incompleteness). This calculation is slightly more favorable for females, where a proportion of 0.206 of the 2015 population genomes can be attributed to extant females in 1985. This disparity between the sexes will have arisen primarily because genetic sampling was less complete early in the study, such that paternities are somewhat sparser in early years.

Rates of migration into the study system (A) in terms of numbers of individuals that ultimately bred in the study area, by sex, and (B) proportions of maternities and paternities attributed to individuals that are not known to have been born in the study area.
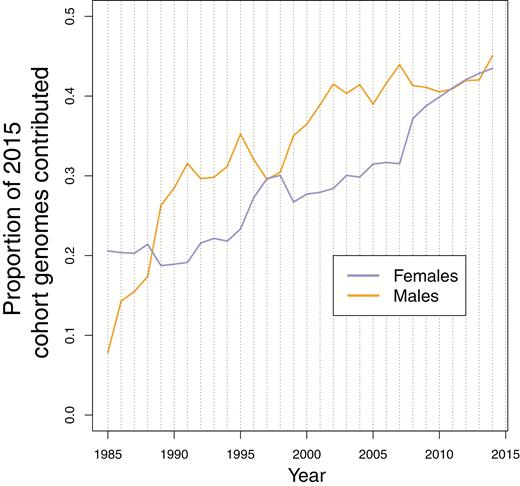
Proportion of the genomes attributable to the past population. The proportion of genomes present in the 2015 cohort which are attributable to extant individuals in all previous years for both females (purple) and males (orange). In the absence of any migration this contribution would constantly be 0.5 for each sex.
Individual genetic contributions stabilize relatively quickly (Figures 3 and 4). Although fluctuations in individual values occur across all time intervals that we can assay, several aspects of stability are evident, even from within the life span of a Soay sheep. For males (Figure 3), individuals with very low representation after 5 years rarely become major contributors of descendants to the population. Among males with nontrivial representation after approximately 5 years, visual inspection of Figure 3 shows that large subsequent changes in the rank order of genetic contributions are rare. Consequently, many of the correlations of individual genetic contributions in the year of birth + Δt, with individual contributions in the final year of data (2015), are often as high as 0.8 by Δt = 5 years after birth (Figure 5).
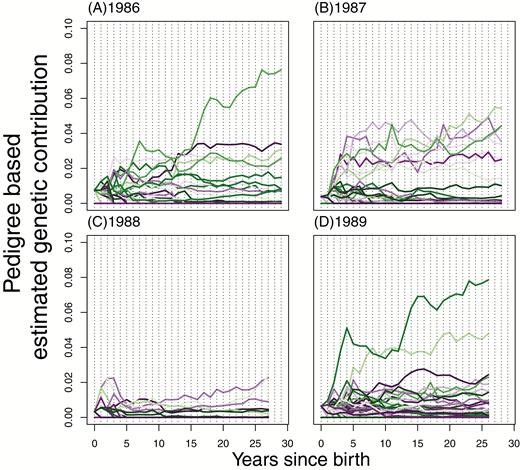
Individual, pedigree-based, estimated genetic contributions of males from some of the earliest cohorts. The 1986–1989 cohorts are plotted with each line representing a separate individual born that year, showing their pedigree-based genetic contributions estimated each year after their birth.
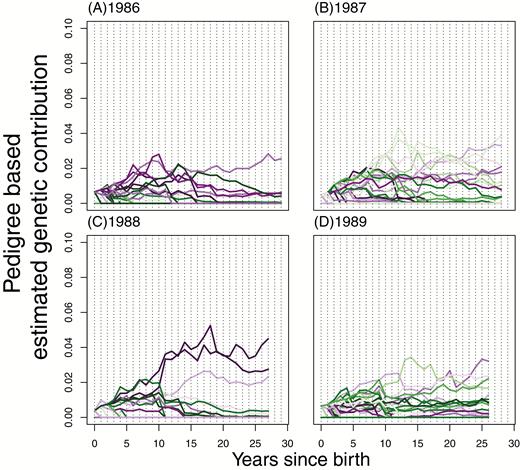
Individual, pedigree-based, estimated genetic contributions of females from some of the earliest cohorts. The 1986–1989 cohorts are plotted with each line representing a separate individual born that year, showing their pedigree-based genetic contributions estimated each year after their birth.
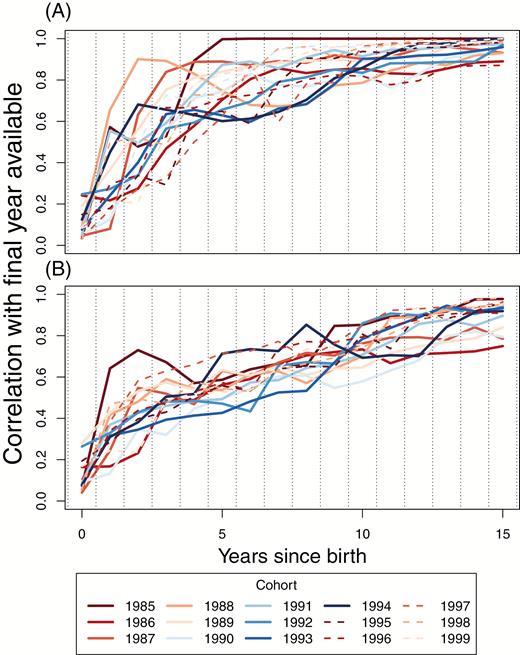
Correlations between pedigree-based estimated genetic contributions for the 1985 through 1999 cohorts, for (A) males and (B) females, with the last year available (2015). Each line represents the correlation of individuals genetic contributions in a given year after birth, with those in 2015, for separate cohorts.
Fluctuations through time in the genetic contributions of females to the future genetic composition of the population (Figure 4) are of qualitatively similar magnitude and distribution to males (Figure 3). However, because the variance in fitness in females is lower, these fluctuations occur across a narrower range of values, and so the rank order of contributions changes more through time (Figure 4). Consequently, the correlation of female individual contributions with those in the final year (Figure 5B) does not typically increase as quickly as that for males (Figure 5A).
The total cohort estimated genetic contributions start to stabilize even more quickly than individual contributions, with many of the cohorts appearing to be relatively stable after around 5 years for both sexes (Figure 6). The largest source of within- and among-cohort variation in genetic contributions occurs in the first year; declines associated primarily with overwinter survival seem to be the main determinants of the long-term genetic contributions of each cohort (Figure 6). While the genetic representation of cohorts can become relatively stable very quickly, there are also notable fluctuations in some cohorts between the ages of approximately 3 and 8 (Figure 6). These are normally reductions in genetic representation, arising because of the death of an unusual number of individuals of a given cohort. Because of the unstable dynamic of the population size and composition, few cohorts experience similar sequences of demographic rates, and so it is hard to formulate possible explanations for these fluctuations. It may be relevant that during this period of the life cycle (i.e., reproductive adults), the total reproductive value of a given cohort is concentrated in the smallest number of individuals. As such, these fluctuations could primarily be manifestations of demographic stochasticity, that is, drift. The initial increase in the correlations for the cohorts is faster than that seen in the individual correlations (Figures 5 and 7).
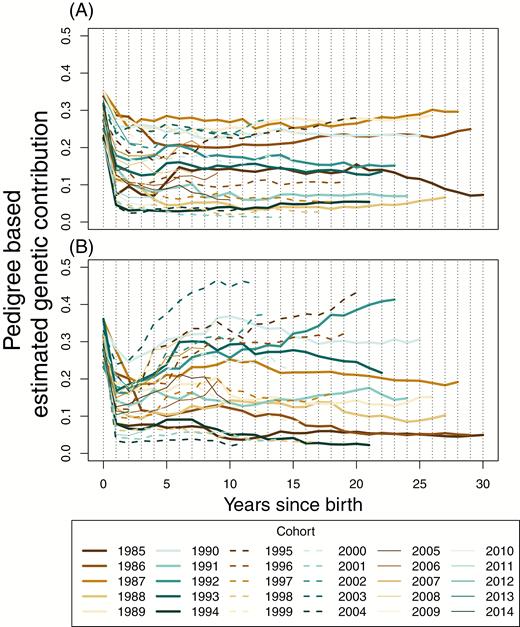
Total pedigree-based estimated genetic contributions for (A) male and (B) female cohorts. Each line represents a separate cohort from 1985 to 2014.
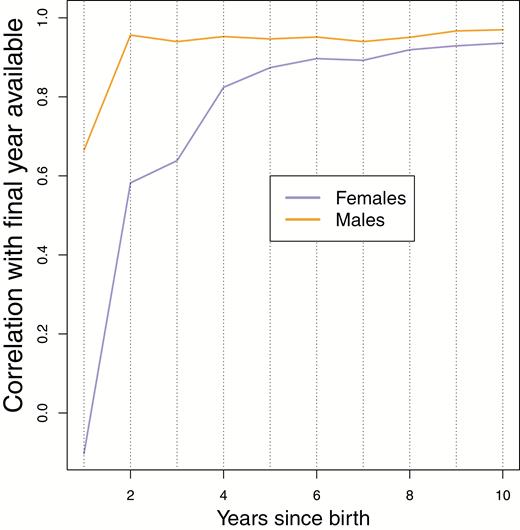
Correlations between the pedigree-based, estimated genetic contributions for each cohort from 1985 to 2004, in years after their birth, with the last year available (2015). It can be seen that at time progresses the correlation with the pedigree-based estimated genetic contributions for the cohorts in 2015 quickly becomes very high for both males and females.
Discussion
The concept of reproductive value is central to much theory in population and evolutionary biology. However, reproductive values are rarely used in empirical practice, particularly in evolutionary studies such as those estimating the form of natural selection. The method presented here is both intuitive and easily implemented, and thus has the potential to facilitate empirical studies using estimates of reproductive values for individuals and groups of individuals. The necessary information to implement the approach is collected in many long-term studies in the form of pedigree information, and is the same information necessary for inference of quantitative genetic parameters, which is increasingly common in the wild (Wilson et al. 2010). The type of information that is estimated should be valuable to ecologists, demographers, and quantitative geneticists and we expect analysis based on this method will be useful for answering questions in many subject areas. The fact that the estimated genetic contributions appear to settle as quickly as they do, even in a variable environment, might be somewhat unexpected but should help reassure people that their calculation, and use, is worthwhile for the long-term data sets currently available.
Intuition might initially suggest that the unstable dynamic of the Soay sheep population (Clutton-Brock and Pemberton 2004; Figure 8A) size and structure would act to delay stabilization of reproductive values. However, any such effect seems to be modest, at least at the cohort level. Figure 8B,C shows initial trajectories of groups of 4 cohorts born preceding and after years of major reductions in population size. Differences among cohorts in their ultimate genetic contributions are largely determined by the levels of first-year mortality that they experience. This first-year mortality, and the consequences for the longer-term breeding success of that cohort, is highly influenced by the population size that year Coltman et al. (1999). Despite the number of the adult females, and consequently lamb production, remaining relatively stable through time (Figure 8A), there is substantial variation in first-year survival. This is represented in Figure 8A by the notable fluctuations in the size of yearling component of the population among years. Even outside of years with major reductions in population size, very high first-year mortality can occur (consider especially the 1997 and 2010 cohorts in Figure 8B,C, particularly for males). These mortality rates seem to determine genetic representations more than subsequent conditions. For cohorts beyond the lamb stage, experiencing a year with a major reduction in population size has very little effect on demographic contributions. This counterintuitive property of the estimated demographic contributions is particularly evident in the 1997–2000 group of cohorts, in Figure 8B,C, the 1997 and 1998 cohorts experienced multiple large reductions in population size during their first years of life, but have nonetheless relatively stable genetic contributions (Figure 6) through the large reduction in population size that happened between 2001 and 2002 (Figure 8A). This occurs because, while such cohorts suffer high mortality, so too do the other cohorts of animals of similar age. As such, high mortality reduces the absolute size of a cohort, but it does not necessarily greatly change the size of the cohort in proportion to the sizes of other extant cohorts.
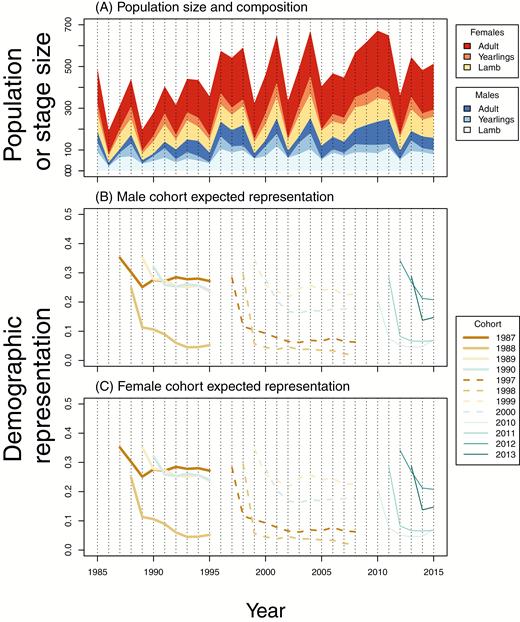
The dynamic of the size and composition of the population of Soay sheep using the study area in Village Bay on St Kilda (A). The class sizes in part (A) represent individuals resident in the study area, and are therefore slightly different from the data from which we calculate expected genetic contributions. (B) and (C) show estimated genetic contributions of selected male and female cohorts, respectively, to the population in future time intervals. Focal cohorts are identifiable from the year in which each respective line begins in parts (B) and (C); line colors and styles correspond to those used to identify cohorts in Figures 5 and 6.
Pedigree-based estimation of reproductive value could prove particularly useful in the study of cohort effects, which is an area of substantial current interest. The idea that early life conditions play a role in the future success of groups of individuals, often referred to as cohort effects, is well established as an important, but complex, component of population dynamics in wild populations (Albon et al. 1987; Beckerman et al. 2002; Lindstrom and Kokko 2002). Differences in the vital rates due to conditions experienced by different cohorts have now been recorded in many different wild populations where long-term data are available (Nussey et al. 2007; Hamel et al. 2009; Pigeon et al. 2017). These environmental variables have long-lasting consequences on the average success of individuals within a given cohort (Forchhammer et al. 2001). Calculations of net reproductive values of individual cohorts could prove a very useful and powerful way of encapsulating how successful an individual or, group of individuals, is for studies of cohort effects, by relating the general notion of success to a quantity that is maximized by natural selection. Most calculations of reproductive value assume a stable age distribution (Caswell 2001), and so do not return cohort-specific values that represent effects of stochasticity, and thus cannot be related to differences among cohorts. Since all aspects of environmental stochasticity that are relevant to reproductive value will be represented in a population’s pedigree, the promise of using pedigrees may overcome a key hurdle to relating the notion of success of a cohort to the firm foundation generated by the concept of reproductive value. It is of note that some progress has been made on algorithms for calculating reproductive values in stochastic environments (Tuljapurkar 1989; Tuljapurkar and Lee 1997).
Engen et al. (2009, 2011, 2012, 2014) have shown that the effective average value of selection in a stochastic environment, accounting for both survival and reproduction, within and/or across age classes, is given if selection coefficients (gradients and/or differentials) are calculated using contribution of individuals to the population’s total reproductive value at the next time step as a measure of fitness. Applications of this so far (e.g., Kvalnes et al. 2016) have made these calculations using mathematics based on the stable age distribution to obtain age- or class-specific values for reproductive value. However, in a stochastic environment, the age distribution will not be stable, and furthermore, age- and class-specific reproductive values may vary in time. Calculating estimates of reproductive value based on expected genetic contributions given by a pedigree may provide further opportunities for assaying fitness and inferring selection, especially in studies of environmental stochasticity.
Pedigree incompleteness, particularly due to high levels of migration, may be the biggest challenge in allowing estimated genetic contributions to be assessed in other wild populations. The suitability of this approach would have to be considered for each study system separately and appropriate adjustments made. For some purposes, such as understanding immigration itself, immigration may not be a problem, but rather a process that pedigree-based calculation of reproductive value (or similar approaches, see Chen et al. 2019) is well-suited to tackle. Pedigrees may also be incomplete if there is a lack of informative molecular markers available to make parentage assignments. Insufficient molecular data may also lead to nontrivial rates of erroneous parentage assignments. These kinds of complexities of empirical pedigrees are probably not a major issue in the Soay sheep study system, where the majority of paternities are determined by overwhelming molecular data (Bérénos et al. 2014), but they could present important considerations in other systems.
Despite the existence of important theoretical work indicating that reproductive value is the quantity most directly maximized by natural selection (Grafen 2006), it does not necessarily follow that empirical estimates of reproductive value, for example, based on genetic contributions calculated from a pedigree, are sensible measures of fitness for studies of natural selection. For example, when individuals interact, measures of reproductive success that conflate the direct fitness (e.g., production of fertilized zygotes) of the interacting individuals will not generate measures of selection that correctly predict evolution (Hadfield 2012; Thomson and Hadfield 2017). Another situation where pedigree-based estimates of reproductive value could be very misleading would be in estimation of the genetic variance of fitness, for example, as motivated by the fundamental theorem of natural selection (Fisher 1930). All contributions of demographic stochasticity to a pedigree will generate covariance in estimated genetic contributions between progenitors and descendants, in proportion to their relatedness. This same relatedness between individuals in a pedigree is precisely the information that mixed model-based approaches (Wilson et al. 2010) use to estimate genetic parameters. Consequently, demographic stochasticity would almost certainly generate upwardly biased estimates of genetic variance for fitness, if such analyses were conducted on pedigree-based estimates of reproductive value.
It is worth noting that although we have discussed the calculation of expected genetic contributions as potential estimators of reproductive values, which are the target of selection (Grafen 2006), these are not the same as the actual genetic contributions that an individual, or cohort, will ultimately make to the future population. This is discussed in detail by Barton and Etheridge (2011). The pedigree-based genetic contributions we calculated are based on expected genetic relationships between individuals using descent. While parents always contribute equally to offspring (autosomal) genomes, it does not follow that all grandparents contribute exactly one-quarter of the genetic compliment of their grandoffspring. Rather, because of segregation and recombination in parents, grandparental contributions to their grandoffspring follow a random distribution (Hill 1993). Theory predicts that these actual genetic contributions will take far longer to equilibrate than will expected contributions (Barton and Etheridge 2011). This does not invalidate the concept of reproductive value as estimated using a pedigree for studying natural selection and demography, since the deviations between expected and realized contributions represent contributions of segregation to genetic drift, which will generally be unrelated to other, more deterministic processes.
Calculation of reproductive values allows quantification of success in a way that is intuitive as an ecological concept, while at the same time directly relates to the target of selection, the reproductive value, as understood at a theoretical level (Grafen 2006). The ability to calculate the same metric at both the cohort and individual level offers new opportunities to compare these values. Additionally, tracking how estimated genetic contributions change through time allows important dynamics within a population to be identified. The presence of large fluctuations, or points of stabilization, within a given system, offers the opportunity to link key moments in the determination of realized genetic contribution to causal ecological factors. Wider application of the developed approach may be limited due to the required completeness of the pedigree and life-history data. Nonetheless, the timescales of the stabilization observed within the Soay sheep data demonstrate the potential for pedigree-based reproductive values to provide valuable information, potentially even in studies spanning shorter time periods.
Pedigree (A) is an imaginary pedigree of what might actually be observed, looking at 2 cohorts (Ft and ), born at times t and , respectively, along with their ancestors. Calculating the contribution that individuals in this fictitious Ft cohort made to the population at would use an altered pedigree as shown in B. Here all the information regarding the ancestors of the Ft cohort is removed and, as a consequence, there is no information about the relatedness between the individuals in this cohort. In pedigree (B) individuals in the population at that arise from the Ft cohort are shaded red (including these individuals themselves) while contributions from individuals that were alive before t are shaded in blue. Matrix (C) is an additive relationship matrix, , constructed based on the relationships shown in pedigree (B), with all individuals from the Ft cohort, along with all individuals present in the population before this, considered to be unrelated founders. In matrix (C), as in pedigree (B), blue cells relate to contributions to the population at by individuals from <Ft while red cells are the contributions from the Ft cohort. The sum of each red column is the expected genetic contribution, , of a Ft individual in while the sum of all red cells is this value for the cohort as a whole. The sum of all shaded cells is used to correct these values for fluctuations in population size and for immigration.
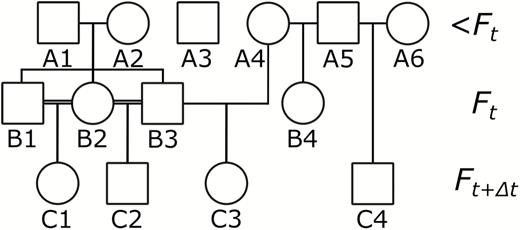
(A) An example pedigree showing 2 cohorts (Ft and ) along with their ancestors.
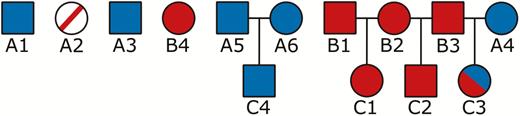
(B) An altered pedigree based on pedigree (A) where the relationships between the Ft cohort and their ancestors have been removed. Individuals shaded red are those which contribute to the Ft cohorts’ expected genetic contribution. Those with a line through them died prior to .
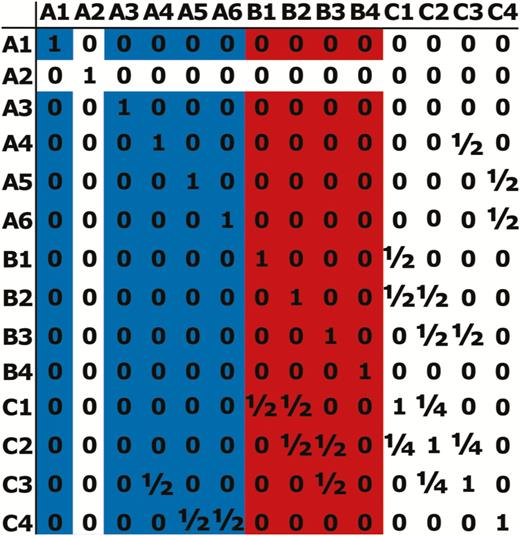
(C) An additive relationship matrix, , constructed using pedigree (B). The sum of the cells shaded red is the uncorrected Ft total cohort expected genetic contribution, while each column of red shading is each Ft individual’s uncorrected expected genetic contribution. The sum of all the shaded cells is total genetic contribution made by all extant individuals to the population and this value is used to correct the expected genetic contribution for the Ft cohort for changes in population size and migration.
Funding
The long-term project on St Kilda has been largely funded by the UK Natural Environment Research Council. M.B.M. is supported by a University Research Fellowship from the Royal Society (London). D.C.H. is funded by a PhD Scholarship from the University of St. Andrews.
Acknowledgments
We thank the National Trust for Scotland and Scottish Natural Heritage for permission to work on St Kilda and NYS, QinetiQ, and Eurest for providing logistics and other support on the island. We thank all the project members and volunteers who have helped with field work on the island and everyone who has contributed to keeping the project going over many years, including S. Albon, T. Clutton-Brock, T. Coulson, M. Crawley, L. Kruuk, D. Nussey, J. Slate, and A. Wilson.
References
Kvalnes T, Saether B-E, Haanes H, Røed KH, Engen S, Solberg EJ.
