


Abstract
The production of shale oil and gas is increasingly recognized as being influenced by temperature fields. Hydraulic fracturing involves the injection of substantial amounts of fracturing fluid into the reservoir, which alters the temperature field distribution and, in turn, affects shale gas production. In this work, we study the shale formations of Longmaxi, analyzing the factors that affect the thermophysical properties of shale under normal pressures. Using Hot Disk equipment, thermophysical properties were measured and a thermal conductivity model for shale was formulated from such data. The results reveal that mineral composition, temperature, and bedding characteristics are the primary determinants of shale thermophysical properties, while no significant correlation was found for porosity, permeability, or water saturation. We also identified variations for two distinct temperature ranges, below and above 60°C, as each exhibited different rates of change in thermophysical properties. Notably, pronounced bedding leads to less uniform heat transfer within the reservoir. This study offers theoretical insights into predicting temperature changes during hydraulic fracturing, which may aid oil and gas production.
1. Introduction
Hydraulic fracturing is a powerful method for unlocking shale oil and gas resources. It is a process that involves injecting fracturing fluids into the reservoir, thereby disrupting the natural subsurface temperature profile. The temperature dynamics within these reservoirs are critical, as they directly influence the shale's capacity to adsorb and desorb hydrocarbons. Notably, an increase in temperature is inversely proportional to the shale's adsorption capability, as evidenced by the findings. A deep understanding of the thermophysical properties of shale reservoirs is essential for accurately simulating temperature profiles following hydraulic fracturing, and for providing temperature data for subsequent operations.(Enayatpour S and Patzek T, 2013) Such knowledge is useful for optimizing post-fracturing activities, and for forecasting reservoir temperatures throughout the production lifecycle, as illustrated in the studies by Xu et al. (2021) and Wang et al. (2022).
The thermophysical properties of rocks, such as thermal conductivity, specific heat capacity, and thermal diffusion coefficient, are shaped by a range of variables. These include mineral composition, temperature, pressure, burial depth, and water content, as noted by Gunn et al. (2005). Zhao et al. (2012) discovered through experiments that rock thermal diffusivity first increases and then decreases as water content rises. The specific heat capacity of water is relatively high, so the higher the moisture content in rocks and soil, the greater the specific heat capacity. Zhang et al. (2017), in their study of heavy oil reservoirs in the Chunguang Oilfield, observed that both the thermal diffusion coefficient and specific heat capacity increase with water saturation. They also proposed using acoustic logging measurements to quickly estimate rock thermophysical parameters.
Previous related research has also concentrated on developing models for thermophysical properties. For instance, Berman and Brown (1984, 1985 and Berman 1988) performed fitting analyses on the traditional model. Specifically, they optimized the k parameter to obtain a new specific heat capacity model: |${{C}_p}( {\rm{T}} ) = 3{\rm{R}} + \mathop \sum \nolimits_i {{k}_i}{{T}^{ -{{i} / {2}}}}$|. Moreover, Whittington and colleagues (Hofmeister AM et al. 2009) established a mathematical model to calculate the specific heat capacity of rocks from the specific heat capacity of individual minerals:|$\ {{C}_p}( {\rm{T}} ) = {{C}_o} + {{C}_1} + {{C}_2}{{T}^{ - 2}}$|. This model mainly considers mineral composition factors. Additionally, Merrick (1983) established the Merrick model:|$\ {{C}_v} = ( {{{R} \!/ {a}}} )[ {f( {{{{380}} \!/ {T}}} ) + 2f( {{{{1800}} \!/ {T}}} )} ]$|. This model accounts for the average molar mass of the combustible material, which is represented by the parameter a.
Research on the thermophysical properties of conventional rocks is extensive, yet research on shale reservoirs remains limited. Shale's unique attributes, including low porosity, low permeability, high heterogeneity, and high organic content, set it apart from conventional rocks and influence its thermophysical properties (Kim et al. 2012; Wang et al. 2014; Albert et al. 2017; Egboga et al. 2017). Recent studies have shed light on the thermophysical behavior of shale. For instance, Zhou et al. (2016) discovered that the thermophysical properties of the Nong'an oil shale are anisotropic, and the thermal diffusion coefficient changes little with temperature. Moreover, the thermal conductivity and specific heat capacity remain stable with temperature changes. Wang (2011) utilized the Shotherm QTM (quick thermal conductivity) meter to determine that factors like bedding and density significantly influence oil shale's thermal conductivity. Furthermore, Wang et al. (2018) observed that oil shale's thermal conductivity decreases with rising temperature in different directions.
Although there is an abundance of research on the thermophysical properties of various rocks, there has been little research on the thermophysical properties of shale, and there are few experimental studies on shale reservoirs. Furthermore, previous rock thermophysical models are not applicable to shale reservoirs. As a result, there is limited understanding of the factors influencing shale's thermophysical properties. Therefore, in this study we use Hot Disk experimental instruments to measure the thermophysical properties of Longmaxi Formation shale gas reservoirs. A series of experiments were designed to investigate the thermophysical properties under different conditions, and analyze the factors influencing the thermophysical properties. Based on the experimental results, we establish a novel thermophysical model to accurately characterize the thermophysical properties of shale. The main objective is to provide a theoretical basis for understanding the mechanisms of heat propagation in shale reservoirs, enabling more accurate predictions of bottom-hole temperature fields.
2. Materials and methods
2.1. Experimental samples
The rock samples used in this study were from the Upper Ordovician Wufeng Formation and the Lower Silurian Longmaxi Formation, of the Jiaoye 11–4 and 41–5 wells in the Jiaoshiba area of the Fuling block (see Fig. 1). The thickness of the reservoir ranges from 200 to 300 m at a depth of ∼2200–3200 m (Table 1), with the lower segment often being a prolific gas reservoir. The average total organic carbon (TOC) content of the samples from both wells is >1.6%, indicating relatively high enrichment with organic matter.
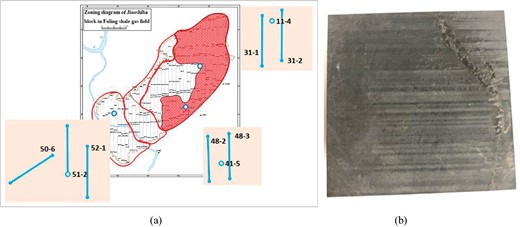
(a) Zone diagram of the Jiaoshiba area. (b) Shale samples with laminations used in this study.
Results of the reservoir analysis.
| TOC (%) | |||||||
|---|---|---|---|---|---|---|---|
| Well no. | Interval | Hole section (m) | Thickness (m) | Sample number | Average | Maximum | Maximum |
| Jiaoye 11–4 | Gas-bearing shale | 2264.3–2363.0 | 98.7 | 57 | 1.64 | 4.10 | 0.45 |
| clay shale | 2322.7–2363.0 | 40.3 | 12 | 2.95 | 4.10 | 2.43 | |
| Jiaoye 41–5 | Gas-bearing shale | 3052.7–3144.8 | 92.1 | 65 | 2.55 | 5.37 | 0.78 |
| clay shale | 3103.3–3144.8 | 41.5 | 38 | 3.22 | 5.37 | 1.10 | |
Analysis of the lithological characteristics of the deep shale strata within the Longmaxi Formation, utilizing oilfield geological data, formation microresistivity imaging, and enhanced core scanner processing, reveals a significantly layered structure within the reservoir. The lamination widths are observed to range from 0.01 to 0.07 mm, with a density of 3 to 12 laminations/cm. Notably, a subset of these laminations is distributed discontinuously throughout the formation. The deep shales of the Longmaxi Formation are mainly composed of gray-black carbonaceous shale, along with interbedded thin dark gray siltstone layers.
In the study area, the shale reservoir is characterized by a well-developed network of pores and fractures, encompassing both inorganic and organic pores, and both micro-fractures and structural fractures. Within the gas-bearing shale section, a considerable number of nanoscale pores are identified. Analysis of data from the two wells reveals a high organic matter content in this section, which exhibits an increasing trend with depth. It is likely that the studied shale reservoir has significant gas resources, because the presence of organic-rich shale, as complemented by the extensive porosity and fracture system, indicates a favorable environment for hydrocarbon accumulation. The block diagram and reservoir analysis results that demonstrate this are shown in Fig. 1 and Table 1.
2.2. Experimental apparatus
2.2.1. Instrumentation for measuring thermophysical properties
The thermophysical properties of shale have were measured using the Hot Disk TPS3500 thermal constant analyzer, as developed by Hot Disk Instruments in Sweden (Fig. 2). The measurement and calibration process is completely automated by the instrument, thus mitigating inaccuracies that may arise from manual testing and calibration and enhancing the precision. The instrument can measure samples in various forms, including solids and liquids. Moreover, it can measure the thermophysical properties of samples at stable elevated temperatures through a heating module. The testing mechanism of this instrument is based on the transient plane heat source method.
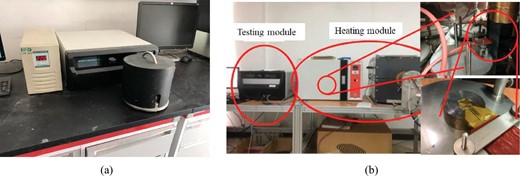
(a) The Hot Disk thermophysical analyzer and (b) its heating module.
The instrument requires high quality contact between the sample and probe, and it has a long measurement cycle. Therefore, after completing basic physical property measurements of porosity, permeability, and X-ray diffraction (XRD) analysis, all rock samples were finely polished on the test surface to increase the fit between the sample and the probe, ensuring high accuracy.
2.2.2. Instrumentation for measuring porosity and permeability
Porosity and permeability, which are basic properties for evaluating unconventional reservoirs, were measured using a KXD-Ш helium porosity analyzer and a YRD-CP200 pulse low-permeability analyzer. These instruments are known for their ability to make accurate measurements of low porosity and permeability, meeting strict experimental standards. The method we used for calculating these properties is described in Chen et al. (2021), which serves as a foundation for our study. The porosity is characterized as follows:
Here, p0 represents atmospheric pressure, and Vrc and Vsc denote the volumes of the reference cell and sample cell, respectively. The volume of the calibration block is Vc, the sample bulk volume is Vb, and the porosity volume of the sample is Vp. P1 and P2 are the pressures that are tested. T1 and T2 are the room temperatures. The formula for calculating porosity is
And the formula for calculating permeability is:
The upstream and downstream container volumes are represented by Vu and Vd, respectively, the attenuation index is denoted by |$\alpha$|, the viscosity of nitrogen is represented by |$\mu$|, and the coefficient of compressibility for nitrogen is represented by |$\beta$|. L and A represent the length and the cross-sectional area of the sample, respectively, while ΔP is the pressure difference between the upstream and downstream.
2.2.3. Instrumentation for ultrasonic testing
In this study, the propagation of ultrasonic waves through rock samples is investigated using the Olympus-5077R square wave generator and the Tektronix-DPO2024B oscilloscope. The square wave generator excites ultrasonic waves, which are then transmitted through the rock samples with the aid of a probe. The oscilloscope, positioned on the opposite side, captures and records these signals. The measurement of wave velocity in the samples enables an assessment of the degree of bedding development. Figure 3 is the schematic diagram of the experimental set-up and the photo of the experimental equipment.
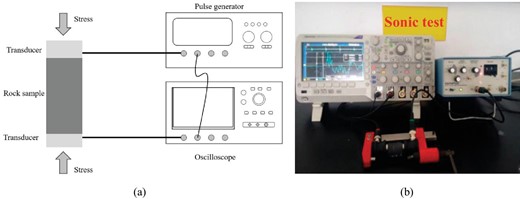
Shale ultrasonic test: (a) schematic diagram of the experimental set-up and (b) photograph of the experimental equipment.
2.3. Experimental methodology
XRD was performed on rock samples to determine their mineral compositions, and understand how this influences the thermophysical properties of shale. Four experiments were conducted to explore the influence of various factors, including porosity and permeability, water content, temperature, and bedding, on the shale's thermophysical characteristics.
2.3.1. Experimental scheme for porosity and permeability
Porosity and permeability testing was performed on all rock samples, and then the samples were polished to prepare for subsequent thermal property measurements. The experimental procedure is as follows:
Rock samples are cut and dried at 70°C for a minimum of 12 hours without polishing.
Porosity and permeability are measured using the average values from three tests.
The samples are polished and subsequently dried at 70°C for at least 12 hours.
Thermophysical properties are measured at room temperature (20°C), with the average of three tests taken.
2.3.2. Experimental scheme for water content
In this experiment, the Hot Disk TPS3500 thermophysical analyzer and a centrifuge are employed. Five cylindrical rock samples were selected for analysis. Figure 4 is the schematic of the experiments. The steps are as follows:
A rock sample is immersed in distilled water for ∼24 hours until its weight stabilizes.
The mass and thermophysical properties of the sample are measured.
The sample is centrifuged for 5 minutes at a rotation speed of 8000 rpm.
Steps (ii) and (iii) are repeated until the mass of the sample remains constant.
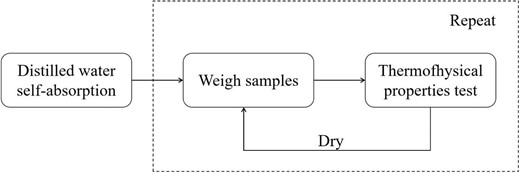
Schematic of the experiments.
2.3.3. Experimental scheme for temperature
The thermophysical properties of rock samples were measured at varying temperatures using the Hot Disk heating module. For this segment of the experiment, three samples were selected. The procedure is as follows:
The rock samples are polished in both the vertical and horizontal bedding directions, and then dried at 70°C for no less than 12 hours.
Each sample is loaded into the heating module with the probe positioned according to the operation manual.
Four temperatures for measurement are reached starting from room temperature—50, 70, 90, and 120°C—with each maintained for 30 minutes.
After the specified heat preservation period, the thermophysical properties are measured every 5 minutes, with the average value taken from three distinct tests.
2.3.4. Experimental scheme for bedding
Three groups of Longmaxi Formation shale samples were selected to compare the effects of distinct bedding architectures on the thermophysical properties. Three groups of rock samples from the Lujiaping Formation were selected for comparison. The experimental protocol is as follows:
Drill cores are taken from the samples, both parallel and perpendicular to the bedding.
The samples are dried in an oven at 70°C for a minimum of 12 hours.
Thermophysical properties are measured at room temperature (20°C), with the average value taken from three separate tests.
The square wave transmitter, probe, and oscilloscope are connected for signal transmission and reception.
A coupling agent is applied to the probe, and wave velocity measurements are made in both the axial and radial directions.
3. Experimental results and analysis
3.1. Porosity, permeability, and thermophysical properties
Eight downhole rock samples from two wells were subjected to measurements of their thermal properties, porosity, and permeability. The findings are shown in Table 2.
Thermophysical properties, porosity, and permeability results.
| Sample no. | Thermal conductivity (W/mK) | Specific heat capacity (MJ/m³K) | Porosity (%) | Permeability (mD) |
|---|---|---|---|---|
| 11–4–1 | 3.568 | 2.048 | 1.603 | 0.000 918 |
| 11–4–2 | 3.571 | 1.717 | 1.668 | 0.000 702 |
| 11–4–3 | 3.391 | 1.894 | 2.017 | 0.000 861 |
| 11–4–4 | 3.227 | 1.667 | 2.007 | 0.000 943 |
| 11–4–5 | 3.310 | 1.839 | 2.340 | 0.000 993 |
| 41–5–1 | 3.353 | 2.138 | 1.697 | 0.000 726 |
| 41–5–2 | 3.218 | 2.221 | 1.893 | 0.000 843 |
| 41–5–3 | 3.261 | 2.397 | 1.753 | 0.000 976 |
This study focuses on the shale gas reservoir within the Longmaxi Formation, which is characterized by its low porosity and permeability. The porosity of the reservoir is observed to vary between 1.6% and 2.4%, with permeabilities ranging from 0.0007 to 0.001 mD. Furthermore, the thermal conductivity measurements are within the range of 3.2 to 3.6 W/mK, while the specific heat capacities are found to be between 1.6 and 2.4 MJ/m³K.
It is well established that permeability and porosity are distinct properties, even though they are often discussed together. Porosity quantifies the relative volume of void space within a rock, whereas permeability is a measure of the rock's capacity to facilitate fluid flow. The connectivity of pores is a critical determinant of permeability levels. In the context of shale gas reservoirs, interconnected pores can impede heat conduction by disrupting the contact between rock particles. This is significant because gases, including air and methane, exhibit substantially lower thermal conductivity and specific heat capacity than solid rock, thereby impeding heat transfer and storage within the reservoir (Askari R et al. 2015).
3.2. Factors influencing the thermophysical properties
3.2.1. Porosity and permeability
Figure 5 illustrates the lack of clear correlations between thermal conductivity, specific heat capacity, porosity, and permeability. The low porosity and permeability in shale gas reservoirs are attributed to the processes of compaction and diagenesis. Test results have demonstrated that within a single shale reservoir, the values of porosity and permeability are notably low and only exhibit minor variations. Consequently, the impact of porosity and permeability on the overall thermophysical properties of shale reservoirs is considered limited.
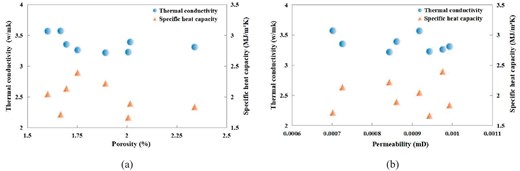
The effects of porosity and permeability on thermophysical properties: (a) effect of porosity and (b) effect of permeability.
3.2.2. Mineral composition
Figure 6 highlights that the predominant minerals in wells Jiaoye 11–4 and Jiaoye 41–5 are quartz and clay. Moreover, field studies have confirmed that quartz and clay minerals are the principal constituents of the Longmaxi Formation shale gas reservoir in Sichuan. The physical properties of rocks are directly influenced by the relative content of these minerals. The overall thermal conductivity of a rock is determined by its mineral composition, which encompasses the types of minerals present, their distribution, and mutual encapsulation effects (Clauser & Huenges 1995).
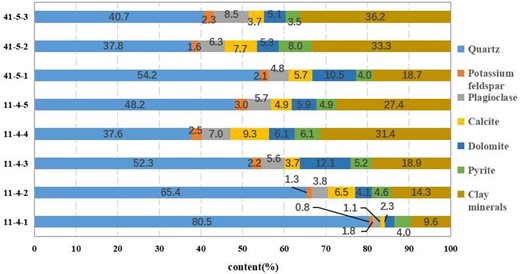
Mineral composition analysis for samples from Jiaoye 11–4 and Jiaoye 41–5.
The correlation between the thermophysical properties of shale and its mineral constituents, specifically quartz and clay, is depicted in Fig. 7. Examining the data reveals that the thermal conductivity of shale is positively correlated with the proportion of quartz. By contrast, an increase in clay content is associated with a reduction in thermal conductivity. While the relationship between specific heat capacity and the mineral composition is less uniform, a pattern can be gleaned: specific heat capacity diminishes as the quartz content rises, and conversely, it increases with an increase in clay content.
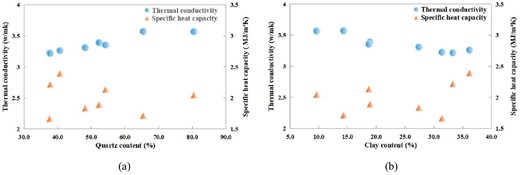
Experimental results of mineral content and thermophysical properties: (a) quartz and thermophysical properties and (b) clay and thermophysical properties.
3.2.3. Temperature
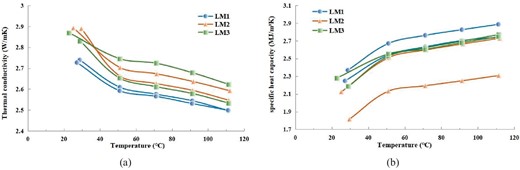
We also investigated the thermophysical properties of rock samples from the Longmaxi Formation shale reservoirs, focusing on directions parallel and perpendicular to the bedding. Considering typical temperatures of shale reservoirs, the maximum temperature in this experiment is set at 110°C (Jia et al. 2021). Three distinct groups of samples were subjected to testing, with the results illustrated in Figs. 8 and 9. The findings reveal that temperature considerably affects the thermophysical characteristics of the shale reservoirs. It was observed that an increase in temperature leads to a reduction in thermal conductivity and an accompanied increase in specific heat capacity. The tested temperature range spanned from 20 to 110°C, with the thermal conductivity experiencing a maximum decrease of 11% and the specific heat capacity experiencing a maximum increase of 28%.
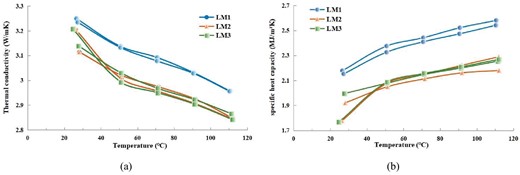
Variation of thermophysical properties with temperature in the direction perpendicular to bedding: (a) relation of thermal conductivity with temperature and (b) relation of specific heat capacity with temperature.
Variation of thermophysical properties with temperature in the direction parallel to bedding: (a) relation of thermal conductivity with temperature and (b) relation of specific heat capacity with temperature.
The thermophysical properties of the Longmaxi Formation shale reservoir were next compared for the directions parallel and perpendicular to the bedding. The variations in thermophysical properties are found to be similar for the two orientations, implying that the bedding orientation has a negligible impact on the thermophysical property changes as temperatures fluctuate. From the experimental data, we can see that beyond a temperature of 60°C, the thermal conductivity of the Longmaxi Formation shale reservoir diminishes at an approximate rate of −0.097 W/mK, concurrently, the specific heat capacity rises at an approximate rate of 0.22 MJ/m³K.
After hydraulic fracturing, the fracturing fluid, being at a reduced temperature, infiltrates the reservoir and circulates. This facilitates heat dissipation from the base of the wellbore and induces a cooling effect in the vicinity of the well. During this phase, the temperature around the well remains relatively low. The high thermal conductivity in this cooler region enables heat energy to be effectively transmitted from the more distant parts of the reservoir to the well's base. The formation's low specific heat capacity implies that a minimal amount of energy is required for a noticeable temperature increase, thus enabling swift rises in the bottom-hole temperature. However, as the temperature escalates, the thermal conductivity of the shale diminishes, which impedes energy transfer. Concurrently, the specific heat capacity of the shale rises, which means more energy is required to increase the temperature. Consequently, the recovery rate of the bottom-hole temperature decelerates, with the deceleration becoming more pronounced at elevated temperatures. Understanding the dynamics of post-fracturing temperature changes in shale reservoirs is pivotal for forecasting temperature distributions within the wellbore. Furthermore, such temperature data is crucial for measuring the petrophysical properties of the reservoir, evaluating micro-fracture development, analyzing gas behavior, and assessing rock thermal expansion and contraction throughout the well-simmering process (Jha et al. 2016; Zhang YJ et al. 2019; Ma et al. 2022; Zhang YJ et al. 2022).
3.2.4. Water content
The water content of the samples was assessed using the frequency of centrifugation, with an increased count suggesting a reduction in water content. The findings revealed no significant correlation between the thermophysical properties of shale and the frequency of centrifugation, as depicted in Fig. 10. It was also observed that the mass of the shale samples exhibited relative stability, with fluctuations not exceeding 0.01g, suggesting minimal variation in water content. The primary reason for this minimal change is likely the compacted nature of the shale reservoir, as it is characterized by low porosity and permeability, which impede the infiltration and distribution of water within the pore structure. As a result, during centrifugal drying, the trapped water is not efficiently expelled through the pores. This results in little change in the water content, as shown in the experiments. Because of the low porosity and permeability of the shale reservoir, the water content is not the main parameter affecting the thermophysical properties prior to hydraulic fracturing.
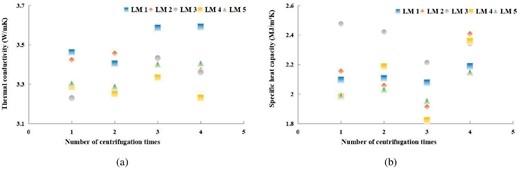
Thermophysical properties for different centrifugation times: (a) change of thermal conductivity and (b) change of specific heat capacity.
Further analysis of the experimental parameters revealed an interesting finding regarding the temperature. Even within the controlled environment of an incubator, the temperatures of the shale samples varied by ∼2°C. These changes can be attributed to the jostling of water within the samples during the centrifugation, resulting in heat generation through friction and subsequent temperature alteration. To ensure accurate measurements, it was necessary to determine the thermophysical properties of the samples immediately after centrifugation, since waiting for temperature recovery would lead to water volatilization. A temperature range of ∼25°C was identified as the temperature-sensitive section, as it was where the thermal conductivity was most sensitive to temperature changes. Consequently, this temperature range influenced the test results.
It is important to note that the Longmaxi Formation shale, since it is characterized by low porosity and permeability, is not susceptible to water to filling its pore space. Without reservoir stimulation techniques such as hydraulic fracturing, the variation in water content is not significant enough to affect the thermophysical properties of the original reservoir (Abdullah et al. 2024; Xiao et al. 2024).
3.2.5. Bedding
The highly-developed bedding architecture of shale can influence heat propagation. Therefore, the thermophysical properties and anisotropy parameters of three shale samples from the Longmaxi Formation were measured. For comparative analysis, three samples from the Lujiaping Formation were also tested. The findings are presented in Fig. 11.
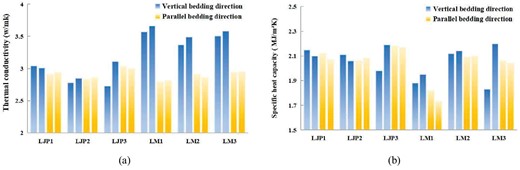
Thermophysical properties in different directions: (a) the thermal conductivity of shales and (b) the specific heat capacity of shales.
Observing the data, one can see distinct differences in thermophysical properties between the two orientations. Specifically, the thermal conductivity and specific heat capacity in the direction perpendicular to the bedding exceed those in the parallel direction. Notably, these disparities are more pronounced in the Longmaxi Formation. To elucidate the correlation between bedding architecture and heat propagation in shale reservoirs, an assessment of shale bedding development is essential (Zichun et al. 2022). Therefore, the anisotropy of both sets of shale samples was analyzed in Fig. 12.
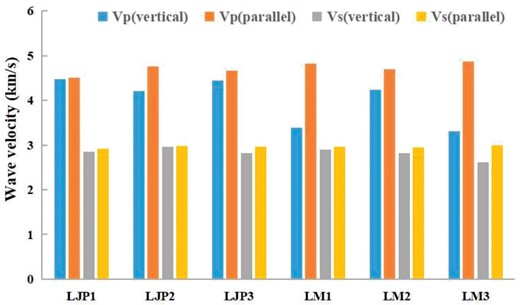
Shale ultrasonic wave velocity test results.
The anisotropy of the shales can be referenced using the Thomsen formula, as detailed in Table 3.
Calculations of shale anisotropy values.
| Samples no. | Anisotropy parameter ε | Anisotropy parameter γ |
|---|---|---|
| LJP1 | 0.0096 | 0.00 014 |
| LJP2 | 0.1424 | 0.00 009 |
| JLP3 | 0.0493 | 0.00 014 |
| LM1 | 0.5029 | 0.00 012 |
| LM2 | 0.1131 | 0.00 014 |
| LM3 | 0.5746 | 0.00 024 |
| Samples no. | Anisotropy parameter ε | Anisotropy parameter γ |
|---|---|---|
| LJP1 | 0.0096 | 0.00 014 |
| LJP2 | 0.1424 | 0.00 009 |
| JLP3 | 0.0493 | 0.00 014 |
| LM1 | 0.5029 | 0.00 012 |
| LM2 | 0.1131 | 0.00 014 |
| LM3 | 0.5746 | 0.00 024 |
Table 3 illustrates that the Longmaxi Formation shale exhibits stronger anisotropy than the Lujiaping Formation. This observation also accounts for the more pronounced differences in thermophysical properties observed in the Longmaxi Formation shale.
Transient methods are frequently employed for testing of thermophysical properties, where the correlation between temperature and output energy is measured over a brief interval. These methods enable the swift assessment of thermophysical characteristics within a defined depth, although they fail to reveal the properties under steady and enduring thermal conductivity conditions. In reservoirs exhibiting strong anisotropy, there is a greater chance of forming extensive bedding structures and associated fractures. When the thermophysical properties of shale are evaluated in the direction parallel to the bedding, the measurement probe is attached to a surface that is perpendicular to the bedding, a region replete with microcracks (Zhang et al. 2019; Shakirow et al. 2021). This orientation typically leads to measurements being lower than those obtained in the perpendicular direction. Consequently, the thermal conductivity and specific heat capacity in the parallel direction are lower compared to those in the perpendicular direction. Furthermore, the more developed the bedding structure, the greater the discrepancy in thermophysical parameters between the two orientations. The presence of developed bedding in shale also significantly impacts the heat transfer pathways and rates within the reservoir. Collectively, these findings underscore the importance of accounting for anisotropy and bedding architecture when studying shale's thermophysical properties, and when producing hydrocarbons from shale reservoirs.
4. Thermal conductivity model of shale
Accurate thermal conductivity models for shale reservoirs are essential for estimating the reservoir's overall thermal conductivity, and for computing the bottom-hole temperature distribution during well construction. Therefore, we develop a model based on our experimental results, which accounts for factors such as porosity, mineral composition, and bedding structure. Two primary mechanisms of heat propagation were identified within the studied reservoirs: parallel heat conduction and series heat conduction, as illustrated in Fig. 13. These mechanisms account for the directional flow of heat energy along the bedding plane and across it, respectively.
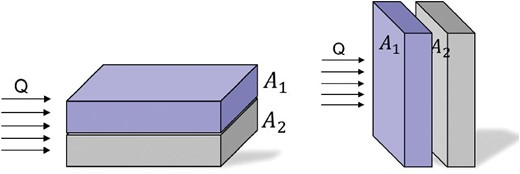
The two ways by which heat travels through rocks.
For parallel heat conduction, the presented equations express that the total heat transferred, denoted as Q0, is the cumulative result of the heat Q1 transmitted through a surface A1 and the heat Q2 transmitted through A2 (A is an area):
For heat conduction in series, the total heat passed Q0 is equal to the heat Q1 passing through surface A1, or the heat Q2 passing through surface A2. The temperature difference between the two sides of the model is the sum of the temperature difference between the two sides of A1, and the temperature difference between the two sides of A2, as expressed by Equation (7):
Here, λ is the thermal conductivity, △t is a change in unit time, △T is the temperature difference, and x is the thickness of the unit.
This investigation of the thermophysical properties of shale has revealed that a shale reservoir can be conceptualized as an assembly of numerous discrete particles, influenced by unique factors such as the mineral type, pore space, and fluid saturation. During heat transfer, each particle is simultaneously engaged in parallel and series conduction. Consequently, from a macroscopic viewpoint, the heat conduction process can be interpreted as the collective heat transfer activity of countless particles occurring simultaneously in parallel and series. This concept is contained within Equations (8) and (9):
The macroscopic thermophysical properties of shale are deduced through an iterative computation process that considers each particle's contribution. However, given the substantial impact of anisotropy, it is imperative to implement adjustments during the computation. Literature has underscored that the anisotropy of longitudinal wave velocity is tends to be high (Kern H et al. 2002). Consequently, we incorporate a positive correlation factor, denoted as ε, into the iterative process. This involves integrating a modified factor function C(ε,γ), which is designed to account for the influence of anisotropy:
In Equation (10), ks is the number of series heat conduction iterations, kp is the number of parallel heat conduction iterations, and ε and γ are anisotropy parameters.
5. Discussion
5.1. Analyzing the factors influencing shale thermophysical properties
The objective of this study was to elucidate the thermophysical properties of the shale gas reservoir within the Longmaxi Formation. This reservoir is characterized by a mineral composition of primarily quartz and clay. The thermal conductivity of the reservoir is predominantly influenced by quartz, which possesses a thermal conductivity of 7.69 W/mK. An increase in quartz content leads to an enhancement in the reservoir's thermal conductivity. Conversely, the thermal conductivity of water is significantly lower, at 0.59 W/mK, and its specific heat capacity is 4.2 MJ/m³K under standard temperature and pressure conditions. Therefore, when the reservoir's pores are saturated with water, there is an increase in its heat storage capacity, accompanied by a reduction in its thermal conductivity. This suggests that a greater amount of heat is necessary to elevate the temperature of the reservoir, despite its increased capacity for energy storage. However, we observed that the thermophysical properties of the Longmaxi Formation shale gas reservoir are minimally affected by factors such as porosity, permeability, and water content; this was attributed to the formation's inherently low porosity and permeability.
The influence of temperature and bedding on the thermophysical properties of shale were also examined. As temperature rose, the thermal conductivity of the reservoir was observed to decrease, which in turn diminished the heat transmission capacity and augmented the heat storage capacity. This meant a greater energy input was needed to elevate the reservoir's temperature. Furthermore, at a critical temperature of 60°C, a significant alteration in the thermal conductivity rate was noted. Heat conduction was more efficient in the direction perpendicular to the bedding, whereas the presence of cracks and beds in the parallel direction impede the heat transfer pathways. This leads to an uneven distribution of heat across the reservoir, thereby prolonging the time and increasing the energy expenditure required to achieve effective heating.
Overall, understanding the impact of temperature and bedding on the thermophysical properties of the Longmaxi Formation shale (or any other shale reservoir) is essential for optimizing energy utilization and resource extraction.
5.2. Predicting shale thermal conductivity
The composition of rock reservoirs, including mineral particles, pores, organic matter, adsorbed gas, and fluids, forms a unique and intricate matrix. The genesis of these reservoirs is marked by distinct structural formations. Sedimentary rock deposition is characterized by the development of bedding architecture, while metamorphic rocks display heterogeneity as a result of alterations in chemical composition or pore structure during metamorphism. Additionally, magmatic rocks develop porosity, rhyolitic structures, and metamorphic mineral crystalline structures as they cool. The presence of minerals, pores, and filling materials, along with specific structural attributes, therefore strongly impact the transfer and storage of heat in reservoirs.
A physical model was proposed in this study, designed to simulate heat transfer in shales through an iterative approach, and facilitate the analysis of macroscopic thermophysical properties. Shale samples from various locations were analyzed in a data-driven manner. The outcomes are shown in Fig. 14.
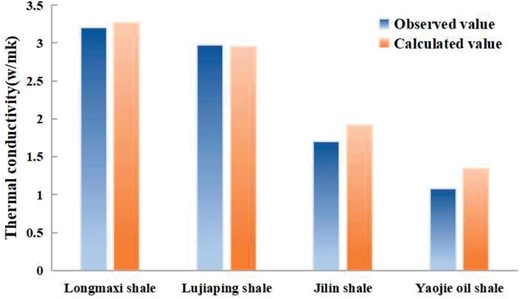
Iterative calculation results of shale in different regions.
We also introduced a physical model that accounts for the heterogeneity of shale, although it does not account for factors such as internal bedding cracks. Consequently, the calculated results may slightly overshoot the true values. This discrepancy was observed to be more pronounced in reservoirs with well-developed bedding cracks, for instance the Jilin shale and Yaojie oil shale, which are known for their shallow burial depths. By contrast, this source of error is less significant for formations like the Longmaxi and Lujiaping shales.
5.3. Prediction of bottom-hole temperature in the shale reservoir
Shale gas is a prolific resource, with hydraulic fracturing being an important technique for enhancing the productivity of shale gas reservoirs. Our investigation delved into the dynamics of temperature fluctuations within shale reservoirs following hydraulic fracturing, aiming to identify and evaluate effective strategies for reservoir management.
The pore structure of the reservoir is effectively modified through hydraulic fracturing, facilitating the penetration of the fracturing fluid for heat exchange. The introduction of colder fracturing fluid near the wellbore is known to lower the reservoir temperature, thereby enhancing thermal conductivity and reducing specific heat capacity. As a result, heat conduction becomes more efficient, allowing for a rapid transfer of heat from peripheral regions to the area near the wellbore, and leading to a rapid increase in the reservoir temperature.
On reaching a static state, the reservoir increases in water content, which displaces gas within the pores. This displacement enhances the overall thermal conductivity and heat storage capacity. During dynamic conditions such as flowback, the high specific heat capacity of water enables it to transport significant heat energy toward the wellbore. A reduced flowback rate is conducive to heat transfer from the water to the area surrounding the well, resulting in an increase in bottom-hole temperature. Conversely, an accelerated flowback rate limits heat transfer, causing a direct loss of energy with the water discharge (Fig. 15).
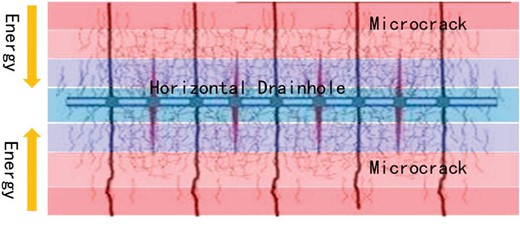
Temperature field distribution after hydraulic fracturing.
An alternative method for shale oil and gas extraction, called thermal production, involves using elevated temperatures to facilitate methane desorption. However, the heating process within shale reservoirs can lead to a rise in temperature, a reduction in thermal conductivity, and an augmentation of specific heat capacity, and these changes can reduce the efficiency of heat conduction. As a result, a substantial amount of heat tends to accumulate near the bottom of the well, which can lead to heightened energy usage during the development phase. To enhance the efficacy of thermal production, it is imperative to prime the reservoir through heating. This involves the application of a heating medium which can uniformly and efficiently heat the reservoir, thereby addressing the aforementioned challenges.
6. Conclusion
We conducted an experimental investigation of the thermophysical characteristics of samples from the lower strata of the Longmaxi Formation shale reservoir. Experiments were designed to evaluate the variables that influence the thermal properties of shale. Using the data collected, a thermal conductivity model uniquely calibrated for shale was formulated to forecast the thermal conductivity within shale reservoirs.
The experimental findings indicate that the thermal conductivity of shales within the Longmaxi Formation range from 3.2 to 3.6 W/mK, and the specific heat capacities vary from 1.6 to 2.4 MJ/m³K. It was revealed that the shale's thermophysical properties are predominantly influenced by the mineral composition, temperature, and bedding. On the other hand, factors such as porosity, permeability, and water content exhibited minimal impact, which was attributed to the high degree of compaction.
The principal mineral constituents of the shale were identified as quartz and clay, with quartz content being positively correlated to the thermal conductivity. It was also observed that temperature significantly affects the thermophysical properties of shale, with an increase in temperature leading to a decrease in thermal conductivity and an increase in specific heat capacity. Notably, variations in temperature below 60°C induce substantial changes in these properties, whereas above this threshold, changes are more limited and linear.
A thermal conductivity model for shale was formulated, incorporating a modified factor function C(ε,γ) to account for bedding heterogeneity. This model utilizes iterative calculations to predict shale thermal conductivity. The model accuracy varies with the degree of fracturing in the shale, showing minor discrepancies for tight shale reservoirs and larger inaccuracies for reservoirs with extensive fracturing.
Acknowledgements
I would like to thank Professor Dr. Tingting Miao, China University of Petroleum (Beijing), for her instrument support.
Conflict of interest statement
None declared.
Data availability
The data are available from the corresponding author on reasonable request.
