


Abstract
Some rock samples (39) have been obtained from Wadi Saal, East Central Sinai, Egypt, for studying electrical, petrographical, and petrophysical parameters. The petrographical analysis shows two major facies. Carbonate (limestone) facies with low porosity (11%) and permeability (69 mD), and sandstone facies with high porosity (28%) and permeability (5901 mD) indicate good reservoir characteristics. Porosity values are related to the bulk density, whereas permeability is controlled by rock porosity and irreducible water saturation. Alternating current (AC) electrical properties were measured with frequency (42 Hz–5 MHz) for samples. Electrical characteristic differences are affected with texture changes, mineralogy, porosity, tortuosity, pore-water salinity, mineral concentrations, permeability, and fluid content. Conductivity and impedance decrease whenever an insulator is existed. The dielectric constant increases with conductor composition (below the percolation) and falls with frequency beyond it. The conductivity expands with the number of conductor pathways connecting the electrodes. The primary objective of this work is to use laboratory AC electrical measurements to shed some light on the relationship between the texture, petrography, petrophysics, and geochemical composition of materials (sandstone and limestone). The goal is to study electrical properties of these mixtures at varying clay concentrations and saturation levels. These analyses could enhance oil and gas recovery by shedding light on reservoir rock electrical characteristics.
1. Introduction and previous work
Wadi Saal can be found in Egypt's East Central Sinai, specifically within Araba Formation. Samples were analyzed for reservoir characterization utilizing integrated petrographical and petrophysical methods. Past petrographic research focused on allogenic and authigenic clays found in the Lower Paleozoic Naqus Formation (thickness 200–300 m) sandstones in central Sinai, Egypt. In relation to Wadi Saal's petrography, numerous local formations' stratigraphy, sedimentology, and petrophysics have been studied (Said and El-Kelany 1989, Hassan et al. 1994).
The electrical properties of Wadi Saal in East Central Sinai, Egypt, are mysterious. Several studies presented hydrogeological and geophysical investigations in the area (Azzam 1994). Wadi Saal has a thickness of nearly 130 m (Issawi & Jux 1982). Wadi Saal's geological history is defined by its complicated succession of metamorphosed volcano sedimentary rocks, Paleozoic rock strata, and marine limestone aquifers (El Sayed et al. 2008). Wadi Saal's geology has changed due to tectonic activity, erosion, and sedimentation (Fig. 1). These modifications created a complex succession of metamorphosed volcano sedimentary rocks, Paleozoic rock units, and current marine limestone aquifers (El Sayed et al. 2008).
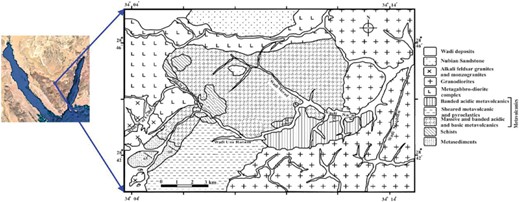
Geological map of the Wadi Sa'al area, central south Sinai, Egypt.
Insulators such as silica sand typically have low electrical conductivity and block electric charges from reaching the end electrodes, although some carbonates may conduct electricity under specific conditions (Revil & Florsch 2010). Insulators cannot carry electricity because electrons are bound to their nuclei by strong bonds. However, semiconductors such as clay and shale have free electrons, allowing electrical charge flow. The weak binding interactions between electrons and their atoms in conductive materials promote electron mobility (Waxman & Smith 1968). Overcharging restricts an insulating material's movement, prolonging immobility. In insulators, electrons are strongly bonded to their atoms, limiting their mobility and capacity to neutralize charge. However, the repulsive forces between newly added and existing charges would quickly disperse an excessive charge on a conductor (Jougnot et al. 2010). Electrons in conductors are freely mobile, thus they distribute uniformly to reduce attraction forces. Titov et al. (2004); Jougnot et al. (2010); and Revil & Florsch (2010) found that the two ingredients' relative concentrations affect the combinations of the electrical properties.
Clay's complex composition and various properties make it a rich source of unconventional hydrocarbons for the oil and gas industry, but classification is challenging. Electrical measurements describe clay and water-bearing formations well. Conductor (clay) and wetness affect electrical features of clay–sand combinations (Waxman & Smith 1968; Revil et al. 2013).
Clay is an important source of unconventional hydrocarbons in oil and gas. Clay is tough to define due to its complicated composition and wide range of uses. Rufet et al. (1991a, b) use electrical measurements to characterize clay and water-bearing strata. The electrical properties of sand-clay mixtures are affected by saturation levels and conductor material (clay), which is of great interest (Osterman et al. 2019).
Our main goal is to study the electrical properties of clay–sand mixtures at varying clay concentrations and saturation levels. These analyses could enhance oil and gas recovery by shedding light on the reservoir rock's electrical characteristics.
2. Methodology and sample preparation
Plugs were removed from specimens without visible fractures, and new rock samples were taken from exposed formations for petrophysical analysis. One-inch-diameter plugs were used to reshape the specimens into cylindrical forms (Gomaa et al. 2015a, b). The samples were made using the successive steps listed in the following:
Cold solvent extraction Soxhlets was used to clean the selected samples. Any leftover hydrocarbons were eliminated with toluene, and any leftover water and salts were eliminated with methanol (Schowalter 1979).
To reduce clay deformation and modification, the plugs were cleaned and then placed in an electric oven that was kept at a constant temperature of <60°C and a 47% relative humidity for a full day. The weights of the plugs stabilized after the drying procedure. The plugs were taken out of the oven and put into a partially filled desiccator with silica gel, which was then left to cool. Before doing petrophysical testing, we attempt to ensure that the samples are pure and dry (El Sayed et al. 2008).
Porosity was determined from the weights and densities of the sample grains and the volumes of cells in the experiment
where |$\phi $| is porosity, |${{V}_t}$| is the total volume of the cell, m is the average mass of the dry sample before and after the experiment, and |$\rho $| is the density of the sample grains. Grain density was found to be equal to 2.71 g/cm3.
The permeability k is determined in a steady state flow experiment that determines the flow rate q as a function of the pressure difference between inlet pressure |${{p}_1}$| and outlet pressure |${{p}_2}$|:
with |$\mu $| being the viscosity of gas, A being the cross-sectional area, and L being the length of the cylindrical sample (Hassan et al. 1994).
2.1. Experimental measuring procedures
The microscopic examination of the materials under study forms the main foundation of the current petrographic investigation. The mineralogical makeup, diagenetic characteristics, and depositional contexts of 60 thin sections and 20 ditch and core samples are determined using scanning electron micrography (JEOL JSM-5300 SEM). During the thin section preparation process, blue epoxy is vacuum impregnated to make it easier to identify different types of porosity and specific minerals in the cement and rock matrix (Dickson and Giblin 2009). The porosity was determined using helium porosimeter. Materials that were being examined were drilled into cylinders that had a maximum length of 3.00 cm and a diameter of ∼2.54 cm (petrophysics); (Aguilera 1976; Lucia 1983). After cleaning, the cylinder samples were dried for 10 hours at 85°C. We verified that this period is sufficient for our samples (they do not lose any weight with time). Data on rock porosity have been obtained using the DEB-200 instrument, which measures bulk volume using Archimedes law, and grain volume estimation using matrix-cup helium porosimeters (Heise Gauge type). A core laboratory permeameter was used to determine the permeability (k); (Amaefule et al. 1993; Archie 1952). The details of the equations used are contained in Timur (1968); Tiab & Donaldson (1996).
The geochemical distribution of major and trace elements provides direct information on the depositional environment. Major and trace element data are shown in Table 1. After being treated with 10% HCl, the acid insoluble residue was measured, and the element Na was found using flame photometry (Aguilera 1976; Lucia 1983).
Description and composition of the studied samples.
| Sample no. | Dry wt. | Bulk volume | Porosity (%) hel. | Permeabilty (mD) | Silt & clay (%) | Sand (%) | Carbonate (limestone) (%) | Magnetic susceptibility (SI) | Sample description |
|---|---|---|---|---|---|---|---|---|---|
| M1 | 9.84 | 3.76 | 3.28 | 0.7 | 7.1 | 0 | 92.2 | 83.2 | sandy limestone: pale white, containing veins of gypsum very fine grained and hard |
| M2 | 7.96 | 3.02 | 0.64 | 1.02 | 10.1 | 0.1 | 88.8 | 74.2 | sandy limestone: gray, very fine grained and hard |
| M3 | 10.28 | 3.92 | 4.5 | 1.107 | 2.4 | 0.7 | 95.9 | 66.3 | clayey limestone: gray and brown in parts, very fine grained and semi-hard |
| M4 | 9.38 | 3.65 | 4.99 | 1.231 | 8.1 | 10.1 | 80.8 | 44.3 | clayey limestone: clear yellow, very fine grained and hard |
| M5 | 11.36 | 4.25 | 0.02 | 1.982 | 21.5 | 0.1 | 76.4 | 34.6 | clayey limestone: dark brown to grayish, very fine grained and hard |
| M6 | 9.85 | 3.74 | 2 | 2.157 | 3.8 | 0.1 | 94.1 | 28.6 | sandy limestone: light gray, containing parts of marble, very fine grained and hard |
| M7 | 10.01 | 3.91 | 5.08 | 0.09 | 3.1 | 1.9 | 95 | 33.0 | clayey sandy limestone: light green, very fine grained and hard |
| M8 | 8.5 | 3.62 | 13.03 | 0.093 | 3.9 | 0 | 96.1 | 30.5 | clayey limestone: gray and violet in parts very fine grained and hard |
| M9 | 10.25 | 4.01 | 3.88 | 0.163 | 24.8 | 0.1 | 75.1 | 64.2 | sandy limestone: white with brown points very fine grained and hard |
| M10 | 8.66 | 3.48 | 6.7 | 0.315 | 5.7 | 1 | 92.9 | 62.9 | sandy limestone: yellow containing observed fossils, very fine grained and hard |
| M11 | 8.52 | 3.25 | 1.2 | 0.321 | 25.2 | 0.1 | 74.7 | 90.0 | sandy limestone: light gray, very fine grained and hard |
| M12 | 11.39 | 4.41 | 2.37 | 2.315 | 10.2 | 0.3 | 87.5 | 56.9 | clayey limestone: dark gray, very fine grained and semi-hard |
| M13 | 9.48 | 3.76 | 11.42 | 2.527 | 7 | 1.7 | 89.3 | 87.9 | sandy limestone: white, containing fossils, very fine grained and hard |
| M14 | 11.37 | 4.44 | 2.61 | 2.976 | 31.2 | 15 | 51.1 | 107.5 | clayey limestone: gray containing white veins, very fine grained and semi-hard |
| M15 | 10.54 | 4.02 | 1.51 | 2.9 | 30.9 | 14 | 52 | 36.5 | clayey limestone: gray and black in parts, very fine grained and hard |
| M16 | 7.76 | 2.97 | 1.68 | 3.013 | 5.9 | 8.6 | 82.5 | 21.8 | clayey limestone: brownish gray, very fine grained and hard |
| M17 | 11.13 | 4.19 | 18.34 | 3.197 | 10.7 | 0.8 | 85.5 | 17.1 | ferruginous sandy clayey limestone: red, fine to medium grained and hard |
| M18 | 11.5 | 4.15 | 14.34 | 3.972 | 5 | 0.5 | 90.5 | 14.0 | ferruginous sandy clayey limestone: red, fine to medium grained and hard |
| M19 | 11.09 | 4.25 | 1.89 | 4.125 | 31.3 | 14.1 | 50.6 | 27.9 | ferruginous sandy limestone: varicolored (gray, yellow and brown), fine grained and hard |
| M20 | 8.23 | 3.2 | 5.21 | 0.027 | 3.9 | 0 | 96.1 | 55.2 | ferruginous clayey limestone: brownish white), very fine grained and hard |
| M21 | 9.26 | 3.66 | 5.37 | 0.031 | 2.4 | 0.1 | 97.5 | 42.4 | sandy limestone: white with brown points and large marble points |
| M22 | 7.92 | 3.11 | 25.57 | 0.032 | 4.3 | 0 | 95.7 | 15.7 | ferruginous sandy clayey limestone: light brown, fine to medium grained and hard |
| M23 | 9.77 | 3.74 | 2.9 | 0.036 | 7.8 | 0.7 | 91.5 | 17.9 | sandy limestone: varicolored (yellow and whitish gray) very fine grained and hard |
| M24 | 10.28 | 3.87 | 2.36 | 0.038 | 0 | 0 | 100 | 82.2 | sandy limestone: light gray, containing parts of marble, very fine grained and hard |
| M25 | 10.47 | 3.97 | 0.98 | 0.042 | 2.6 | 0 | 97.4 | 36.1 | sandy limestone: grayish white in parts very fine grained and hard |
| M26 | 10.99 | 4.12 | 0.17 | 0.043 | 5.6 | 0.3 | 94.1 | 120.0 | clayey l. st., brownish yellow, containing black veins with white points very fine grained and hard |
| M27 | 9.46 | 3.67 | 4.13 | 0.051 | 4.1 | 0.2 | 95.7 | 35.3 | sandy limestone: gray, containing veins of gypsum, very fine grained and hard |
| M28 | 9.61 | 3.56 | 0.58 | 0.057 | 3.7 | 1.2 | 95.1 | 15.3 | sandy limestone: gray with yellow veins, very fine grained and semi-hard |
| M29 | 9.45 | 3.56 | 1.22 | 0.059 | 5.8 | 0.6 | 93.6 | 13.9 | sandy limestone: varicolored (gray and brownish white) very fine grained and hard |
| M30 | 6.57 | 2.97 | 15.13 | 4.125 | 33.8 | 12.1 | 49.9 | 21.0 | sandy limestone: gray, very fine grained and hard |
| M31 | 11.06 | 4.16 | 1.24 | 0.067 | 10.5 | 66 | 23.5 | 13.7 | sandy limestone: gray with yellow veins, white in some parts very fine grained and hard |
| M32 | 9.06 | 3.45 | 2.01 | 0.069 | 8.1 | 60.7 | 31.2 | 74.7 | sandy limestone: dark yellow, containing black points, very fine grained and hard |
| M33 | 8.43 | 3.22 | 24.33 | 0.097 | 6.6 | 55.1 | 38.3 | 25.9 | ferruginous sandy clayey limestone: light brown, fine to medium grained and hard |
| M34 | 9.1 | 3.53 | 4.63 | 0.94 | 5.3 | 76.6 | 17.1 | 20.4 | ferruginous clayey calcareous sandstone: light brown, very fine grained and hard |
| M35 | 9.11 | 3.54 | 3.34 | 1.22 | 4.5 | 90.6 | 3.9 | 30.7 | fer. clay. calc. s. st.: brownish white, fine to medium grained and hard |
| M36 | 9.52 | 3.68 | 1.07 | 0.014 | 1.5 | 0.4 | 98.1 | 126.3 | ferruginous clayey calcareous sandstone: pale red, fine grained and hard |
| M37 | 8.11 | 3.16 | 3.47 | 0.7 | 7.1 | 0 | 92.2 | 44.7 | fer. calc. s. st.: varicolored (dark brown and pale yellow), fine grained and hard |
| M38 | 8.09 | 3.14 | 1.61 | 1.02 | 10.1 | 0.1 | 88.8 | 100.6 | ferruginous sandstone: brown, fine grained and hard |
| M39 | 9.37 | 3.52 | 1.19 | 1.107 | 2.4 | 0.7 | 95.9 | 51.7 | sandy limestone: white, containing parts of marble very fine grained and hard |
The plugs were placed between the electrodes one after the other, and their electrical resistance was then measured using a Hioki 3522–50 LCR Analyzer (as will be discussed later). After converting the resistance measurements to specific resistivity, the formation factor was calculated by dividing by the brine's resistivity (Gomaa & Alikaj 2010).
An impedance analyzer was used in conjunction with non-polarizing electrodes. The voltage setting was 1 V. Series and parallel capacitance were measured, as well as series and parallel resistance, at various frequencies. The complex relative dielectric constant can be written as |${{\varepsilon }^*} = \varepsilon ^{\prime} - i\varepsilon ^{\prime\prime}$|, where the real part of the complex relative dielectric constant |$\varepsilon ^{\prime} = {{{{C}_p}d} / {{{\varepsilon }_0}A}}$| and the imaginary part |$\varepsilon ^{\prime\prime} = {{{{G}_p}d} / {w{{\varepsilon }_0}A}}$| are related to the measured parameters, where A is the cross-sectional area of the sample, d is its thickness, |${{\varepsilon }_0}$| is the permittivity of free space (|$8.85 \times {{10}^{ - 12}}$| F/m), and w is the angular frequency, |${{G}_p}$| is the parallel conductance, and |${{C}_p}$| is the parallel capacitance (Gomaa & Alikaj 2010).
The electrical properties of a material can be measured in either series or parallel mode. In the series mode, the complex impedance Z is measured, |$Z = {{R}_S} - i{{X}_s}$|, where |${{R}_S}$| is the series resistance (real impedance) and |${{X}_S} = {1 / {w{{C}_s}}}$| is the reactance, and |${{C}_s}$| is the series capacitance. The parameters were calculated from the following equations, |$\rho = {{R}_p} \times ( {{A / d}} )$|, |$\sigma = {1 / \rho }$|, |${\mathop{\rm{Re}}\nolimits} \,Z = {{R}_s}$|, |${\mathop{\rm{Im}}\nolimits} \,Z = {1 / {w{{C}_s}}}$|, |$\varepsilon ^{\prime} = {{{{C}_p}} / {{{C}_0}}}$|, and |${{C}_0} = {{( {{A / d}} )} / d )} / {{{\varepsilon }_0}}$|, where w is angular frequency, |${{R}_p}$| is the parallel resistance, and |${{C}_p}$| is the parallel capacitance. In the following paragraphs, we go over the specifics of the electrodes used in the measurement.
To minimize mistakes caused by stray capacitance, thin disks with a diameter-to-thickness ratio of >5 were used for the electrical tests (Gomaa & Alikaj 2010). Parallel polishing was applied to the sample faces. Samples were identified between 42 Hz and 5 MHz using (Cu/CuSO4) electrodes (Gomaa 2009; Gomaa et al. 2009). The accuracy (error) of the electrical measurements is |$\pm 5\% $|.
A material's electrical characteristics can be expressed using either a parallel or series configuration. The factors that were measured as well as other specifics of the equations that were utilized may be found in Gomaa & Elsayed (2009) and Vinegar & Waxman (1984). Following are the formulas that were used in Chew & Kong (1980) to compute the conductivity as well as the dielectric constant. The measurements were carried out in an enclosed space (a desiccator) [temperature (31°C); relative humidity (47%)]. Within the frequency range that was investigated, it was discovered that the electrode impedance was <15 ohms (Warburg 1899, 1901).
Following processing, the gathered samples were divided into 2.5 × 3 cm cylinders for petrophysical property testing. After evaluation, the samples were dried in an electric oven for 10 hours at a temperature never exceeding 95°C to avoid heating-induced clay deformation and modification. Subsequently, porosity, density, permeability, and capillary pressure petrophysical analyses were carried out.
3. Results and discussion
3.1. Petrography
Petrography seeks to characterize the lithofacies with particular emphasis to rock textures, detrital mineralogical composition, and the cementing components. Sandstones with extremely fine to fine grain sizes are defined as having <10% medium-sized grains. The principal constituent is quartz, which is primarily monocrystalline and exhibits straight extinction (McCreech et al. 1991). In terms of amount, varieties of plagioclase feldspar and potash are listed after quartz. In Fig. 2, the feldspars are either intact or broken. Clay has effectively held the sand grains together (Fig. 2).
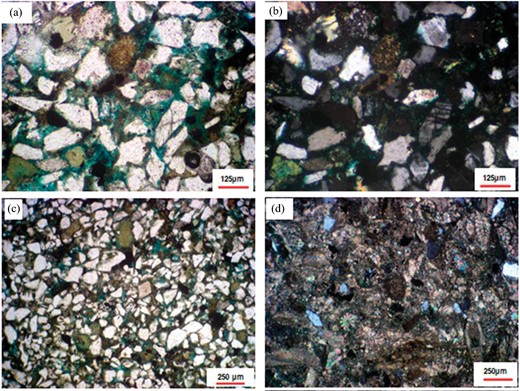
(a) Fractured quartz grains, (b) altered and cracked K-feldspars, (c) sandstone showing glauconite and partial cementation, and (d) sandy wackestone with foraminiferal and echinoids tests.
From a petrographic perspective, primary intergranular porosity accounts for most of the porosity, whereas feldspar leaching and pore-filling detrital clay contribute secondary porosity (Gomaa et al. 2015b, 2018). The initial mineralogy and the alternation process define secondary porosity. The sandstone facies that is being studied is categorized as follows:
Armatiz quartz
Armatiz quartz is composed of monocrystalline quartz grains and iron oxides (makes low porosity and permeability). Examples of these oxides include cement, certain pyrite, and certain detrital clays. In terms of texture and mineralogy, this facies is regarded as mature.
Arenite calcareous quartz
Arenite calcareous quartz has carbonates and iron oxides (makes low porosity and permeability) to some extent. It has been demonstrated that the carbonate (limestone) cement fills the spaces left by the quartz grains by acting as a postdepositional cement (Abu Anbar et al. 2009).
Arenite quartz sublithic
Arenite quartz sublithic facies has developed some pyrite, detrital clays, iron oxides, and lithics. It has also developed minerals (El Sayed et al. 2008).
A vertebrate quartz
Pyrite, iron oxides, some detrital clays, and mature texture and minerals are features of this facies. The cement where iron oxide builds up around the quartz grains is known postdepositional iron oxide cement. Figure 3a–f shows photomicrographs of the quartz arenite microfacies and the calcareous quartz arenite microfacies. Figure 4 parts a and b are SEM photomicrographs showing some quartz overgrowth reduced the porosity. Figure 4c is a SEM photomicrograph showing that kaolinite partly is filling the intergranular pores between quartz grains (Amaefule et al. 1993).
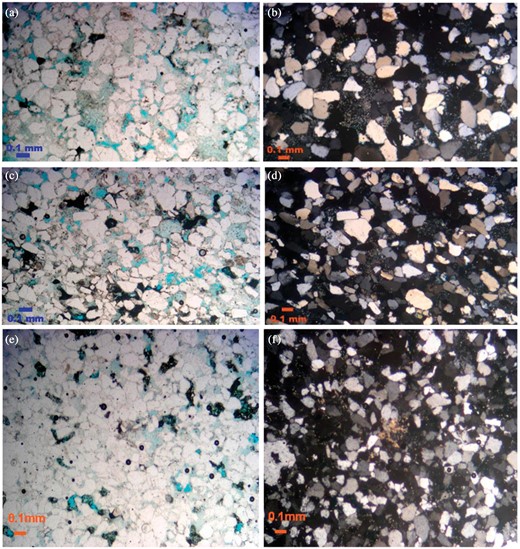
Photomicrographs showing the quartz arenite microfacies (a–d); and (e, f) showing the calcareous quartz arenite microfacies.
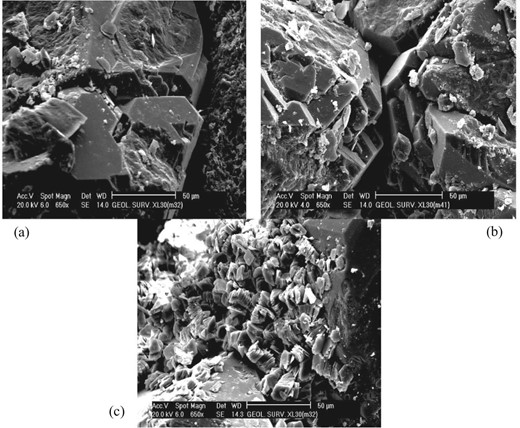
(a, b) SEM photomicrographs showing some quartz overgrowth reduced the porosity. (c) SEM photomicrograph showing kaolinite partly is filling the intergranular pores between quartz grains.
Petrographically, the studied sandstone samples show mostly primary intergranular porosity, with secondary porosity coming from pore-filling detrital clays and feldspar leaching. The carbonate (limestone) samples under investigation, however, have less apparent porosity (Neasham 1977).
3.2. Petrophysical parameters
The distribution of the grain density readings for the rock samples, from Wadi Saal, indicates that most of them fall between 2.63 and 2.64 g/cm3. Wadi Saal rock samples have an intermediate porosity. Most samples have porosity values between 2.4 and 3.6 mD, according to the range of values (El Sayed & Kiss 1997). The geological map of the Wadi Sa'al region in central south Sinai, Egypt, is displayed in Fig. 1.
Important reservoir properties that are challenging to estimate in the field or in the laboratory using traditional reservoir data, including permeability (k, mD) and reservoir quality index (RQI), can be robustly and precisely estimated using the established petrophysical models.
At Wadi Saal, the magnetic susceptibility values (13.7–126.3 SI) exhibit relatively little fluctuation (Table 1). This range reflects variations in the mineralogical composition and physical properties of the rock facies present in Wadi Saal. The relationship between dry bulk density and magnetic susceptibility is often influenced by the mineralogical composition of the samples. For instance, sediments with high iron-bearing minerals exhibit high magnetic susceptibility. Understanding this correlation is crucial for reservoir characterization, as it helps in interpreting geological formations and assessing their potential for fluid storage and flow (Elsayed et al. 2008).
Numerous diagenetic events are revealed by the petrographic examination of Nubia Sandstone that was analyzed. These include pressure solution cementation, compaction, carbonate and clay cementation, and iron oxide cementation. The permeability and porosity of these facies are somewhat reduced due to the presence of iron oxides, some pyrite, and some detrital clays as cements. Sandstone core samples revealed that the pore spaces inside them are intergranular in character (El Sayed & Kiss 1997).
The rise in permeability with increased porosity could potentially be attributed to the homogenous pore space shape. Some samples represent ferruginous quartz arenite microfacies with low mean hydraulic radius, other samples represent sublithic and calcareous quartz arenite microfacies with an intermediate mean hydraulic radius (Neasham 1977).
For all samples, porosity reduces as bulk density increases. Porosity prediction may benefit from the strong correlations observed between the computed porosity bulk density and its high correlation coefficient. The sandstone rocks association is regarded to have a considerable amount of storage capacity.
The petrographic analysis performed on the Nubia Sandstone reveals several diagnostic occurrences. Iron oxide cementation, compaction, carbonate and clay cementation, and pressure solution cementation are a few of these. Because of the iron oxides, some pyrites, and some detrital clays acting as cements, these facies have somewhat lower permeability and porosity (El sayed et al. 2008). The pore spaces inside the sandstone facies core samples under investigation have an intergranular nature, according to a microfacies analysis (Fig. 2).
Permeability causes the mean hydraulic radius values to increase. High mean hydraulic radius is a characteristic of quartz arenite microfacies. Permeability increases with increasing porosity due to increase of pore space spacing. Some samples represent sublithic and calcareous quartz arenite microfacies with an intermediate mean hydraulic radius. Other samples represent ferruginous quartz arenite microfacies with low mean hydraulic radius. The rocks in the sandstone facies association are regarded as having a considerable amount of storage capacity. The sandstone facies association is the predominant reservoir zone, according to research on flow zone indicators and the RQI.
The samples under consideration have an average grain density of 2.63 gm/cc (El Sayed et al. 2008, Gomaa et al. 2015a, b). The average packing index for the samples under investigation is 1.30. The average measured rock porosity value for the samples under investigation is 23.2%. The average air permeability is 1058 mD. For the sandstone facies association, the average porosity ratio is 0.3. According to the sandstone facies association, the RQI has a mean value of 1.69.
The relationship between porosity and bulk density illustrates the same mineralogical composition, grain form, packing, and fabric of the rock samples, leading to the expectation of a consistent and homogenous pore framework.
Porosity may not be the primary factor influencing permeability values, as indicated by the weak link between permeability and porosity values of rocks. Furthermore, a low connection between porosity and permeability may be implied by the occurrence of minute fillings and/or variations at pores.
3.3. Resistivity at low concentration of brine solution
The conductivity of the rock sample is represented by αo, while the conductivity of the filled pore electrolyte is denoted by αw. In a rock sample, the fully saturated resistivity (ρo) equals 1/αo, while conductivity of the filled pore electrolyte (ρw) equals 1/αw. The results demonstrate a significant variation in the samples' saturated resistivity values (Wadi Saal at Sinai). Most samples in the Wadi Saal rock samples fall between 1.6 and 2 Ohm m. This is due to the presence of some salts at these samples.
As porosity increases, the formation resistivity factor falls. The samples might be partly cemented based on the value of m (∼1.65). The degree of cementation, the system's shape, packing, sorting, type of pore system (intergranular, intercrystalline, or tortuosity), presence of conductive solids, compaction from overburden pressure, and thermal expansion are a few factors that have been argued to the variation in cementation factor (Ruffet et al. 1991a, b). There is little variation in the tortuosity ratings of the rock samples found in Wadi Saal area. The brine solution concentration (gm/l, NaCl) value of m suggests that the degree of cementation in this sample group may be modest.
3.4. Reservoir parameters
Numerous geological processes affect a rock's permeability, but high porosity is a reliable indicator of fair to high permeability. To allow for fluid flow, the pores and pore throats must be connected and of a sufficient size. The pore-throat structure was only partially revealed by the permeability test, but accessible pore spaces could be identified thanks to the porosity measurement.
Porosity and permeability play a major role in determining a reservoir's quality (Sen 1981; El Sayed 1995; El Sayed & Kiss 1997). The two lithology facies of samples under investigation can be divided to carbonate (limestone) and sandstone. In contrast to the studied sandstone samples, which have high porosity and permeability values and robust reservoir qualities, the carbonate (limestone) samples exhibited low porosity and permeability values.
Cantrell & Hagerty (1999) find that micropores enhance the attraction of capillaries to the wetness stage (water). The micropores frequently fill to capacity with bound water as a result of this. Random heterogenetic pore structure is the primary driver of high residual wetting-phase saturation levels in porous media (Melas & Friedman 1992). As permeability increases, the residual level of water falls, as shown by the negative trend for carbonate samples.
The permeability and porosity relations of the cap rocks and reservoir are mostly determined by the size of the pore throat. The displacement pressure needed for hydrocarbon migration depends on the size of a rock's pore throats (Schowalter 1979; McCreech et al. 1991). As permeability increases, the amount of displacement pressure required for hydrocarbon movement decreases; that is, the larger the pore throats, the lower the displaced pressure required.
Petrophysical analysis shows that the sandstone facies has high values of porosity (∼29%) and permeability (∼5902, mD), reflecting good to very good reservoir characteristics, while the carbonate (limestone) facies has low porosity (∼10%) and permeability (∼68 mD), indicating poor to fair reservoir characteristics (El Sayed et al. 2008).
3.5. Electrical properties
Using AC electrical laboratory measurements, petrographic, electrical, and geochemical investigations were conducted in the current study to provide additional insight into the relationship between the texture of the measured materials and their geochemical composition (Gomaa et al. 2023, Gomaa 2023a, b).
The primary causes of variations in the samples' electrical characteristics (impedance, dielectric constant, and conductivity) were their varying particle concentrations and insulating or conductive consistency. An electrical property can be obtained by combining multiple parameters. The more conductor pathways there are, the more conductivity there is. Many governing elements (grain size, composition, form, etc.) control electrical characteristics. The conductivity and dielectric constant rise with conductor composition, saturation, and clay content, and fall with frequency (Ruffet et al. 1991a, b).
One potential method for describing the rock texture of sample components uses AC electrical properties and conductor–insulator combinations. The mixture exhibits high dielectric constant at lower frequencies (Efros & Shklovskii 1976).
The sample's dielectric constant is increased by the conductive percentage due to the appearance of clustering inclusions, which are caused by a decrease in the thickness of the insulating gaps between conductive clusters (Chew & Kong 1980; Chelidze & Gueguen 1999; Chelidze et al. 1999). On solid surfaces, chemical and physical interactions change the constituents' distinctive electrical reactions.
When clay minerals are discovered, consideration must be given to the correlations between the electrical properties of the conductor and insulator, which are significantly impacted by saturation, salinity, and frequency effects. In general, the concentration of ions of the reservoir liquid, or salinity, and the composition of clay control the electrical properties of mixes (Olhoeft 1985; Nover 1995; Shaltout et al. 2012). The electrical properties of shaly reservoir sandstones are also influenced by the dispersion of clay inside the sandstones (Wang & Zhang 2019; Gomaa et al. 2021). The study investigated the effects of clay dispersion on the electrical characteristics of the samples using laboratory measurements (Bücker & Hördt 2013; He et al. 2017; Gomaa & Abou El-Anwar 2019). The lithology, porosity, permeability, composition, and structure of the rock all affect the clay's electrical properties. The most important electrical parameters for measurements are the conductivity and impedance features of clay (Slater 2007; Jougnot et al. 2010; Osterman et al. 2019). These parameters and attributes can reveal details on the composition, porosity, permeability, and petrological properties of the clay (Kemna et al. 2012; Weller et al. 2013).
The main constituents of mica, feldspar, and quartz may be mixed up with the particles of clay (kaolinite). Clay has a higher electrical conductivity than sand due to the presence of these conductive components. A combination of sand and clay has conductivity that is around that of clean sand and clean clay. The combination gets increasingly electrically conductive as the concentration of clay (conductive materials) increases (Lima 1995). Nevertheless, a mixture of sand and clay would normally have a higher electrical conductivity the more clay there is in the mixture (Lima & Sharma 1991, 1992; Gomaa 2008). Clay minerals affect a mixture's cation-exchange capacity, hence adding more clay to a mixture will probably enhance its electrical conductivity when combined with sand.
An operational diagram of the four-electrode device is shown in Fig. 5b. The actual representation of the electrical device and electrode system. Figure 6 illustrates the variation in conductivity with frequency for Wadi Saal, East Central Sinai samples. The degree to which clay-like sediments are electrically conductible depends on the rock's surface conductivity, and its cation-exchange capacity (Lima & Sharma 1991, 1992). The cation-exchange capacity of a mix is influenced by clay minerals; hence a rise in clay content is likely to result in an increase in the electrical conductivity of the sample. As the amount of sand increases, resistivity must also decrease. Two sets of specimens can be distinguished based on the amount of conductor elements present in each specimen. The first one contains a very high concentration of clay (very little sand) and is made up of high clay or carbonates (and sometimes water). The conductivity range of this group is from 10−2 to 10−1 (S/m). The second sample set includes a relatively high concentration of sand (low percentage of clay). The conductivity range of this group ranges from 10−2 to 10−3 (S/m). Samples that have conductivity above 10−1 have high concentrations of water (Lima 1995).
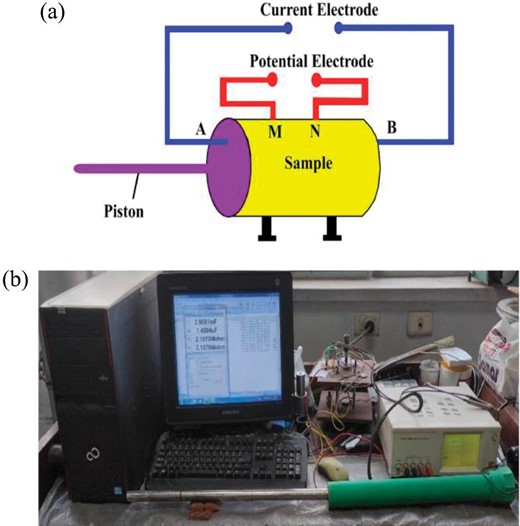
(a) Illustration of the four-electrode device operation. (b) The actual image of the electrical instrument and electrode system.
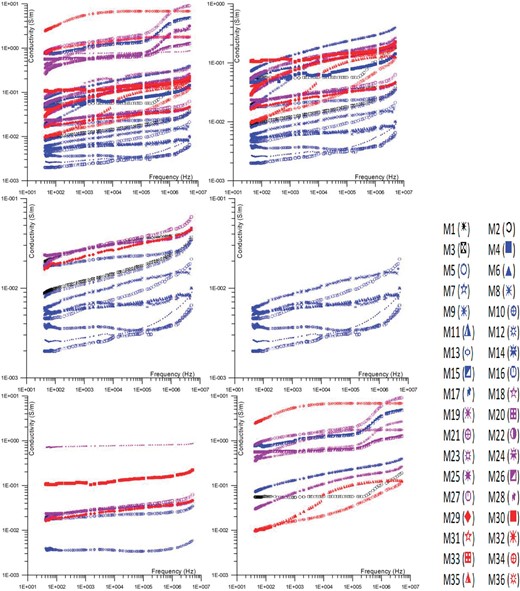
The change of conductivity with the frequency of samples.
Increased continuous conductor interconnections among grains and minerals tend to appear as frequency and conductor intensity rise. Conductivity values increase with frequency due to the higher energy barriers between atoms caused by increasing particle activity levels (Gomaa 2013; Xie & Li 2018). These methods convert an insulator's behavior into that of a semiconductor or conductor. The electrical properties of mixtures are influenced by factors such as frequency and conductor concentration. Unlike sands and sandstones, a range of less petrophysical correlations between electrolytic conductivity and permeability can arise due to the complexity of carbonate porosity. The conductivity of these mixes rises as the number of conductor channels rises in the case of carbonate rocks (Levitskaya & Sternberg 1996a, b). Furthermore, small amounts of clay or other silicate components may have an impact on the electrical conductivity of carbonate rocks, which may ultimately control the complicated electrical conductivity of the rocks. Furthermore, the electrical properties of sand and carbonate mixtures are influenced by the composition of the mixture and the presence of conductive channels or constituents or conductor concentration.
Frequency often causes conductivity to rise. At samples M15, M21, M22, M26, M34, and M35, the conductivity curve has two slopes. The first one is nearly flat at relatively low frequencies. At higher frequencies, the slope of the curve becomes steeper (Efros & Shklovskii 1976). The conductivity value changes suddenly. At relatively low frequencies, a DC continuous path emerges, or the samples' total conductor concentration exceeds the critical percolation threshold. Additionally, the conductivity generally rises as the concentrations of all conductors rise. It is supposed that the curves (samples) that have high conductivity (>10−1 s/m) values at low frequencies have relatively high total conductor concentrations. Most of the curves (samples) that have relatively low conductivity (<10−1 s/m) values, at low frequencies, have relatively low total conductor concentrations, and a single slope (0.2) that represents the frequency dispersion (Levitskaya & Sternberg 1996a, b). Low conductivities at low frequencies and low conductor concentrations appear in the samples. Conductivity increases at high frequencies due to the increased number of continuous conductor paths of total conductor concentrations (Knight 1983, Knight and Endres 1990). The increase in conductivity is observed with the increase in frequency due to the necessity for particles to break through energy level barriers to establish continuous conductor pathways among themselves (Chelidze et al. 1999; Jonscher 1999).
Especially when the overall conductor concentrations are low, the interstitial space between the insulator grains is substantial. The phenomenon of bigger conductor clustering can occur when there is a higher concentration of total conductors, leading to a decrease in distance between them (Knight and Nur 1987, Levitskaya and Sternberg 2000). This might result in the connection of isolated conductor grains, forming larger chains or clusters of conductors (Chelidze & Gueguen 1999).
The dielectric constant fluctuation with frequency for the Wadi Saal, East Central Sinai samples is shown in Fig. 7. Relative permittivity, another name for the dielectric constant, is a characteristic that characterizes a material's reaction to an electric field. It gauges a substance's capacity to hold electrical energy within an electric field. A material's dielectric constant can fluctuate with frequency, and this change can provide important details about the material's composition and characteristics. Various dielectric characteristics are displayed by the samples based on their composition and structure. The rock's cation-exchange capacity and surface conductivity affect how much electrical energy the samples are capable of holding. Clay minerals have an impact on a mixture's cation-exchange capability. Consequently, a higher concentration of clay is probably going to cause the sample's electrical store electrical energy to rise, which will raise the dielectric constant. The dielectric constant rises when there are more insulator cluster particles in the sediments because they obstruct the flow of electric charges (Levitskaya & Sternberg 1996a, b). Furthermore, the dielectric constant may be affected by the water content of the sediments.
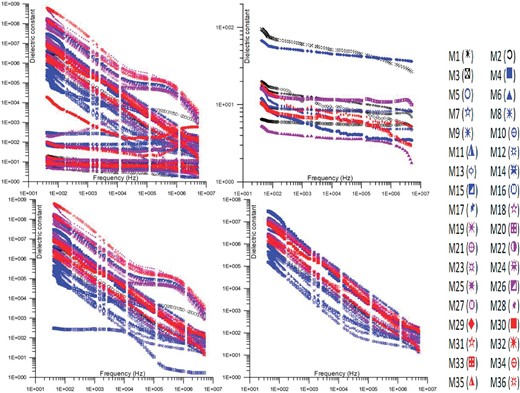
The change of dielectric constant with the frequency of samples.
The number of broken paths between two insulator clusters in the specimens allows three sets of specimens to be identified. There is only one slope in the first set of curves. There are two slopes for the second set of curves. The response of the third set of curves is flat with frequency (Jonscher 1999). An extremely high concentration of isolated carbonates, or clusters of sand and occasionally isolated water, can be found in the first category. At low frequency (42 Hz), the range of this group's dielectric constant is 105 to 5 × 10⁷. The concentration of isolated carbonates, isolated water, or isolated sand clusters is comparatively lower in the second group. This group's dielectric constant ranges from 6 × 10⁷ to 109 (42 Hz). Low concentrations of isolated sand, carbonates, or water clusters can be found in the third group. This group has a dielectric constant range of 7 × 101 to 3 × 10² (42 Hz).
The dielectric constant of specimens, particularly the dry ones, is influenced by both the sample elements and the air, as they are combined in the production process. The dielectric constant of a substance provides insight into its ability to store electrical energy inside an electric field. The dielectric properties of a material can be affected by various elements, including pore size, structure of the solid components, temperature, pressure, salinity of the pore fluid, water saturation, and the concentration of fluids and minerals. The dielectric properties of clay exhibit a high degree of sensitivity to variations in its concentration.
The observed phenomenon of the dielectric constant progressively increasing as the concentration of total conductor increases can be explained by the decrease in the spacing between the grains of the conductors, resulting in a capacitive effect. This effect is particularly prominent at lower concentrations of total conductors. As per the findings of Jonscher (1999), a positive link has been observed among the concentration of total conductors and the capacitance of a system.
The dielectric constant and frequency have an inverse connection in which a rise in frequency originates a fall in the dielectric constant. Because of its intrinsic dependency on the structural properties of the sample, the dielectric constant is unpredictable. Because there is less time for charges to rearrange in reaction to the electric field, there is a decrease in particle polarization as the frequency rises. Narrow insulating gaps between granules or clusters of semiconducting materials affect the high dielectric constant values. The total frequency dependency of a combination depends on the proportions of constituent and how they are arranged in space within the mixture (Jonscher 1999).
The application of Kramers–Kronig relations enables the establishment of constraints on the frequency-dependent behavior of electric conductivity and permittivity in heterogeneous media. The aforementioned limitations were not adhered to in the present samples, as they did not demonstrate congruity with the slope of said samples (Gomaa et al. 2015a, b).
Figure 8 illustrates the differences in impedance, both real and imaginary, of samples obtained from Wadi Saal in the East Central Sinai region. These variations are observed as the ratios of sand and carbonate (limestone) mixture is altered. The complex resistivity exhibits three distinct sets of phenomena. The initial cluster, characterized by the highest resistivity values, has an arc that possesses the minimum real impedance and the maximum imaginary impedance. This group should encompass a significant number of insulator materials, such as sand. The second group exhibits a semicircular impedance plot characterized by moderate levels of both real and imaginary impedance, indicating a moderate level of resistance. Sand and clay are illustrative examples of materials that exhibit moderate quantities of conductor and insulator qualities, hence classifying them within this particular group. The third group displays a configuration consisting of a semicircle connected to an arc, or potentially only a semicircle. This configuration exhibits relatively high real impedance and low imaginary impedance, and is associated with the lowest resistivity values. It is expected that this particular group will possess significant numbers of conductive elements, including clay and sand (Jonscher 1999).
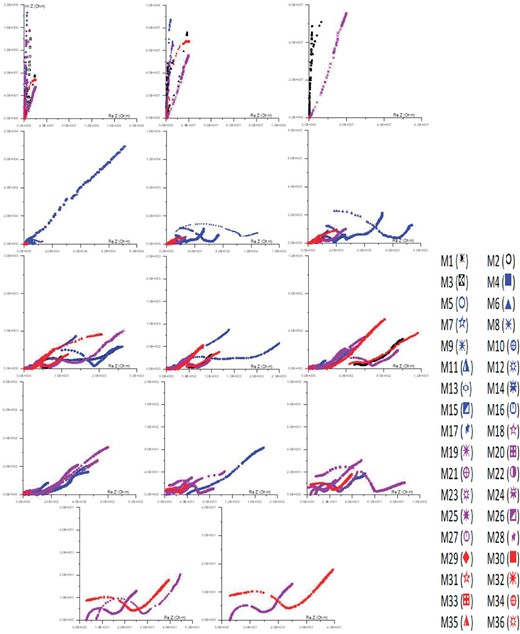
The Argand (impedance) plane changes with the frequency of samples.
Plotting samples with low conductor concentrations on the impedance plane yields an arc-shaped result. The arc becomes smaller and more half-circular in shape as the whole amount of conductor transference channels rises; this is a sign of low impedance. There is a comparable decrease in the amount of conductor transference clusters seen among electrodes when samples' real and imaginary impedances rise (El Sayed et al. 2008).
Several comparisons could be established between these and other comparable specimens that could be potentially present (Chew & Kong 1980; Chelidze & Gueguen 1999; Chelidze et al. 1999).
The complicated impedance plot exhibits an arc, which represents a segment of a semicircle. The presence of a significant concentration of conductive materials results in the transformation of the arc into a nearly full semicircular shape. According to Grant (1958), the size of this semicircle decreases as the concentration of conductors increases. Finally, at low frequencies and with high conductor heights, the semicircle either diminishes significantly in size or may exhibit a tail-like extension. Figure 8 illustrates the presence of an arc connected to a concave semicircle in specific specimens. The presence of a greater number of continuous conductor pathways connecting the electrodes has the potential to result in a decrease in effective impedance. According to Gomaa & Abou El-Anwar (2019), the impedance plane exhibits variations that are directly related to the insulator elements, which are determined by the concentration and texture of the conductor particles.
Regardless of the minimal amount of water injected, the conductivity values of samples tend to increase when they include higher quantities of water. Samples with different textures can exhibit significantly different electrical responses, even when they have the same water concentration (Chew & Kong 1980; Chelidze & Gueguen 1999; Chelidze et al. 1999).
A discernible distinction can be observed between the dry samples and the samples that exhibit partial or complete saturations. In the case of dry samples, the direct current conductivity exhibits an upward trend with increasing water content, ultimately leading to its complete cessation. Dry samples often exhibit insufficient conductivity that is steady throughout a wide frequency range. This is because there are fewer conductive ions and less water in dry samples, which minimizes the ions' capacity to migrate and conduct electricity (Chelidze & Gueguen 1999; Chelidze et al. 1999). The rise in conductivity of partially saturated samples with frequency can be attributed to the phenomenon of polarization occurring at the interfaces of grains. The conductivity of a material is governed by its electron mobility, which refers to the ease with which electrons may move through it.
A rise in saturation, salinity, and frequency causes a decrease in dry rock's relative dielectric permittivity. The dispersion of pore openings is responsible for the frequency-dependent relationship between the dielectric constant and the sample, as Jonscher (1977, 1999) and Gomaa & Elsayed (2009) have discussed.
The impedance plane varies based on the saturation level of the samples. The fundamental characteristics of the material as well as the impedance of the electrode contact determine the impedance region of slightly saturated materials (Jonscher 1977).
Laboratory electrical measurements (impedance, dielectric constant, and conductivity) are used in this study to provide light on the relationship between the textural, petrographical, petrophysical, and geochemical composition of the materials. Examining electrical characteristics of reservoir rock enhance oil and gas recovery of clay–sand mixtures at different concentrations.
4. Conclusion
This study looks into how the electrical properties of rock samples affected by lithology, porosity, and permeability (Wadi Saal area of East Central Sinai, Egypt). The petrography shows that there are two main types of rock, sandstone and limestone, with some clay minerals present in smaller amounts. The porosity and permeability values are linked in the real world. It is hard for water to pass through carbonate (limestone) facies, but it is easier for water to pass through sandstones. The tests were done at 31°C with 47% humidity and frequencies from 42 Hz to 5 MHz. Wadi Saal has marine limestone aquifers, Paleozoic rock layers, and volcano sedimentary formations that have changed over time. These features make it an important source of unconventional hydrocarbons. Electrical readings are a good way to find out about the properties of clay and other formations that hold water. There are four types of sandstone facies: vertebrate quartz, arenite calcareous quartz, armatiz quartz, and arenite quartz sublithic. Petrographically, the main porosity is caused by primary intergranular porosity. Secondary porosity is caused by detrital clays filling the holes and feldspar leaching out of them. An increase in the conductive percentage leads to the formation of grouped clusters, which results in a decrease in the number of insulating gaps between conducting elements. Because of chemical and physical reactions, at the surface grains, the electrical responses of the mixture change. When the amount of clay in samples goes up, the electrical conductivity also goes up. The amount of clay, the saltiness, the surface conductivity, and the cation-exchange all affect electrical characteristics. The impedance plane is a way to look at the electrical qualities of different materials. The main goal is to study the electrical properties of clay–sand mixtures at varying clay concentrations and saturation levels. As a recommendation, we should use rigorous, empirical research methodologies to acquire and analyze data. Also, we should search for computational models and simulations to integrate empirical data and construct predictive hypotheses regarding subsurface behavior.
Acknowledgements
The author expresses gratitude to Dr. Mohamed Kassab for his assistance in obtaining and analyzing the rock samples, as well as his support in doing petrographic measurements.
Conflict of interest statement
None declared.
Funding
No funding was obtained for this study.
Data availability
All data generated or analyzed during this study are included in this published article.
