


Abstract
Species living in sympatry and sharing a similar niche often express parallel phenotypes as a response to similar selection pressures. The degree of parallelism within underlying genomic levels is often unexplored, but can give insight into the mechanisms of natural selection and adaptation. Here, we use multi‐dimensional genomic associations to assess the basis of local and climate adaptation in two sympatric, cryptic Crematogaster levior ant species along a climate gradient. Additionally, we investigate the genomic basis of chemical communication in both species. Communication in insects is mainly mediated by cuticular hydrocarbons (CHCs), which also protect against water loss and, hence, are subject to changes via environmental acclimation or adaptation. The combination of environmental and chemical association analyses based on genome‐wide Pool‐Seq data allowed us to identify single nucleotide polymorphisms (SNPs) associated with climate and with chemical differences. Within species, CHC changes as a response to climate seem to be driven by phenotypic plasticity, since there is no overlap between climate‐ and CHC‐associated SNPs. The only exception is the odorant receptor OR22c, which may be a candidate for population‐specific CHC recognition in one of the species. Within both species, climate is significantly correlated with CHC differences, as well as to allele frequency differences. However, associated candidate SNPs, genes and functions are largely species‐specific and we find evidence for minimal parallel evolution only on the level of genomic regions (J = 0.04). This highlights that even closely related species may follow divergent evolutionary trajectories when expressing similar adaptive phenotypes.
Abstract

INTRODUCTION
The degree to which evolution is predictable has been widely debated among evolutionary biologists (Beatty, 2006; Gould, 1989; Morris, 2010). If the outcome of ecological selection pressures was predictable, we would expect to repeatedly witness the same phenotypical and genomic patterns in nature. Indeed, repeated and similar phenotypical evolutionary traits across species boundaries (e.g., Hume & Martill, 2019; Oke et al., 2017; Therkildsen et al., 2019) suggest that adaptation by means of natural selection is the major cause of parallel evolution (Endler, 1986; Schluter, 2000; Simpson, 1953). Therefore, the investigation of parallel evolution provides important insights in mechanisms of ecological adaptation (Morales et al., 2019; Rosenblum et al., 2014; Schluter et al., 2004).
The likelihood of parallel evolution largely depends on the level of biological hierarchy, decreasing from overall phenotype to organ structure, pathways, genes down to the nucleotide level (Bailey et al., 2015). Whether a pattern of parallel evolution is conserved from the phenotypic to the genotypic level largely depends on the genetic architecture of traits whereas parallelism is more likely in oligogenic traits and less in polygenic traits (Wood et al., 2005). Parallel evolution seems to be more likely when the compared groups are subject to exactly the same selection regime allowing for parallel local adaptation and even more so when these groups approach their fitness optimum, leaving fewer possible beneficial mutations (Bailey et al., 2015; Orr, 2005). The likelihood for parallel evolution seems to increase with the strength of natural selection and for genes that have large phenotypic effects (MacPherson & Nuismer, 2017). Intuitively, parallel adaptation should be most likely to occur under completely identical natural selection (see Thompson et al., 2019) and under the premise of shared (recent) evolutionary histories (Conte et al., 2012). Studies from natural systems so far showed several instances, in which species or populations showed a substantial overlap in patterns of genomic changes (Chaturvedi et al., 2018; Haenel et al., 2019), whereas in several other instances there was evidence for largely idiosyncratic evolution (Feldmeyer et al., 2017; Kaeuffer et al., 2011; Pfenninger et al., 2015; Wittkopp et al., 2003). However, it should be noted that the reasons why parallel selection was not detected in those studies can be twofold: firstly, if the studied species lacked a common direct ancestor, the potential for parallel evolution is weakened due to different evolutionary histories. Furthermore, if the focal species or populations inhabited different locations, potential site‐specific selection regimes could further constrain parallel evolution. Predicting the outcome of selection pressures acting on species has never been of greater importance than in the light of anthropogenic habitat destructions and climate warming and will greatly aid in conservation efforts (Waldvogel et al., 2019). One promising approach is to compare phenotypic responses of closely related sympatric species to truly parallel selection pressures and analyse the genomic underpinnings of resulting phenotypes.
Among the most important local selection pressures are temperature and precipitation that ultimately shape virtually all abiotic and biotic conditions (Scheffers et al., 2016). Both factors can vary within short geographical distances leading to pronounced climatic clines. Species therefore often encounter gradually differing climatic selection pressures across their distribution ranges, which drives climate adaptation of local populations, maximizing their fitness under local climate conditions. The importance of local climate adaptation has been recognized in the past few years, and their genomic underpinnings have been studied in plants (Rúa et al., 2016; Turner et al., 2010), especially crops (Mercer et al., 2008; Pyhäjärvi et al., 2013), and in animals as for example in some birds (Charmantier et al., 2016; Dreiss et al., 2012; Slabbekoorn & Peet, 2003) and in insects (e.g., Bergland et al., 2016; Pringle et al., 2012; Waldvogel et al., 2018). Especially, the latter, being ectotherms, are particularly vulnerable to variation in ambient temperature, which directly influences essentially all functions from locomotion to metabolism. In insects, an important part of the acclimatory response to climate variation concerns changes in the cuticular hydrocarbon (CHC) profile. CHCs make up the main part of the epicuticular layer of terrestrial arthropods. It is hypothesized that they originally evolved as waterproofing agents and they were shown to be plastic within populations in response to different temperature and humidity levels (Menzel et al., 2018; Otte et al., 2018; Sprenger et al., 2018). Heritable differences were also shown between natural subpopulations as a response to parameters that covary with latitude and season (Frentiu & Chenoweth, 2010; Rajpurohit et al., 2017). However, CHCs in insects not only protect against desiccation, but are also used as communication signals, and are highly important in species recognition (Blomquist & Bagnères, 2010). Some species can plastically change their CHC profiles in response to social cues, for example, acoustic stimuli or rivalry (Thomas & Simmons, 2011), and courtship (Petfield et al., 2005). This dual function of CHCs, as a short‐term and long‐term adaptive response to ecological selection pressures, as well as communication signals (Chung & Carroll, 2015; Chung et al., 2014), makes it challenging to precisely determine the cause for differences in CHC profiles and untangle possible environmental adaptation from their role in communication and species recognition (Sprenger & Menzel, 2020). This is especially true in social insects, in which communication via CHCs is highly elaborate and allows the discrimination between species, colonies and castes (Leonhardt et al., 2016; Pamminger et al., 2014), facilitates task allocation (Greene & Gordon, 2003) and thus enables their sophisticated social structure.
We present the neotropical cryptic ant species Crematogaster levior A and C. levior B as a model system to test for parallel local adaptation in response to local climate selection (Hartke, Sprenger, et al., 2019).
The colonies of these closely related cryptic sister species, that are mutualistically shared with the ant Camponotus femoratus, occur in sympatry (often within a few metres) over a large part of their distribution range and are thus subject to the same climatic selection pressures in these areas (Hartke, Sprenger, et al., 2019; Sprenger et al., 2019). Despite their modest genetic distance (Hartke, Sprenger, et al., 2019), and their strong morphological analogy, the two cryptic species show striking differences in their cuticular hydrocarbon profiles (Emery & Tsutsui 2013; Hartke, Sprenger, et al., 2019; Menzel et al., 2017; Sprenger et al., 2019), which might, for example, be indicative for differential adaptation to climate (Gibbs et al., 1997), or differential selection on recognition, for example mate‐choice (Thomas & Simmons, 2009). Based on the mitochondrial molecular clock (2.3%–4% bp changes per million years in insects; Norman et al. 2016), we estimate the divergence time for the two Crematogaster species to be somewhere between 946 kya and 1.65 mya (based on 3.79% sequence divergence in the mitochondrial marker COI (Hartke, Sprenger, et al., 2019). In French Guiana, the two species largely share the same habitat, which is characterized by a climatic gradient with a cooler and wetter east and a hotter and drier west.
We conducted population genomic analyses (Pool‐Seq) with C. levior A and B and (a) used FST outliers to identify signatures of local adaptation among conspecific populations; (b) performed an environmental association analysis (EAA) to investigate the influence of varying selection pressures, such as temperature, precipitation and vegetation cover, on population differentiation; and (c) carried out a chemical association analysis (CAA) to find patterns of genomic differentiation that correlate with differences in the populations’ cuticular hydrocarbon profiles. Finally, we compared these results between the two species to identify differences and similarities in adaptive response and ultimately to determine whether local adaptation follows a parallel pattern or species‐specific trajectories.
MATERIAL AND METHODS
Sampling and sequencing
Individuals used for pooled sequencing were collected during a single expedition to French Guiana during September and October 2016. For both C. levior A and C. levior B, 15 colonies of five populations each were chosen (Figure 1a). We decided for a pooled sequencing approach, as this sequencing technique results in less variation of allele frequency estimates compared to individual sequencing, while being more cost‐effective (Anand et al., 2016; Schlötterer et al., 2014). The sampling design for pooled sequencing was chosen to best span the climate gradient characterized by a hotter and drier east and a cooler and wetter west (Figure 1a). Within each population, we only sampled colonies which were at least 30 m apart (for detailed locations, see Table S1). Per population, the heads of 105 individuals (seven per colony) were pooled and sequenced using 2 × 150 bp paired‐end Illumina sequencing. The resulting data were quality processed and mapped on the C. levior A reference genome (Hartke, Schell, et al., 2019). The mapped reads were filtered for duplicates, and all bases below a minimum quality of 20 were discarded (for more details on DNA isolation, sequencing and downstream processing: Supplement 1.1).

(a) Overview of sampling sites. Map coloration refers to mean annual precipitation (CHELSA Bioclim 1979–2013). Temperature is inversely correlated with precipitation. The coloration of location labels refers to the species sampled there (grey = only C. levior A, white = only C. levior B, striped = both species). (b) Allele frequency PCA computed from 1,000,000 randomly sampled genome‐wide SNPs between all sequenced populations. The letters after the location name refer to the species C. levior A and B, respectively. (c) Principal component analysis of environmental and climate parameters in 5 populations of C. levior A and (d) C. levior B. Not shown is PC3 that explained 13.9% and 11.6% of the variance in C. levior A and B, respectively. For clarity reasons, overlapping temperature and precipitation arrows are indicated in red and blue, respectively, without detailed description
Population differentiation and local adaptation
We followed the PoPoolation2 v1201 pipeline for further downstream processing (Kofler et al., 2011; Supplement 1.1). Pairwise FST was calculated in non‐overlapping 1 kb windows (C. levior A: N = 251,595; C. levior B: N = 245,286) between all populations as a measure of population differentiation using the fst‐sliding.pl script integrated in PoPoolation2. We conducted Mantel tests with 9,999 permutations between genome‐wide mean FST values and geographical distance to test for genome‐wide isolation‐by‐distance patterns. Based on a subset of 10,000 randomly drawn SNPs to avoid confounding factors due to linkage disequilibrium, we performed a principal component analysis (PCA) with pcadapt v4.0.0 (Luu et al., 2017) to visualize the population structure of C. levior A and B. To this end, observed allele frequencies at each locus were used to simulate 20 individuals, following the BAYENV approach (Günther & Coop, 2013). The PCA was calculated on five different subsets of SNPs to ensure the consistency of results.
BayPass v2.1 (Gautier, 2015) was used to detect significant outliers in allele frequencies among our sampled populations within each of the two species. BayPass allows for a robust identification of differentiated markers across populations, while correcting for demographic effects, which proved advantageous compared to similar tools based on a Bayesian framework. BayPass first computes the allele frequency covariance matrix Ω that gives information on the shared demographic histories of the populations. Following the suggestion of Gautier (2015), we used the R function simulate.baypass() to simulate a pseudo‐observed dataset consisting of 250.000 SNPs based on the covariance matrix. BayPass calculated the FST‐like parameter XtX that accounts for shared population history (Günther & Coop, 2013). The upper 1% quantile threshold of the simulated data set (C. levior A: XtX > 10.19; C. levior B: XtX > 11.01) was used to define outliers in our empirical data sets which may reflect signatures of local adaptation.
Environmental data for association analysis
We calculated a PCA with factoextra v1.0.5.999 (Kassambara & Mundt, 2016) for each species using the CHELSA Bioclim variables (monthly climate data for the years 1979–2013; Karger et al., 2017) in combination with the MODIS data sets of the year 2016 for Evapotranspiration (Running et al., 2017), Thermal Anomalies (Giglio & Justice, 2015) and Vegetation Indices (Didan, 2015). The first three PC axes that explain >90% of the variance were used as input for the environmental association analysis (EAA) with BayPass (Gautier, 2015). As additional input, the MODIS data set Vegetation Continuous Fields was used (Dimiceli et al., 2015; for detailed description of environmental data see Supplement 1.2).
Chemical data for association analysis
Extraction and GC‐MS analysis of cuticular hydrocarbons of the two Crematogaster species is explained in detail in Hartke, Sprenger, et al. (2019). For the chemical association analysis, we calculated the mean relative abundance of each hydrocarbon for the 15 colonies used per pool. We then again calculated a PCA (see section 2.3) for each species on the chemical data set and used the first four PC axes that explain 100% of the variance as input for BayPass. We additionally computed a PCA for the chemical data set that included both C. levior A and B, to visualize the highly differentiated cuticular hydrocarbon profiles of the two species. In this PCA, only those substances that were present in both species were included. We furthermore tested whether population‐specific CHC profiles correlated with the PC axes of the environmental PCA with a PERMANOVA based on Bray–Curtis dissimilarities (function: adonis, R package: vegan, 999 permutations).
Genome‐wide association analyses with BayPass
BayPass was used according to standard protocol (Gautier, 2015) to identify SNPs whose allele frequencies were significantly associated with population‐specific parameters based on the allele frequency differences inferred with PoPoolation2. As population‐specific parameters, we used the environmental data set and for a second analysis, the chemical data set. As a threshold to identify significant associations, we followed Jeffreys’ rule (Jeffreys, 1961) and only considered SNPs with Bayes Factor >20 as decisive.
Genome‐wide association analyses with LFMM
We repeated the association analyses described in parts 2.2, 2.3 and 2.5 using LFMM (Latent Factor Mixed Model; Frichot et al., 2013). For this, we used the same SNP set as for the BayPass analyses. Following the LFMM workflow, we resampled each allele frequency per population to ni = 20 individuals from a simulated beta distribution at each locus: beta(Fil 9 ni + 1, (1 − Fil) 9 ni + 1), with Fil being the empirical frequency at locus l in pool i. We used the prcomp function in R to perform a PCA on the genotypic data to identify the number of K latent factors for the regression model, an estimator of the underlying the genetic data structure. We chose K = 4 for both C. levior A and C. levior B. LFMM was then run separately for each variable of the environmental and chemical factors to allow for a better comparability to the BayPass results. LFMM ridge estimates were calculated with the numerical alternated algorithm, and p‐values were calibrated by computing the median and MAD of the z‐scores. As a significance cut‐off, we used a rather conservative threshold (to reflect the conservative threshold of BF > 20 that was used for BayPass) of p < .001 to identify SNPs that are significantly associated with the given variables.
In general, we found much higher numbers of significantly associated SNPs in LFMM compared with BayPass (see Tables S2 and S3). And accordingly, more of the 10 kb windows contained a significantly associated SNP (see Tables S4 and S5). LFMM identified 1/6 of all 10 kb windows as selected outlier windows, which is—in our opinion—a too high number to be credible. We argue that this indicates that LFMM is not properly accounting for the rather homogenous distribution of SNPs and as a result identified many false positives. Consequently, we decided to only present and discuss the BayPass approach, which seems to give more conservative though more reliable results for our data set.
Functional annotation and Gene Ontology enrichment analysis
For all significantly associated SNPs and for XtX outliers that were found in or nearby (<2,000 bp) genes, we ran BLASTp and InterProScan (Quevillon et al., 2005) on the genes’ protein sequence. We furthermore checked for gene function using UniProt based on gene descriptions found with BLAST. To gain a more comprehensive overview of outlier functions, we summarized the GO terms of outliers within and nearby genes with REVIGO (Supek et al., 2011), using the Drosophila database. We also performed a gene enrichment analysis with the R package topGO v2.34.0 (Alexa & Rahnenführer, 2016) using the GO terms of all C. levior genes as a reference. GO terms were retained with a significance level cut‐off of p < .05.
Window‐based analysis
In addition to the site‐based analyses, we also analysed SNPs in greater genomic regions. For this, the genome was divided into 10 kb windows (C. levior A: N = 31,496; C. levior B: N = 31,143) and pairwise FST values were calculated using the script fst‐sliding.pl within PoPoolation2. The upper 1% quantile was used as a threshold to identify significantly differentiated windows between populations, and adjacent windows were merged to greater genomic regions using bedtools merge (Quinlan & Hall, 2010). We identified genes that are located within these regions and conducted an enrichment analysis, as described in 2.6.
Assessment of parallel evolution
To statistically assess to what extent the observed intersection in divergent features among pairs of species would be expected by chance, we applied a randomization procedure implemented in a custom Python script. We used 10,000 replicates to infer how often an observed intersection of size i of x and y positive draws from a base population of size z was larger or smaller than those from random draws. For comparison, we quantified the extent of parallel evolution on each level of biological organization with the Jaccard and corrected Jaccard index (Pfenninger et al., 2015). The index ranges from 0 (no overlap) to 1 (completely parallel evolution).
Fixed differences between species
As a direct measure of between species differentiation, we identified SNPs which were fixed in one of the two species but consisted of two alleles with varying frequency in the other species. We furthermore determined how many of those SNPs were situated in protein‐coding regions, and additionally how many of them were situated in manually curated elongase and desaturase genes (Hartke, Schell, et al., 2019), using bedtools intersect (Quinlan & Hall, 2010). To determine whether substitutions at a given SNP site would result in non‐synonymous substitutions, we used tbg‐tools (https://github.com/Croxa/tbg-tools) to obtain amino acid information for each SNP site. Using chi‐square tests, we tested whether the numbers of these SNPs differed between species.
RESULTS
Population differentiation and outlier analysis
We generally found very low FST among all population‐pairs within C. levior A and B respectively. In C. levior A, mean pairwise FST ranged from 0.043 to 0.057 (mean = 0.047; Table 1, Figure S1A). In C. levior B, albeit being higher than in A, pairwise FST were still low with values between 0.057 and 0.082 (mean = 0.066; Table 1, Figure S1B), indicating high connectivity between populations within French Guiana and very low levels of population differentiation. This is also reflected in the PCA based on a randomly drawn subset of SNPs (Figure 1b). C. levior A populations are generally more closely related than C. levior B populations (see also Hartke, Sprenger, et al., 2019). The two species are clearly separated by the first PC, whereas intraspecific allele frequency variation is mainly reflected on PC2. Actual geographical structure of both species is not mirrored within the PCA, and also the Mantel tests revealed no sign of isolation by distance in C. levior A (p = .258, r = 0.24), whereas in C. levior B we found a weak trend (p = .083, r = 0.35). This suggests a stronger population structure within C. levior B, which is also reflected in slightly higher pairwise FST values.
Mean pairwise FST between populations, calculated in 1 kb windows
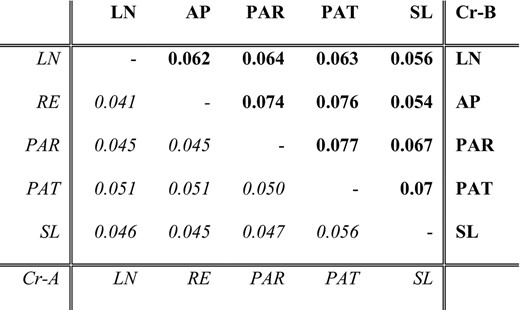
Values of pairwise comparisons of C. levior A populations are shown in the lower (italic) part, values for C. levior B populations in the upper part (bold).
Mean pairwise FST between populations, calculated in 1 kb windows
Values of pairwise comparisons of C. levior A populations are shown in the lower (italic) part, values for C. levior B populations in the upper part (bold).
BayPass calculates XtX as measure of allele frequency differentiation between populations, which one can use to discriminate between selection and neutrality and thus deduce significant outliers that indicate signatures of local adaptation (Gautier, 2015). We found 114 outlier SNPs in C. levior A and 34 genes, in or nearby where outliers were located (Table S13). The outlier analysis in C. levior B yielded more SNPs (N = 399) and more genes (N = 168) (Table S13). None of the SNPs were shared between species, and one of the genes was found in both species (reverse transcriptase). GO term analyses of outliers found between populations and located in or nearby genes, yielded 10 terms associated with biological processes in C. levior A and 56 in B, respectively (Table S6). Of those, 5 and 18 were significantly enriched in C. levior A (e.g. sensory perception of sound and light stimulus) and B (e.g. humoral immune response and glycerol ether metabolic process), respectively. None of the terms were found in both species (note that one gene was shared between species, however, this gene lacks GO information).
Principal component analyses of population‐specific parameters
In C. levior A and B, the PCAs with environmental factors resulted in three PC axes that together explained 95.3% and 93.8% of the variance, respectively. The first PC axis in both cases correlated positively with precipitation, and negatively with temperature (Figure 1c,d). The colonies from Patawa were separated from the other populations by higher precipitation and lower temperature, and Paracou was separated from the other populations by a higher precipitation seasonality, both of which is also visible when looking at an overview of the populations’ temperature and precipitation parameters (Figure S2). The PCAs based on the cuticular hydrocarbon profiles of colonies resulted in four PCs that explained 100% of the variance in both species (Figure S3). A combined PCA based on CHC profiles for both C. levior A and B (Figure 2) showed a clear separation of the species (see also Hartke, Sprenger, et al., 2019) and reflected the highly differentiated cuticular hydrocarbon profiles (Sprenger et al., 2019). The first principal component explained 59.6% of the variation and separated C. levior A from C. levior B. The hydrocarbons associated with this axis largely consist of long‐chain, unsaturated CHCs typical for C. levior A and the shorter, mostly saturated ones typical for C. levior B. While the populations belonging to C. levior A for the most part clustered together, C. levior B showed more diversity (F‐test, p = .046, F = 0.099). Paracou‐B was clearly separated from the other populations. This is visible by a separation on the second PC axis, which is correlated with the abundance of C29 alkadienes (Figure 2). Climate‐wise, the location Paracou is shaped by rather high temperatures throughout the year and high precipitation seasonality, with almost no precipitation during the dry season (Figure S2).
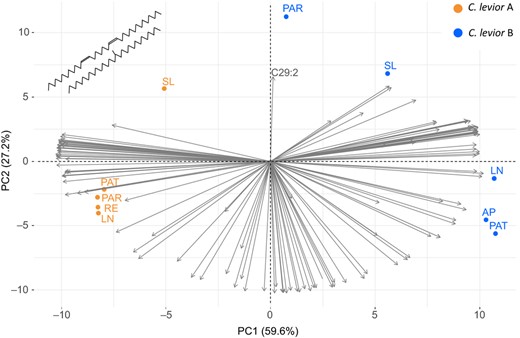
Principal Component Analysis of population‐specific substances in cuticular hydrocarbon profiles of C. levior A and B. Note that the arrow representing C29:2 (nonacosadiene) is the strongest one positively associated with the Paracou‐B population. Grey arrows indicate the axis association of CHC compounds
Environmental Association Analysis (EAA)
We found 122 SNPs that were significantly associated (BF > 20) with environmental parameters in C. levior A (Figure 3a; Figure S4; Table S13). Of those, 43 were found in genes (Table 2). 13 SNPs were privately associated with the first environmental PC axis, which was mostly explained by an inverse correlation of precipitation and temperature (Figure 4a). PC2 was correlated with temperature seasonality and annual range and precipitation seasonality. It was associated with 14 private SNPs. Most of the associated SNPs were found to be correlated with PC3 with 88 private SNPs. The parameters that made up most of the variation of this axis were isothermality inversely correlated with precipitation and temperature seasonality. We furthermore identified two SNPs that were solely associated with the percentage of non‐vegetated landcover (Figure 4a). We found no association with the percentage of tree cover or non‐tree cover. Most of the SNPs were private to one of the environmental parameters, and only few were shared (117 SNPs vs. 5).
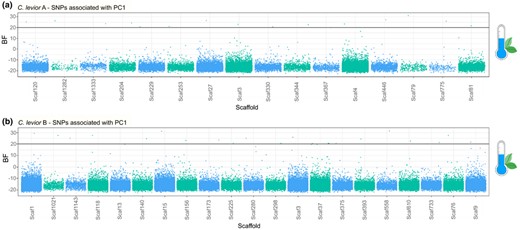
Overview of SNPs that are significantly correlated (Bayes Factor > 20) with PC1 (see Figure 2) in the environmental association studies in (a) C. levior A and (b) C. levior B. Only scaffolds that contain significantly associated SNPs are shown. X‐axis does not represent sequence length. SNPs are sorted by position on scaffolds
Excerpt of genes that are significantly associated with either environment or cuticular hydrocarbon profiles in C. levior A and C. levior B
| Analysis | Species | Gene | Function |
 Environmental association | C. levior A | Unknown Odorant receptor | Sensory perception of smell |
| Odorant receptor OR22c | Sensory perception of smell | ||
| Dunce | Olfactory learning | ||
| Apolipophorins | Fatty acid transport | ||
| C. levior B | Nuclear pore complex | Chitin metabolic process | |
| Scavenger receptor class B | Chitin metabolic process | ||
| Lamin Dm0 | Adult locomotory behaviour, cell ageing | ||
 Chemical association | C. levior A | Odorant receptor OR22c | Sensory perception of smell |
| Unknown Odorant receptor | Sensory perception of smell | ||
| Gld | Cuticular modifications during development | ||
| C. levior B | Tricorner | Antennal development | |
| Fatty acyl‐CoA reductase | Wax biosynthetic process | ||
| Futsch | Olfactory learning | ||
| Odorant receptor OR67c | Sensory perception of smell |
| Analysis | Species | Gene | Function |
Environmental association | C. levior A | Unknown Odorant receptor | Sensory perception of smell |
| Odorant receptor OR22c | Sensory perception of smell | ||
| Dunce | Olfactory learning | ||
| Apolipophorins | Fatty acid transport | ||
| C. levior B | Nuclear pore complex | Chitin metabolic process | |
| Scavenger receptor class B | Chitin metabolic process | ||
| Lamin Dm0 | Adult locomotory behaviour, cell ageing | ||
Chemical association | C. levior A | Odorant receptor OR22c | Sensory perception of smell |
| Unknown Odorant receptor | Sensory perception of smell | ||
| Gld | Cuticular modifications during development | ||
| C. levior B | Tricorner | Antennal development | |
| Fatty acyl‐CoA reductase | Wax biosynthetic process | ||
| Futsch | Olfactory learning | ||
| Odorant receptor OR67c | Sensory perception of smell |
Excerpt of genes that are significantly associated with either environment or cuticular hydrocarbon profiles in C. levior A and C. levior B
| Analysis | Species | Gene | Function |
Environmental association | C. levior A | Unknown Odorant receptor | Sensory perception of smell |
| Odorant receptor OR22c | Sensory perception of smell | ||
| Dunce | Olfactory learning | ||
| Apolipophorins | Fatty acid transport | ||
| C. levior B | Nuclear pore complex | Chitin metabolic process | |
| Scavenger receptor class B | Chitin metabolic process | ||
| Lamin Dm0 | Adult locomotory behaviour, cell ageing | ||
Chemical association | C. levior A | Odorant receptor OR22c | Sensory perception of smell |
| Unknown Odorant receptor | Sensory perception of smell | ||
| Gld | Cuticular modifications during development | ||
| C. levior B | Tricorner | Antennal development | |
| Fatty acyl‐CoA reductase | Wax biosynthetic process | ||
| Futsch | Olfactory learning | ||
| Odorant receptor OR67c | Sensory perception of smell |
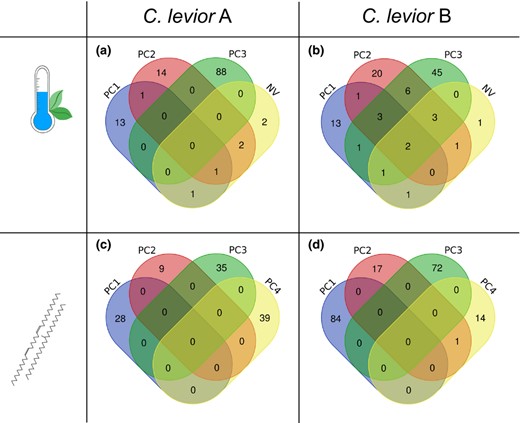
Number of significantly associated SNPs of (a, b) environmental and (c, d) chemical association analyses within (a, c) C. levior A and (b, d) C. levior B. For both analyses, PC1–PC4 refer to PC axes from Principal Component Analyses. NV refers to the percentage of non‐vegetated landscape and was not part of the PCA
In C. levior B, we found fewer SNPs (N = 98, of those 52 in genes (Table 2) (Figure 3b, Figure S5; Table S13) associated with environmental parameters compared with C. levior A. The PC axes can be described similarly as above. PC1 was privately associated with 13 SNPs (Figure 4b), PC2 with 20 and PC3 with 45. The percentage of non‐vegetated landcover was privately associated with 1 SNP (Figure 4b). Like in C. levior A, we found no association with the percentage of tree cover or non‐tree cover.
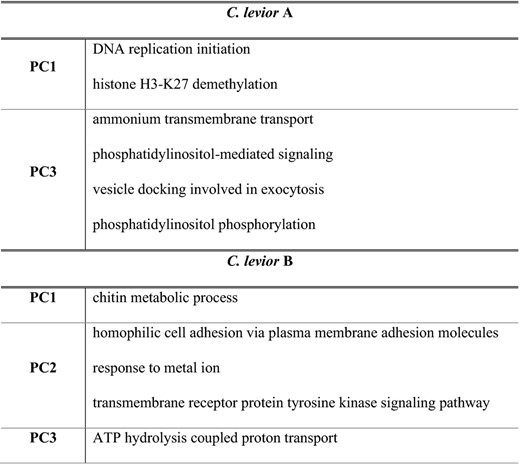
We performed one GO term analysis for all significantly associated SNPs that were found in genes for each species. Six GO terms were significantly enriched for C. levior A and five for C. levior B (Table 3). Functions significantly enriched in C. levior A included ‘DNA replication initiation’ and ‘histone H3‐K27 demethylation’ and in C. levior B ‘chitin metabolic process’.
GO terms that were significantly enriched in the environmental association analysis in C. levior A and C. levior B
For complete list of GO terms implicated in environmental association, see Table S7.
GO terms that were significantly enriched in the environmental association analysis in C. levior A and C. levior B
For complete list of GO terms implicated in environmental association, see Table S7.
Chemical association analysis
The chemical association analyses in general yielded less overlap between PC axes in both species compared with the environmental association analysis (Figure 4c,d). In C. levior A, we found 111 SNPs, 51 of which were located in genes. PC1 was privately associated with 28 SNPs, PC2 with 9, PC3 with 35 and PC4 with 39 SNPs (Figure 4c, Figure S6; Table S13). In C. levior B, we found 188 SNPs (72 in genes), 84 of which were privately associated with PC1, 17 with PC2, 72 with PC3 and 14 with PC4 (Figure 4d, Figure S7; Table S13).
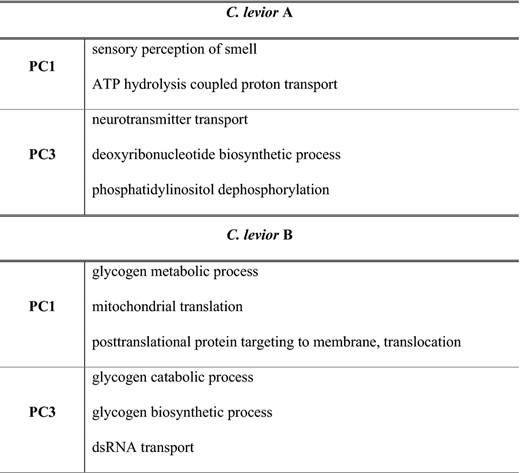
A GO term analysis encompassing all SNPs in genes yielded five significantly enriched terms in C. levior A (e.g. sensory perception of smell) and six terms in C. levior B (e.g. glycogen‐related processes) (Table 4).
GO terms that were significantly enriched in the chemical association analysis in C. levior A and C. levior B
For complete list of GO terms implicated in chemical association, see Table S8.
GO terms that were significantly enriched in the chemical association analysis in C. levior A and C. levior B
For complete list of GO terms implicated in chemical association, see Table S8.
Among the genes that contained significantly associated SNPs in C. levior A (Table 2), two were odorant receptors and are involved in the olfactory perception of cuticular hydrocarbons. Interestingly, one of the odorant receptors (OR22c) was also significantly correlated with PC3 in the EAA, although here, a different SNP within the gene was associated.
In C. levior B (Table 2), we found two genes involved in the synthesis of CHCs and the insect cuticle (serine/threonine‐protein kinase tricorner, fatty acyl‐CoA reductase), and two genes putatively involved in the perception of CHCs (futsch, odorant receptor 67c). The significant association of the SNP within fatty acyl‐CoA reductase is explained by its divergent allele frequency within the Paracou population compared to a fixed allele in all other populations. Interestingly, in the combined chemical PCA, Paracou is also distinctly divergent from the other populations, which can be explained by a single group of hydrocarbons, C29 dienes. We checked whether the SNP we found within Paracou represented a non‐synonymous substitution, and indeed, this SNP changes isoleucine to valine. Also, the SNP within tricorner, a gene associated with antennal morphology, only occured within the population of Paracou.
Multi‐dimensional genomic association and species comparison
In general, the identified SNPs of all described analyses are scattered across the genome, as visible in the Manhattan plots (Figure 3, Figures S4–S7, see also Figure S8 for genome‐wide patterns). This pattern is to be expected when looking at a continuous trait that is classically associated with polygenic adaptation (e.g. Waldvogel et al., 2018), as opposed to categorical traits with two extremes that often result in clustering of associated SNPs (e.g., Mallard et al., 2018; Morales et al., 2019).
The EAA revealed genes and associated GO terms that are significantly correlated with environmental/climate variation across the distribution range of the two species. Nevertheless, signatures of local climate adaptation did not overlap between the two species since we neither found shared significantly associated SNPs, nor genes nor GO terms. This is consistent with the result of the CAA that revealed species‐specific association of genes and GO terms to CHC profiles without overlap between species. Nevertheless, we found the variability of CHC profiles to be significantly correlated with environmental variation across the geographic distance of the sampling area both within C. levior A (PERMANOVA; PC1: pseudo‐F = 2.78, p = .019; PC2: pseudo‐F = 0.070, p = .059; PC3: pseudo‐F = 0.58, p = .69; PC4: pseudo‐F = 4.07, p = .005) and within C. levior B (PERMANOVA; PC1: pseudo‐F = 2.24, p = .039; PC2: pseudo‐F = 3.18, p = .011; PC3: pseudo‐F = 3.05, p = .01; PC4: pseudo‐F = 2.09, p = .068). Multi‐dimensional genomic association finally revealed the odorant receptor (OR22c) as prime candidate to be significantly associated with environmental variation as well as variation in CHC profiles in C. levior A.
Window‐based analysis
In C. levior A, we identified 1,797 highly differentiated windows, which were merged into 1,473 genomic regions. Of those 963 contained genes. Enrichment analysis of those genes yielded 11 significantly enriched GO terms, among others ‘potassium ion transport’, ‘transmembrane transport’, ‘oxidation‐reduction process’, ‘social behavior’ and ‘cellular glucose homeostasis’. In C. levior B, we identified 1,734 highly differentiated windows that could be merged into 1,143 genomic regions, of which 905 contained genes. GO terms from the enrichment analysis contained, among others ‘iron ion transport’, ‘aromatic amino acid family metabolic process’, ‘cellular iron ion homeostasis’, ‘potassium ion transmembrane transport’ and ‘transmembrane transport’. 237 highly differentiated windows and 218 genomic regions were shared between the two species. Significantly enriched GO terms in those regions encompassed ‘potassium ion transmembrane transport’, ‘quinolinate biosynthetic process’, ‘catecholamine biosynthetic process’, ‘centriole‐centriole cohesion’ and ‘tryptophan catabolic process’ (for detailed number of identified windows and complete lists of GO terms, see Tables S10 and S11, respectively).
Parallel evolution
We tested whether the observed overlap between species on a level of SNPs, genes and windows differed from what could be expected by chance (Table 5) and only found significantly larger than expected numbers regarding shared outlier windows (p < .0001). However, the extent of significant parallel evolution was very low (Jcorr = .043).
Parallelism/convergence at different levels of biological organization.
| Complete data set | C. levior A | C. levior B | Shared | Mean expected | p | J | Jcorr | |
| Divergent SNPs | 2,259,912 | 114 | 399 | 0 | 0.02 | .96 | 0.0000 | 0.0000 |
| Genes with div. SNPs | 17,855 | 34 | 168 | 1 | 0.2 | .05 | 0.0050 | 0.0040 |
| 10 kb windows | 31,496 | 1,797 | 1,734 | 237 | 93.5 | <.0001 | 0.0719 | 0.0436 |
Fixed differences between species
The direct comparison of between species SNPs revealed a total of 61,530 fixed SNPs in C. levior A with varying allele frequency in C. levior B and vice versa 22,140 fixed SNPs in C. levior B. Of these, 18,883 were located within protein‐coding regions in C. levior A (3,654 single genes) and 6.564 (6,232 single genes) in C. levior B. There were no SNPs, which were fixed in both species for two different nucleotides. We specifically looked at SNPs in elongase (N = 23) and desaturase (N = 25) genes. We found 78 fixed SNPs in C. levior A, located in 18 genes, and 22 fixed SNPs in C. levior B, located in eight single genes (Table S12). Five desaturase genes with fixed SNP sites, however, at different locations, were similarly identified in both species. In four desaturase genes with a fixed SNP in C. levior A (desat2, desat12, desat17 and desat18) and in three desaturase genes with fixed SNP in C. levior B (desat3, desat11 and desat14), the alternative allele resulted in a non‐synonymous amino acid substitution. Neither the number of SNPs in desaturase genes (χ2 = 1.88, df = 1, p = .17), nor the number SNPs of elongase genes (χ2 = 1.73, df = 1, p = .19) differed between species.
DISCUSSION
In this study, we conducted a population genomic analysis with two closely related, cryptic ant species C. levior A and B. The two species are morphologically very similar, share the same habitat and show no difference in the choice of their mutualistic partners (Hartke, Sprenger, et al., 2019), but show striking differences in their CHC profiles (Menzel et al., 2014; Menzel et al., 2017; Sprenger et al., 2019). We correlated different environmental parameters and the population‐specific CHC profiles to allele frequency differences within each species to untangle the genomic basis of local and climate adaptation and identify potential signatures of parallel evolution.
Population structure and local adaptation
Each of the two species showed rather low levels of genetic differentiation among populations, reflected in low pairwise FST and no indication for isolation by distance, which are ideal settings to identify signatures of local adaptation without confounding demographic effects (Hoban et al., 2016). Since we only sampled across a small geographic area in respect to the complete distribution range, we cannot make inferences on the demographic history of the species at this point. In South‐East Asian Crematogaster species, the opposite pattern was found. There, Crematogaster species show substantial population divergence even on a very small spatial scale (Feldhaar et al., 2010), which indicates that dispersal abilities may differ even between congeneric species.
Tests for local adaptation based on allele frequency differences among populations showed many more differentiated SNPs among C. levior B populations compared with C. levior A populations. This is also visible when comparing the number of fixed SNPs between the two species, with C. levior B showing much lower numbers and thus higher variability. The main reason for this probably lies in the higher intraspecific variability within C. levior B and a stronger population structure. Results from site‐based analyses show that most of the SNPs, genes and also GO functions with a role in local adaptation were species‐specific—with the exception of the gene reverse transcriptase (see section 4.4). However, on a larger scale, window‐based analysis revealed significantly differentiated genomic regions between populations that were shared between species to a low extent (see section 4.4).
Climate structure and environmental association
The east–west transect across French Guiana coincides with a temperature and precipitation gradient. This was reflected in the climate PCAs, with the populations of Saint Laurent and Camp Patawa (near Kaw) at different ends of the gradient (Figure 1c,d). Saint Laurent is characterized by higher temperatures and low precipitation, whereas Patawa represents the coldest and wettest of our sampling locations. Interestingly, in the PCA based on randomly drawn SNPs, Patawa is also distinctly separated from the other populations in C. levior B, and also in C. levior A, although to a lesser degree. This might indicate population‐specific adaptation to a cooler and wetter climate that is reflected within the genome of both species. The fact that this would be visible on a genomic level is not surprising in the light of a recent study on a non‐biting midge that found roughly 1% of annotated genes to be involved in clinal climate adaptation, and another 8% in local adaptation (Waldvogel et al., 2018).
In C. levior A, we found several genes with a proposed function in the detection of CHCs to be implicated with climate variation. Two of those genes are odorant receptors, and one gene, dunce, is responsible for olfactory learning in Drosophila melanogaster (Walkinshaw et al., 2015). The effects of climate variation on olfaction seem to be twofold. On the one hand, ambient temperature increases the concentration of volatiles (including short‐chain cuticular hydrocarbons; Menzel et al., 2019) in the air, but also influences an organism's sensitivity towards those substances, with cooler temperatures allowing for a better perception of olfactory cues (Riveron et al., 2009). The environment can thus directly influence olfactory perception. On the other hand, environmental factors can cause a change in the CHC profile (Menzel et al., 2017; Sprenger et al., 2018) that in turn can lead to a need for changes in olfaction, thus indirectly influencing perception. Interestingly, we found one of those odorant receptors (OR22c) to also be associated with population‐specific variance of CHC profiles. In the case of this gene, the second, indirect, scenario seems to be more plausible. Climate variation may have caused a shift in CHC profiles that in turn could have caused selection on olfactory perception. Indeed, odorant receptors seem to be highly specialized in ants and are able to discriminate even between intra‐colonial quantitative differences in CHC profiles (Pask et al., 2017; Slone et al., 2017). Deeper investigations will be necessary to assess the actual role in climate adaptation of this prime candidate.
In C. levior B, we found two genes associated with intraspecific environmental variation that has functions in chitin metabolism. This pathway is associated with temperature adaptation in D. melanogaster (MacMillan et al., 2016) and the parasitoid wasp Aphidius colemani (Clark & Worland, 2008), and might thus also play a role in temperature adaptation in C. levior B.
Chemical association
Cuticular hydrocarbons are the foundation to the extraordinary social structure of social insects and furthermore facilitate adaptation and acclimation to temperature and humidity (Frentiu & Chenoweth, 2010; Sprenger et al., 2018). In line with their importance in social insects, hymenopterans as such and ants, in particular, possess a high number of CHC synthesis genes (Hartke, Schell, et al., 2019). It is thus of great interest to identify the genomic underpinnings of CHC evolution with a focus on intraspecific variation within profiles. We show here the first genome‐wide cuticular hydrocarbon association analysis and show that this method is indeed suited to find candidate genes underlying CHC diversity, and CHC perception in social insects. In C. levior A, we found two odorant receptors significantly associated with population‐specific variation in CHC profiles. One of them was also associated with environmental parameters. As discussed above, a scenario, in which climate parameters caused a shift in CHC profiles that in turn caused selection on olfactory perception, could serve as an explanation for this pattern. Another gene that was significantly associated with CHC diversity, Gld, serves in cuticular modifications during development in D. melanogaster (Cavener et al., 1986).
In C. levior B, a SNP within the gene fatty acyl‐CoA reductase was significantly associated with population‐specific differences in CHC profiles. This pattern is driven by a mutation at this allele in the population of Paracou, which is separated from the other populations in the chemical PCA with both species by a higher abundance of C29 dienes. Fittingly, in D. melanogaster, fatty acyl‐CoA reductases are responsible for intraspecific CHC variation and have furthermore been shown to influence the synthesis of a C29‐diene (Dembeck et al., 2015). We may therefore cautiously conclude that also in C. levior B, this specific fatty acyl‐CoA reductase may be involved in the synthesis of C29‐dienes and that a mutation in this gene caused a shift in the cuticular hydrocarbon profile within the C. levior B population of Paracou. Due to the dual role of cuticular hydrocarbons, it is hard to say whether in this scenario, a shift in allele frequency was the result of environmental adaptation to a site‐specific factor or the product of, for example, sexual selection confined to Paracou. Of course, this is speculative and future studies aimed at clarifying whether the amount of C29‐dienes is in fact influenced by the fatty acyl‐CoA reductase are needed. In the same species, we furthermore found three different GO terms that are involved in the breakdown and synthesis of glycogen to be significantly enriched in the chemical association analysis (CAA). Glycogen is the storage form of glucose, which is vital for several biological functions, for example, for the synthesis of the chitin layer. Increased glycogen storage is also used as an adaptation to heat and drought (Marron et al., 2003; Parkash et al., 2013, 2014; Reidenbach et al., 2014). It could thus be that the same selection pressure, for example high temperature, leading to a change in hydrocarbon profiles, also led to changes in the synthesis and breakdown in glycogen to increase resistance against water loss.
Identification of parallel local adaptation and climate‐associated CHC profiles
To identify patterns of parallel local adaptation as well as putative CHC candidates involved in climate adaptation, we investigated whether overlapping SNPs or genes could be found between species or analyses. We found one gene, a reverse transcriptase, to be significantly differentiated among populations of both species. Whether this indicates parallel local adaptation is hard to tell, because in eukaryotic genomes, reverse transcriptases belong to the enzymatic machinery of retrotransposons as well as retroviruses (Baltimore, 1970; Temin & Mizutani, 1970). The overlapping signal of significant differentiation in this reverse transcriptase could thus result from a shared (local) retrovirus infection in both species (Svarovskaia et al., 2003), ancestral polymorphisms (Han et al., 2017) or, and least plausible, a signature of parallel local adaptation. Nevertheless, in other ants, mobile elements have been implicated in adaptation to novel environments (Schrader et al., 2014). The degree of parallelism, as measured with Jcorr, increased with the level of biological organization and was highest, although still low, on the level of significantly differentiated windows (Table 5). Taken together, this indicates that although C. levior A and B are subject to largely similar local selection regimes, the genomic footprint of adaptation mostly involves species‐specific genes and functions, but on the other hand, seems to rely on a small number of shared genomic regions (~13%). The seeming discrepancy between these two observations might be explained by linkage, but also the fact that a single trait is often polygenic (Barghi et al., 2019; Rivas et al., 2018). In cases of such genetic redundancy (Barghi et al., 2019), selection can thus act on different genes and even biological pathways, leading to the same adaptive value. In general, genes that contribute to a polygenic trait are linked and located within short distances (Price, 2006; Wellenreuther & Hansson, 2016), which might explain an overlap on a level of genomic regions rather than on a level of single genes.
We found no overlap in SNPs or genes between the two species in either association analysis. Also, a GO enrichment analysis yielded no overlap between the two species in significantly enriched GO terms within both chemical and environmental association analyses. One of the GO terms we found most often was ‘sensory perception of smell’. Even though this term was only significantly enriched in the CAA in C. levior A, we also found genes associated with this term in the CAA in C. levior B, and in the EAA in C. levior A, which is further underlining the importance of CHCs in climate adaptation and the following changes in CHC perception.
Studies that modelled the probability of genome‐wide parallel evolutionary changes predicted high likelihoods under completely parallel natural selection (Thompson et al., 2019). Similar selection pressures were mirrored in parallel genomic changes in other systems such as sticklebacks (e.g., Colosimo et al., 2005; Haenel et al., 2019), Timema stick insects (Soria‐Carrasco et al., 2014), Lycaeides butterflies (Chaturvedi et al., 2018) and rails (Hume & Martill, 2019). In our system, C. levior A and C. levior B co‐occur throughout their distribution range in French Guiana and are therefore subject to the same local and climate selection pressures. They furthermore share the same direct ancestor and thus the same evolutionary background. Still, we found no overlap between species neither in SNPs, genes nor significantly enriched GO terms that are implicated in local or climate adaptation. This is in line with other studies, which found limited evidence for parallelism but instead revealed species‐specific trajectories (Dennis et al., 2015; Feldmeyer et al., 2017; Pfenninger et al., 2015). In our system, adaptation to the same ecological and climate factors seem to be facilitated by different genes and functions that lead to the same adaptive value (Manceau et al., 2010). This pattern has also been found in Drosophila as a response to temperature (Barghi et al., 2019) or high altitude (Bastide et al., 2016).
The between species comparisons, based on outliers identified within species did not give evidence for selection on CHC profile differences between the species. We thus additionally looked for SNPs within genes with a known function in CHC synthesis, namely elongases and desaturases, that were fixed in one species, but showed varying allele frequencies between the populations of the other species. These genes could potentially serve as candidate genes to explain, at least in part, the vast interspecific differences in CHC profiles.
Within species, we found a single gene, the odorant receptor 22c, associated with both the environmental and chemical association analyses in C. levior A. The SNPs within this gene, associated with either environment or CHCs respectively, however, do not overlap. In D. melanogaster, this receptor is specifically expressed in larvae (Störtkuhl & Fiala, 2011). In social insects, odorant receptors are generally responsible for the perception of cuticular hydrocarbons (Brand et al., 2015; Pask et al., 2017; Slone et al., 2017). This might therefore indicate that populations within C. levior A experience different environmental selection pressures, that affect the CHC profile as a response to climate adaptation, and that in turn triggered a change in the genes responsible for the perception of CHCs. Even though colony‐specific CHC profiles correlate with environment, the genomic footprints underlying CHCs and environmental adaptation do not overlap except for this one odorant receptor. Reasons for this might either be that CHC profiles are plastic and thus possess no obvious population genomic signatures or that the overlapping signatures are lost in functional redundancy.
CONCLUSION
This is the first genome‐wide association study in ants and, to our knowledge, the first study linking cuticular hydrocarbon diversity to allele frequency differences. In a multi‐dimensional genomic association approach, we identified genomic signatures of local climate adaptation, as well as potential candidate genes underlying CHC synthesis and detection in the two cryptic ant species C. levior A and C. levior B. Many of the genes that are associated with variation in CHC profiles have already been implicated in serving functions in the detection or synthesis of CHCs in other species and can thus be taken as proof of principle that CHC association analyses can yield interesting candidate genes underlying chemical communication.
The question whether evolution is repeatable is crucial to understand the mechanisms of ecological adaptation. We tested repeatability and parallelism between C. levior A and B on different levels of hierarchy. The overall degree of parallelism was very low (and non‐existent on the level of SNPs) but increased with the level of biological organization. Using a multi‐factor approach, this study thus contributes to the growing evidence for an often rather idiosyncratically acting evolution (Feldmeyer et al., 2017; Goedbloed et al., 2017; Kaeuffer et al., 2011; Pfenninger et al., 2015).
ACKNOWLEDGMENTS
We thank Aidin Niamir for his helpful advice regarding climate data analysis, and two anonymous reviewers for their helpful comments on the manuscript. This work was supported by the German Science Foundation (DFG) via grants to BF (FE 1333/7‐1), TS (SCHM2645/7‐1) and FM (ME 3842/5‐1 and ME 3842/6‐1). This work was additionally supported by the LOEWE Centre Translational Biodiversity Genomics (TBG), funded by the state of Hesse, Germany. This study is compliant with the Nagoya protocol (permission number: TREL1734890A/13). Open Access funding enabled and organized by ProjektDEAL
CONFLICT OF INTEREST
The authors have no conflict of interest to declare.
AUTHOR'S CONTRIBUTION
BF, FM and MP conceived the study. JH, BF, FM and PPS conducted the sampling. JH generated and analysed the data. BF, MP and AMW contributed to data analysis. JH, BF, AMW, PPS, FM, TS and MP drafted the manuscript. All authors read and approved the final version of the manuscript.
Peer Review
The peer review history for this article is available at https://publons.com/publon/10.1111/jeb.13742.
DATA AVAILABILITY STATEMENT
The generated read data sets and mapped reads are available at the European Nucleotide Archive (ENA) under the accession number PRJEB41067.
