


Abstract
The amphi‐boreal faunal element comprises closely related species and conspecific populations with vicarious distributions in the North Atlantic and North Pacific basins. It originated from an initial trans‐Arctic dispersal in the Pliocene after the first opening of the Bering Strait, and subsequent inter‐oceanic vicariance through the Pleistocene when the passage through the Arctic was severed by glaciations and low sea levels. Opportunities for further trans‐Arctic dispersal have risen at times, however, and molecular data now expose more complex patterns of inter‐oceanic affinities and dispersal histories. For a general view on the trans‐Arctic dynamics and of the roles of potential dispersal–vicariance cycles in generating systematic diversity, we produced new phylogeographic data sets for amphi‐boreal taxa in 21 genera of invertebrates and vertebrates, and combined them with similar published data sets of mitochondrial coding gene variation, adding up to 89 inter‐oceanic comparisons involving molluscs, crustaceans, echinoderms, polychaetes, fishes and mammals. Only 39% of the cases correspond to a simple history of Pliocene divergence; in most taxonomical groups, the range of divergence estimates implies connections through the entire Pliocene–Pleistocene–Holocene time frame. Repeated inter‐oceanic exchange was inferred for 23 taxa, and the latest connection was usually post‐glacial. Such repeated invasions have usually led to secondary contacts and occasionally to widespread hybridization between the different invasion waves. Late‐ or post‐glacial exchange was inferred in 46% of the taxa, stressing the importance of the relatively recent invasions to the current diversity in the North Atlantic. Individual taxa also showed complex idiosyncratic patterns and histories, and several instances of cryptic speciation were recognized. In contrast to a simple inter‐oceanic vicariance scenario underlying amphi‐boreal speciation, the data expose complex patterns of reinvasion and reticulation that complicate the interpretation of taxon boundaries in the region.
INTRODUCTION
The North Atlantic and North Pacific Oceans share a remarkable biogeographical element known as the amphi‐boreal biota. The similarity between the inter‐oceanic sister taxa or populations is related to the past dispersal through the Bering Strait and across the intervening Arctic basin (Durham & MacNeil, 1967). The route is currently mostly impassable for boreal taxa, and is thought to have been so most of the Pleistocene–Holocene time frame. This has enabled an accumulation of genetic and systematic differences between the two basins (Miller et al., 2010). Such differences, tracing back to pre‐Pleistocene times, are often reflected in morphological characters but may also remain cryptic (typically in invertebrates). Nevertheless, the trans‐Arctic connection could still have functioned intermittently also later during recurring Pleistocene interglacials and associated transgressions. Instead of simple vicariance, the diversity could have been moulded by cycles of vicariance and dispersal between the oceans. Moreover, now and in the future we may expect that the opportunities for trans‐Arctic dispersal will again be enhanced, to an unprecedented extent, by the warming climate and increasing Arctic shipping (e.g. Vermeij and Roopnarine 2008).
In terms of systematic and genomic diversification, such isolation–invasion cycles, which involve allopatric accumulation of differences, secondary contacts, creation of reproductive barriers and/or mixing of diverged genomic origins, could have been critical for driving the speciation process and organizing the diversity needed for adaptation in boreal marine organisms. Several case studies on molecular variation have so far explored instances of the trans‐Arctic dynamics in amphi‐boreal taxa, particularly in terms of mitochondrial phylogeography (e.g. Collins, Frazer, Palmer, Vermeij, & Brown, 1996; Coulson, Marshall, Pepin, & Carr, 2006; Laakkonen, Lajus, Strelkov, & Väinölä, 2013; Laakkonen, Strelkov, & Väinölä, 2015; Nikula, Strelkov, & Väinölä, 2007; Rawson & Harper, 2009, Bringloe & Saunders 2019). Also, Loeza‐Quintana et al. (2019) assessed inter‐oceanic molecular barcoding data, demonstrating broad variation in divergence estimates, while not touching on the case‐wise geographical patterns.
In this study, we aim to provide an overview of the dynamics of inter‐oceanic trans‐Arctic dispersal and gene flow in the time frame spanning from the initial Pliocene interchange that first brought about the amphi‐oceanic vicariance pattern to the post‐glacial period. This is done in terms of data on diversity of molecular lineages set in a geographical and temporal context. To assess an as broad as possible sample of organisms from different animal groups, we introduce a new multi‐taxon mitochondrial data set from 21 amphi‐boreal taxa (genera), and combine it with comparable published data mined from literature and databases. We will compile and classify the patterns of divergence and lineage distribution and the inferred patterns of dispersal history. We are particularly searching for instances where dispersal events occurred repeatedly within a certain genus or species complex and thus created opportunities for co‐occupation or interaction of distinct lineages within an ocean basin. Where relatively recent connections among the basins are recognized from the genetic data, we further describe the phylogeography and address the evidence of (post‐glacial) dispersal using coalescence simulations.
There is rich literature on the climatic and palaeogeographical history of the trans‐Arctic route, partly based on the fossil record relevant to the invasion hypotheses (e.g. Briggs, 1995; Keigwin, Donnelly, Cook, Driscoll, & Brigham‐Grette, 2006; MacNeil, 1965). A general timeline for a background of the discussion involves the following: (a) until the initial opening of the Bering Strait in the Late Miocene, the biotas of the northernmost Pacific and Atlantic Oceans developed independently in isolation for over 20 My (Marincovich, 1993). The current Arctic basin and its fauna made an extension of the North Atlantic. (b) The first submergence of the Bering Strait 5.5–5.0 My ago created an inter‐oceanic connection to the Pacific. Initially, the main current and exchange though the Strait was towards the Pacific (e.g. Marincovich & Gladenkov, 2001; Gladenkov, Oleinik, Marincovich, & Barinov, 2002). (c) Later, the currents were reversed setting the stage for the most prominent trans‐Arctic dispersal event, the Great Trans‐Arctic Interchange (GTAI). Judged from fossils, the modal interchange took place in the middle of Pliocene ca 3.5 My ago, and was predominantly in the Pacific‐to‐Atlantic direction. Some 55% of the extant North Atlantic boreal–temperate mollusc taxa are of Pacific origin (Briggs, 2003; Durham & MacNeil, 1967; Vermeij, 1991, 2005). (d) The climate cooled down gradually towards the end of the Pliocene, 3.5–2.4 My ago (Flesche, Jansen, Fronval, & Smith, 2002). (e) Through the Pleistocene, opportunities for dispersal became ever rarer, due to the intermittent closure of the Strait and the severe Arctic climate even during the interglacials (comparable to the current situation). The more or less regular glacial–interglacial cycles of the Pleistocene were associated with sea‐level changes, and the cycles intensified at the end of the Early Pleistocene ca 0.9 My ago. (f) Nevertheless, there is also evidence of a number of higher sea stands both during the Early Pleistocene >2 My ago and in the Middle Pleistocene (Miller et al., 2010). One such was the Marine Isotope Stage MIS 11 ca 400 ky ago, which was longer than typical interglacials (ca 30 ky instead of 10 ky), and showed higher sea levels than ever since (cf. Olson & Hearty, 2009). (g) During the last interglacial LIG (=MIS 5e, 130‒110 ky ago), Arctic summer temperatures could have been of 4–5°C above the present temperatures and the ocean occasionally free of ice. (h) Following LIG, the Bering Strait opened again only 13–11 ky ago, after the Last Glacial Maximum (LGM), re‐enabling exchange between the Pacific and Atlantic Oceans (e.g. Kaufman et al. 2004, Anderson et al., 2006).
MATERIALS AND METHODS
New samples and sequencing
We produced new broad‐scale phylogeographic data sets by targeted sampling in 21 common amphi‐boreal and circum–arctic–boreal taxa (genera), including nine vertebrates and twelve invertebrates. We aimed at sampling each of the four boreal continental margins (NW Pacific, NE Pacific, NW Atlantic and NE Atlantic), whereas in practice, the whole range could not always be covered. For several taxa, samples from the Bering Strait and adjacent Beaufort and Chukchi seas in the Arctic were included. The vertebrates included amphi‐oceanic sister taxa of the fish genera Eleginus, Gasterosteus, Liopsetta, Lumpenus, Myoxocephalus (scorpius), Limanda, Platichthys and Zoarces, apart from Clupea (from Laakkonen et al., 2013), as well as amphi‐oceanic data of the ringed seal Phoca hispida. The invertebrates included the bivalves Macoma calcarea, Modiolus modiolus and Turtonia minuta (and Hiatella from Laakkonen, Strelkov, & Väinölä, 2015), the nudibranch gastropod Aeolidia papillosa, echinoderm Echinarachnius parma and priapulid worm Priapulus caudatus. New crustacean data sets come from the barnacles Balanus crenatus and Semibalanus balanoides, the amphipod Gammarus setosus, inter‐oceanic taxa of the mysid genus Neomysis and the northern shrimp Pandalus borealis (Table 1). For several taxa, the data were supplemented by parallelly published sequences from others’ studies. We also expanded previous phylogeographic studies with samples from additional regions, including new material of the green sea urchin Strongylocentrotus droebachiensis (NE Europe and NW Pacific), the scale worm Harmothoe imbricata (NW Pacific) and the mussel Mytilus trossulus (NW Pacific, NE Atlantic). The collection information can be found in Table S1, details of molecular analysis in Appendix S1 and of sequence deposition in Table S1. The data comprise sequences of the mitochondrial COI‐5P fragment (526–657 bp) for invertebrates, and partial cytochrome b gene (599–1,104 bp) for vertebrates, in total c. 1,700 sequences from 218 populations representing 25 genera across the boreal coasts.
List of amphi‐oceanic boreal–arctic taxa included in the study, and the distributional and phylogeographic patterns identified. Only clades where the common ancestor is considered to post‐date the opening of the Bering Strait are included. When more than one nominal species is involved in a basin, the taxon that is ‘original’ in the given ocean basin is indicated. A refers to an arctic–boreal taxon, whose distribution is not necessarily discontinuous through the Arctic basin. In each taxon (genus), the different species and deep phylogeographic lineages (plausibly >150 ky old) are identified by the numerals 1, 2, …, and their presence in five biogeographical regions is indicated in the middle panel. Brackets mark assumed human‐mediated invasion. Lineages of putative late‐ and post‐glacial age (<130 ky) are referred to with the same numeral. Additionally, an inferred trans‐arctic contact of such lineages is indicated with a + (e.g. 1+ indicates a post‐glacial reinvasion of a late‐glacial sister lineage to the region indicated). Intra‐oceanic late‐glacial phenomena are not considered. Data references for previously published data are listed in Table S2
| Amphi‐boreal and boreal–arctic taxa | Distribution of lineages | Pattern | Data references | |||||
| Pacific Ocean | Atlantic Ocean | NWP | NEP | Bering/ Chukchi–Beaufort | NWA | NEA | ||
| Molluscs: Bivalves | ||||||||
| Hiatella sp. LA | Hiatella sp. KA | 1 | 1 | 1 | 1+ | 2 | b c d | Laakkonen, Strelkov, and Väinölä (2015) |
| Limecola balthica/ L. petalum | L. balthica/ L. petalum | 1 | 1b(4) | 1 | 2 4 | 1 3 | b c d | Nikula et al. (2007) |
| Macoma calcarea A | M. calcarea A | 1 | 1 | 1 | 1b | 1 | d | This study, Layton et al. (2014) |
| Modiolus modiolus | M. modiolus | 1 2 | 2 | 3 | 3 | a | Halanych et al., 2013, this study | |
| Mytilus trossulus | M. edulis | 1 | 1 | 1 2 | 1 2 | b c d | Marko et al. (2010), this study | |
| Turtonia minuta | T. minuta | 1 | 2 | ? | 3 | a | This study | |
| Molluscs: Gastropods | ||||||||
| Acanthodoris atrogriseata/pilosa | A. pilosa | ? | 1 2 | 2 | 2 | b c d | BOLD | |
| Aeolidia papillosa | A. papillosa | 1 | 1 2 | 1 | 1 3 | b c | Carmona et al., (2013), this study | |
| Alderia modesta | A. modesta | 1 | 1 | ? | 2 | a | Ellingson and Krug (2006) | |
| Ariadnaria insignis | A. borealis | ? | 1 | ? | 2 | a | BOLD | |
| Dendronotus dalli | D. niveus | 1 | 1 | 2 | 2 | a | Ekimova et al. (2015), Leray, Paulay & Mulcahy (2019), Valdés et al. (2017) | |
| Dendronotus kamchaticus | D. lacteus | 1 | 1 | ? | 2 | a | Ekimova et al. (2015), Ekimova et al. (2016), Korshunova et al. (2016), Pola & Gosliner (2010), Korshunova et al. (2017) | |
| Dendronotus venustus | D. frondosus | 1 2 | 2 | ??d | Dewaard (2017), Korshunova et al. (2019), Pola & Gosliner (2010), Ekimova et al. (2016) | |||
| Doris montereyensis | D. pseudoargus | ? | 1 | ? | 2 | a | BOLD | |
| Flabellina trophina/fusca | F. gracilis | 1 | 1 | ? | 2 | a | Shields (2009), Korshunova et al. (2017), BOLD | |
| Lacuna vincta | L. vincta | 1 | 2 | 2b | a1 | Leray & Paulay GenBank MH242817, Layton, Martel & Hebert (2014), Castelin et al. (2016), BOLD | ||
| Limacina helicina | L. helicina | 1 | 1 | ? | 1 | 1 | d | Abyzova et al. (2018), Chichvarkhin (2016), Shimizu et al. (2017), Hunt et al. (2010), Layton, Martel & Hebert (2014), Jennings et al. (2010) |
| Littorina aleutica | L. obtusata | 1 | 2 | a | Reid, (1990), Wares and Cunningham (2001), Reid et al. (2012) | |||
| Littorina squalida | L. littorea | 1 | 1 | 1 | 2 | 2 | a | Reid, (1990), Giribet et al. (2006), Reid et al. (2012), Layton et al. (2014) |
| Nucella heysiana | N. lapillus | 1 | 2 | 2 | a | Collins et al. (1996), Wares and Cunningham (2001), Marko et al. (2014) | ||
| Onchidoris muricata | O. muricata | 1 | 1 | 2 | 2 | a1 | Hallas & Gosliner (2015), Martynov & Korshunova (2017), Chichvarkhin et al. (2018), BOLD | |
| Velutina velutina | V. velutina | ? | 1 | 1 | 1 | d | BOLD | |
| Crustaceans | ||||||||
| Balanus crenatus | B. crenatus | 1 2 | 1 2 | 2 | 2+ | 2 | b c d | This study |
| Calliopius laeviusculus | C. laeviusculus | 1 | ? | 2 | 3 | a | This study, Radulovici et al. (2009) | |
| Centropages abdominalis | C. abdominalis | 1 | 1 | 1 | d | Young (2016), Sun, Wang & Liu (2008), BOLD | ||
| Eusergestes similis | E. articus | ? | 1 | 2 | 2 | a | BOLD | |
| Evadne nordmanni | E. nordmanni | 2 | 1 | 1 | a | Durbin et al. (2008) | ||
| Gammarus setosus A | G. setosus A | 1 2 | 1 | ? | 2+ | 2+ | b c d | This study |
| Neomysis awatschensis | N. americana/integer | 1 | 1 | 2 | 3 | a | This study, Radulovici et al. (2009), Remerie et al. (2009) | |
| Pandalus borealis | P. borealis | 1 | 1 | 1+ | 1 | 1 | e | This study, Steinke: BOLD, Radulovici et al (2009) |
| Pleopsis polyphaemoides | P. polyphaemoides | 2 (1) | 1 | a ? | Durbin et al. (2008) | |||
| Podon leuckartii | P. leuckartii | 2 (1) | ? | 1 | 1 | a1 | Durbin et al. (2008) | |
| Pseudocalanus moultoni | P. moultoni | 1 | 2 | 2 | a1 | Aarbakke et al. (2011), Laakmann et al. (2013), Young (2016), BOLD a | ||
| Semibalanus balanoides | S. balanoides | 1 | 1 | 2 | 2 | a | This study, Wares and Cunningham (2001), Wares et al. (2009) | |
| Tortanus discaudatus | T. discaudatus | 1 | 2 | a | Young (2016), BOLD a | |||
| Echinodems | ||||||||
| Asterias amurensis | A. rubens, A. forbesi | 1 | 2 (3) | 3 | a | Wares (2001), Matsubara et al. (2005) | ||
| Crossaster papposus | C. papposus | 1 | 2 | a1 | Corstorphine (2010) | |||
| Echinarachnius parma | E. parma | 1 | 1 | 1+ | d | This study | ||
| Henricia cf. oculata | H. cf. oculata | 1 | 1 | d | Corstorphine (2010) | |||
| Henricia sp. EAC06 | Henricia sp. EAC06 | 1 | 1 | d | Corstorphine (2010) | |||
| Henricia sp. AAB9183 | Henricia sp. AAD3482 | ? | 1 | 1 2 | b c d | Layton, Corstorphine & Hebert (2016) | ||
| Pteraster militaris | P. militaris | 1 | 2 | a1 | Corstorphine (2010) | |||
| Solaster endeca | S. endeca | 1 | 2 | a1 | Corstorphine (2010) | |||
| Strongylocentrotus droebachiensis | S. droebachiensis | 1 | 1+ | 1+ | 1 | b c d | Addison and Hart (2005), this study | |
| Strongylocentrotus pallidus | S. pallidus | 1 | 1 | 1 | 1 | 1 | d | Corstophine (2010), Hardy et al. (2011) |
| Polychaetes | ||||||||
| Alitta virens | A. virens | 1 | 2 | ? | a | Carr, Hardy, Brown, Macdonald, and Hebert (2011) | ||
| Glycera capitata A | G. capitata A | 1 Ber | 1 | 1 | d | Carr et al. (2011) | ||
| Harmothoe imbricata groupA | H. imbricata groupA | 7 | 1 4 | 1 5 | 1 2 3 5 | 2 3 | b c d | Carr et al. (2011), Hardy et al. (2011) |
| Harmothoe rarispina groupA | H. rarispina group A | 1 2 | 1 | 1 | ? | b c d | Carr et al. (2011), BOLD | |
| Hediste atoka | H. diversicolor | 1 | 2 3 | a | Audzijonyte et al. (2008), Tosuji & Sato (2010) | |||
| Lepidonotus squamatus CMC02 | L. squamatus CMC01 | 1 | 2 | a | Carr et al. (2011), Hardy et al. (2011) | |||
| Myxicola infundibulum CMC02 | M. infundibulum CMC01 | 1 | 2 | a | Carr et al. (2011) | |||
| Nereis pelagica CMC01, CMC03A | N. pelagica CMC02, CMC03A | 1 | 3 | 2 3 | 2 | b c d | Carr et al. (2011), Hardy et al. (2011), BOLD | |
| Nothria conchylega CMC01A | N. conchylega CMC02 | 1 | 2 | a | Carr et al. (2011) | |||
| Pectinaria granulata CMC01 | P. granulata CMC02 A | 1 | 2 | a | Carr et al. (2011) | |||
| Pholoe baltica A | P. baltica A | 1 Ber | 1 | ? | d | Carr et al. (2011) | ||
| Pholoe minuta A | P. minuta A | 1 Ber | 1 | d | Carr et al. (2011) | |||
| Phyllodoce sp. CMC01A | P. sp. CMC01A | 1 Ber | 1 | d | Carr et al. (2011) | |||
| Priapulida | ||||||||
| Priapulus cf. caudatus | P. caudatus sp. 1 | 1 | 2 | 3 | 3 | 2 3 4 | b d | This study |
| Fishes | ||||||||
| Anisarchus medius A | A. medius A | ? | ? | 1 | 1 | ? | e | Mecklenburg et al. (2011) |
| Aspidophoroides monopterygius | A. olrikii | 1b 2b | 1b 2b | 1 2 | 1 2 | 2b | b c d | Mecklenburg et al. (2011) |
| Clupea pallasii | C. harengus | 1 | 1 | 1 | 2 | 1 2 | b c d | Laakkonen et al. (2013) |
| Eleginus nawaga | E. gracilis | 1 | 1b | 1 | 2 | a | This study | |
| Eumesogrammus praecisusA | E. praecisusA | 1a | 1a | 1+ | 1+ | e | Mecklenburg et al. (2011) | |
| Gadus chalcogrammus (finnmarchicus) | G. morhua | 1 | 1 | 1 | 2 | 1 2 | b c d | Ursvik et al. (2007), Gorbachev et al. (2014) |
| Gadus macrocephalus (ogac) | G. morhua | 1 | 1 | 1 | 1 2 | 2 | b c d | Coulson et al. (2006) |
| Gasterosteus aculeatus | G. aculeatus | 1 | 1 2 | 1 2 | 3+ | 3+ | a1 | Ortí et al. (1994), Mäkinen & Merilä (2008), Lescak et al. (2015), this study |
| Glyptocephalus stelleri | G. cynoglossus | 1 | 2 | 3 | a | Vinnikov, Thomson & Munroe (2018), Kartavtsev et al. (2016), Noren et al. (2009) | ||
| Gymnocanthus spp. | G. tricuspis | 12345 | 1a 2a | 123456 | 4a | 4a | b c d | Yamazaki et al. (2013) |
| Hippoglossoides dubius / robustus | H. platessoides | 1 | 2 | 2 | a | Vinnikov et al. (2018), Noren et al. (2009) | ||
| Hippoglossoides robustus | H. platessoides | 1 | 1 | 1 | 2 | 2+ | a | BOLD |
| Hippoglossus stenolepis | H. hippoglossus | 1 | 1 | 1b | 2 | 2 | a | Sanjuan & Comesaña (2002), Espineira et al. (2008), Mjelle et al. (2008), Mecklenburg et al. (2011) |
| Leptagonus decagonus A | L. decagonus A | 1a | 1+ | 1 | 1 | e | McCusker et al. (2012), BOLD | |
| Leptoclinus maculatusA | L. maculatusA | 1 | 1a | 1+ | 1 | 1 | e | Mecklenburg et al. (2011) |
| Limanda aspera | L. limanda | 1 | 1 | 1 | 2 | a | This study | |
| Liopsetta pinnifasciata A | L. glacialis A | 1 + 2 | ? | 1 2 | b c d | This study, Kartavtsev et al. (2014) | ||
| Lumpenus fabricii | L. lampretaeformis | ? | ? | 1 Ber | ?/2 | 2 1 | b c | This study, Mecklenburg et al. (2011) |
| Mallotus villosus A | M. villosus g A | 1 | 2 | 1 | 1 3 | 4 | b c d | Dodson et al. (2007) |
| Megalocottus platycephalus | Myoxocephalus quadricornis | 1 | 1a | 1 2a | 2 | 2 | a | Kontula & Väinölä (2003), Podlesnykh & Moreva (2014) |
| Myoxocephalus stelleri + others | M. scorpius A | 1? | 1 2a | 1 2 | 2+ | 2+ | b c d | This study, Mecklenburg et al. (2011) |
| Osmerus dentex | O. dentex | 1 | 1a | 1 | 1 | d | Skurikhina et al. (2013) | |
| Pholis laeta | P. gunnellus | 1 | 1 | 1 | 2 | 2 | a | Steinke et al. (2009) |
| Platichthys stellatus | P. flesus | 1 | 1 | 1 | 2 | a | This study | |
| Pleuronectes quadrituberculatus | P. platessa | ? | ? | 1 | 2 | a | Vinnikov, Thomson & Munroe (2018), Kartavtsev et al. (2016) | |
| Pungitius pungitius | P. pungitius | 1 | 2 | 2 | 2+ | 2 | a1 | Shikano et al. (2010), Mecklenburg et al. (2011) |
| Reinhardtius hippoglossoidesA | R.. hippoglossoides A | 1b | 1b | 1 Ber‐Chu | 1 | 1 | d | Vis et al. (1997), Mecklenburg et al. (2011), Kartavtsev et al. (2014) |
| Zoarces fedorovi | Z. viviparus | 1 | 2 | a1 | This study | |||
| Mammals (seals) | ||||||||
| Pusa hispida ochotensis A | P. h. hispida A/ladogensis | 1 | 1 | 1 | 1 | d | This study | |
| Phoca vitulina | P. largha | 12 | 1a2 | 1 | 2a | 2 | b c | Nakagawa et al. (2010), Stanley et. al (1996) |
NEP, Northeast Pacific; NWP, Northwest Pacific; NEA, Northeast Atlantic; NWA, Northwest Atlantic.
Samples from the Bering Strait region ‘Ber’ are included in the Chukchi column:
Classification of inferred biogeographical patterns (Figure 2):
a) long vicariant histories (descending from the Pliocene–Early Pleistocene)
a1) more recent vicariant histories (descending from the Middle Pleistocene, 1–0.2 Myr).
b) minimum of two distinct trans‐Arctic divergence events.
c) possible secondary contact following repeated trans‐Arctic dispersal.
d) incomplete lineage sorting or close relationship, interpreted as post‐ or late‐glacial dispersal.
e) hypothesized post‐glacial Arctic contact following short vicariance (e.g. late‐glacial).
?—Presence of the taxon, but without genetic assignment.
Absence of genetic data (but presence of the morphologically identified species).
Inference based on unpublished data or on indirect evidence (not critical for the conclusions).
Data mining
Comparable data sets involving inter‐oceanic contrasts were assembled from the published literature and the international sequence databases (GenBank, BOLD), focusing on the most commonly used coding gene markers, that is fragments of COI and COIII (cytochrome oxidase III) sequence for invertebrates, and of cytb and COI for vertebrates. We included genera with typically boreal–arctic distributions where the basal hypothetically trans‐Arctic divergence estimate would fit the time frame since the opening of the Bering Strait ca 5.5 My ago, in the light of the rate considerations below. The first comprehensive data compilation was in 2015, and the most relevant newer studies were added in 2019 (references in Table S2). The final set of comparisons (Table 1) comprised trans‐Arctic complexes of altogether 22 molluscs, 13 crustaceans, 10 echinoderms, 14 ‘worms’ (polychaetes and one priapulid), 28 fishes and two seals. It may be noted that although Loeza‐Quintana et al. (2019) similarly mined BOLD (2019) data to address timescales of trans‐Arctic divergence, the resulting data sets are largely different due to the different criteria for data inclusion.
Molecular and evolutionary divergence
Protein‐coding mitochondrial genes are so far the most universally available characters that can be thought to exhibit somehow steady accumulation of mutations. They also evolve fast enough to be informative on the Quaternary timescales relevant to this study. At the same time, there are known caveats, stemming from the liability of mtDNA to introgression and selective sweeps, and consequently to phylogeographic misinterpretation (Dowling, Friberg, & Lindell, 2008; Gillespie, 2000). Although mtDNA distances have routinely been used as a surrogate of divergence time, no universal or universally accepted molecular clock rate can be provided. Yet, although the mtDNA rates can vary widely among groups of organisms (e.g. Galtier, Nabholz, Glémin, & Hurst, 2009), the concept of relatively uniform mtDNA rate within a certain group (class, or phylum) is still broadly applied, and for operational reasons, we adopted this concept, treating our data in taxonomic partitions of Table 1 (further on caveats, see Appendix S2).
To provide initial rates for the discussion of the timescale, we used a conventional approach by choosing a representative vicarious taxon pair whose divergence has been dated to the Pliocene GTAI by a fossil record or other inferences from the literature, and setting the TN + Γ model distance (next section) between them at 3.5 My. This approach and operational rates have been regularly used in previous trans‐Arctic studies, whereas Loeza‐Quintana and Adamowicz (2018), Loeza‐Quintana et al. (2019) recently applied another procedure based on minimizing improbable estimates. Our reference taxa (see Table 2) included the clupeid fishes Clupea pallasii versus C. harengus (see Laakkonen et al., 2013), the bivalves Mytilus trossulus versus M. edulis (Vermeij, 1991), the gastropods Littorina squalida versus L. littorea (Gladenkov, Norton, & Spaink, 1980; Reid, 1990), the echinoderms Asterias amurensis versus A. rubens (Vermeij, 1991; Wares, 2001; Worley & Franz, 1983), and the crustaceans Neomysis awatschensis versus N. integer and polychaetes Hediste atoka versus H. diversicolor. The latter two references are not based on a fossil record, but they both represent temperate–boreal genera where a complex of Pacific taxa is contrasted by a single (native) taxon on either one or both coasts of the Atlantic, a pattern analogous to those in many conventional amphi‐boreal genera (Mees, 2015; Sato & Nakashima, 2003). For Limecola balthica (=Macoma balthica), for which COIII data were uniquely used, the rate was adjusted for the fact that the TN + Γ model distances are approximately twice higher for COIII than COI in a small reference data set (cf. Nikula et al., 2007, Table 2). The rate from Palo and Väinölä (2006) was used for the seals.
Molecular divergence estimates for vicarious amphi‐boreal pairs of taxa, and tentative group‐specific rates
| Taxon pair | Locus | bp | n Pac | n Atl | TN+Г net divergence (%) | “Age” (“My”) | Div. rate (% My−1 ) |
| Bivalves | |||||||
| Hiatella K / Hiatella L | COI | 653 | 71 | 175 | 34.11 | 3.08 | |
| Hiatella L | COI | 654 | 59 | 48 | 0.98 | 0.09 | |
| Modiolus modiolus | COI | 603 | 46 | 147 | 17.21 | 1.56 | |
| Mytilus trossulus / M. edulis | COI | 453 | 138 | 59 | 38.71 | 3.50 | 11.06 |
| Limecola b. balthica D / L. b.b. C | COIII | 594 | 26 | 18 | 5.93 | 0.27 | |
| Limecola b. balthica / L. b. rubra | COIII | 594 | 26 | 55 | 16.27 | 0.74 | |
| Limecola balthica / L. petalum | COIII | 594 | 26 | 5 | 33.57 | 1.52 | |
| Turtonia minuta | COI | 657 | 30 | 60 | 11.91 | 1.08 | |
| Gastropods | |||||||
| Acanthodoris atrogriseata/pilosa / A. pilosa | COI | 575 | 8 | 15 | 6.17 | 1.00 | |
| Aeolidia papillosa | COI | 589 | 12 | 42 | 1.51 | 0.25 | |
| Aeolidia papillosa / Aeolidia sp. | COI | 589 | 12 | 11 | 22.78 | 3.73 | |
| Alderia modesta a | COI | 480 | 7 | 104 | 24.15 | 3.96 | |
| Ariadnaria insignis / A. borealis | COI | 631 | 8 | 2 | 39.71 | 6.47 | |
| Dendronotus dalli / D. niveus | COI | 515 | 5 | 9 | 12.20 | 1.99 | |
| Dendronotus kamchaticus / D. lacteus | COI | 641 | 7 | 15 | 16.71 | 2.72 | |
| Doris montereyensis / D. pseudoargus | COI | 644 | 17 | 7 | 28.33 | 4.61 | |
| Flabellina trophina + fusca / F.gracilis | COI | 570 | 3 | 5 | 20.00 | 3.26 | |
| Lacuna vincta | COI | 606 | 6 | 12 | 0.82 | 0.13 | |
| Littorina aleutica / L. obtusata | COI | 567 | 1 | 78 | 8.74 | 1.43 | |
| Littorina squalida / L. littorea | COI | 582 | 1 | 4 | 21.49 | 3.50 | 6.14 |
| Nucella heyseana / N. lapillus | COI | 471 | 35 | 61 | 8.90 | 1.46 | |
| Onchidoris muricata | COI | 591 | 9 | 6 | 1.06 | 0.17 | |
| Crustaceans | |||||||
| Balanus crenatus | COI | 656 | 24 | 9 | 1.66 | 0.39 | |
| Calliopius laeviusculus | COI | 612 | 1 | 32 | 8.04 | 1.87 | |
| Eusergestes similis / E. arcticus | COI | 615 | 7 | 6 | 7.72 | 1.78 | |
| Evadne nordmanni II / I | COI | 597 | 30 | 29 | 1.93 | 0.45 | |
| Gammarus setosus (Alaska/Eur) | COI | 550 | 13 | 19 | 1.48 | 0.34 | |
| Neomysis awatschensis / N. integer | COI | 526 | 16 | 140 | 15.15 | 3.50 | 4.33 |
| Pleopsis polyphaemoides (clade I / II) | COI | 606 | 4 | 22 | 8.83 | 2.05 | |
| Podon leukcartii (clade II / I) | COI | 597 | 5 | 12 | 2.81 | 0.65 | |
| Pseudocalanus moultoni | COI | 516 | 4 | 7 | 1.69 | 0.39 | |
| Semibalanus balanoides | COI | 604 | 26 | 104 | 7.52 | 1.75 | |
| Tortanus discaudatus | COI | 516 | 16 | 25 | 12.00 | 2.77 | |
| Echinoderms | |||||||
| Asterias amurensis / A. rubens | COI | 580 | 6 | 52 | 15.36 | 3.50 | 4.39 |
| Crossaster papposus | COI | 625 | 9 | 6 | 0.80 | 0.18 | |
| Henricia sp. AAB9183 / H. sp. AAD3482 | COI | 554 | 2 | 7 | 25.77 | 5.87 | |
| Pteraster militaris | COI | 612 | 3 | 7 | 1.66 | 0.38 | |
| Solaster endeca | COI | 639 | 2 | 6 | 1.29 | 0.29 | |
| Polychaetes, etc. | |||||||
| Alitta virens | COI | 617 | 2 | 41 | 36.61 | 6.10 | |
| Harmothoe rarispina CMC02 / H. sp. CMC03 | COI | 620 | 21 | 17 | 9.15 | 1.53 | |
| Harmothoe imbricata CMC01 / CMC03 | COI | 588 | 25 | 88 | 3.53 | 0.59 | |
| Hediste atoka / H. diversicolor | COI | 565 | 29 | 29 | 20.90 | 3.50 | 5.97 |
| Lepidonotus squamatus | COI | 633 | 5 | 21 | 31.68 | 5.28 | |
| Myxicola infundibulum CMC02 / CMC01 | COI | 553 | 2 | 6 | 38.16 | 6.36 | |
| Nereis pelagica | COI | 569 | 24 | 11 | 2.95 | 0.49 | |
| Nothria conchylega CMC01 / CMC02 | COI | 529 | 7 | 9 | 9.15 | 1.53 | |
| Pectinaria granulata CMC01 / CMC02 | COI | 528 | 4 | 42 | 35.31 | 5.89 | |
| Priapulus cf. caudatus (Priapulida) | COI | 553 | 15 | 14 | 18.36 | 3.08 | |
| Fishes | |||||||
| Clupea pallasii / C. harengus b | CYTB | 1,131 | 111 | 85 | 3.80 | 3.49 | 1.09 |
| Eleginus nawaga / E. gracilis b | CYTB | 986 | 79 | 30 | 2.53 | 2.32 | |
| Gadus chalcogrammus / G. morhua b | CYTB | 595 | 91 | 43 | 7.15 | 6.56 | |
| Gadus macrocephalus / G. morhua b | CYTB | 495 | 78 | 52 | 6.16 | 5.65 | |
| Gasterosteus aculeatus b | CYTB | 599 | 15 | 14 | 0.36 | 0.33 | |
| Glyptocephalus stelleri / G. cynoglossus | CYTB | 1,104 | 8 | 3 | 2.30 | 2.11 | |
| Hippoglossoides dubius + robustus / H. platessoides | CYTB | 1,104 | 11 | 7 | 3.61 | 3.31 | |
| Hippoglossoides robustus / H. platessoides b | CYTB | 1,104 | 11 | 3 | 4.00 | 3.67 | |
| Hippoglossus stenolepis / H. hippoglossus b | CYTB | 402 | 9 | 12 | 1.98 | 1.82 | |
| Limanda aspera / L. limanda b | CYTB | 986 | 41 | 36 | 3.13 | 2.87 | |
| Liopsetta glacialis b | CYTB | 986 | 7 | 2 | 2.99 | 2.74 | |
| Lumpenus fabricii / L. lampretaeformis b | CYTB | 986 | 19 | 22 | 4.76 | 4.37 | |
| Mallotus villosus NWA/NWP b | CYTB | 608 | 32 | 100 | 3.79 | 3.48 | |
| Megalocottus platycephalus / Myoxocephalus quadricornis b | CYTB | 1,043 | 7 | 6 | 4.34 | 3.98 | |
| Myoxocephalus stelleri / M. scorpius b | CYTB | 938 | 15 | 66 | 5.93 | 5.44 | |
| Platichthys stellatus / P. flesus b | CYTB | 986 | 22 | 41 | 4.80 | 4.40 | |
| Pleuronectes quadrituberculatus / P. platessa | CYTB | 899 | 6 | 11 | 3.63 | 3.33 | |
| Pungitius pungitius b | CYTB | 748 | 17 | 6 | 0.85 | 0.78 | |
| Zoarces fedorovi / Z. viviparus b | CYTB | 986 | 5 | 75 | 1.22 | 1.12 | |
The net divergence estimates were calculated for representative demographically justified clades of each taxon (e.g. one species from one coast of an ocean), and sample sizes (n) refer to the sets of sequences included in this comparison. The origin of the data sets is indicated in Table 1. The same substitution model TN+Γ, α = 0.2, was applied to all taxa, and the group‐specific divergence rates given in the last column were obtained by matching the reference taxon divergence with 3.5 My (see Methods). These rates were used to transform the distances to the age estimates, which are plotted in Fig. 1.
The COIII, uniquely used for Limecola balthica, has accumulated mutations approximately twice as fast as what was detected in the small COI data (considering TN+Γ model), and the rate was adjusted to account for the difference between the two genes.
No haplotype frequency information available, only the set of different haplotypes.
Fish taxa included in the HABC analysis.
We also evaluated the performance of the estimated rates in a broader context by comparing the profiles of sequence divergence estimates from two major Pacific–Atlantic zoogeographic events of similar age, that is the GTAI and the closure of the temperate Panamanian seaway some 3 My ago. The latter trans‐isthmian context has been widely used as a calibration standard in phylogeographic studies (Knowlton & Weigt, 1998; Lessios, 2008). The compilation of the comparable data sets and their analysis are worked out in Appendix S3.
The conversion of observed sequence differences to estimates of divergence time depends both on a nucleotide substitution model to account for saturation of multiple substitutions and on a population model to account for the variability and coalescence within the population (i.e. gene versus. population trees). Applying the modeltest procedure (jModelTest 2.1.4, Darriba, Taboada, Doallo, & Posada, 2012), we found that the Tamura–Nei model and a Γ rate heterogeneity parameter α ≈ 0.2 was the best model or among the best ones in the majority of our data sets. For simplicity, we used this model for all taxa (with taxon‐specific base frequencies), also for recalculating the estimates from the published data sets.
Estimating divergence events
The genealogical relationships of mtDNA haplotypes were first examined with neighbour‐joining trees based on TN + Γ model distances, constructed in MEGA (Tamura, Stecher, Peterson, Filipski, & Kumar, 2013). Distribution and identified genetic divisions were recorded for each taxon. For comparisons between reciprocally monophyletic inter‐oceanic lineages, also the arctic regions were included in the definition of respective oceans (i.e. the Bering, Chukchi and Beaufort seas were considered as Pacific, Arctic Canadian regions adjacent to the Atlantic as Northwest Atlantic, and arctic European regions (e.g. Svalbard) as Northeast Atlantic).
Whenever inter‐oceanic reciprocal molecular monophyly (complete lineage sorting) was inferred, lineage splits corresponding to trans‐Arctic dispersal and subsequent vicariance were inferred and nodes assigned to represent the dispersal events, based on the topology and sometimes on previous biogeographical hypotheses (e.g. ancestral areas, dispersal directions). The molecular divergence representing the split was estimated as a net distance to account for the intra‐clade variation (in MEGA, TN + Γ model). When several species or (intra‐basin) geographical clades were observed in one or both of the vicariant lineages, the comparison was made between a single subclade from each, which was supposed to represent a (historically) panmictic unit, and be representative of the intra‐lineage coalescence and useable in the net distance calculation. The MEGA files with clade designations and respective GenBank identifiers are deposited in Dryad (see Appendix S1). The geographical contact regions of the diverged lineages were recorded. The inter‐oceanic net distances were compiled and plotted against a putative timescale based on the substitution rates assumed for each of the higher taxa.
For a formal assessment of the hypothesis of simultaneous divergence between the vicariant species in different genera, we used the hierarchical approximate Bayesian computation analytical framework HABC (Beaumont, Zhang, & Balding, 2002; Hickerson & Meyer, 2008) as implemented in msBayes 20140305 (Hickerson, Stahl, & Takebayashi, 2007; Huang, Takebayashi, Qi, & Hickerson, 2011). In the first instance, the analysis was performed on a dataset of 16 inter‐oceanic comparisons of fish taxa, where a single (cytb) molecular rate can reasonably be assumed. The principle and details of the analysis are provided in Appendix S1 and Table S4. Based on the conclusive results from this data set and on a qualitative comparison between similar data sets of other major taxa where a single (but different) rate could be implied, detailed testing of the other taxa was deemed unnecessary (see Results).
Late Pleistocene or Holocene trans‐Arctic connections
When shared haplotypes were found or incomplete lineage sorting was inferred between the Pacific and Atlantic basins, the subset of data (i.e. the shared lineage) was subjected to further analyses. A 99% plausible statistical parsimony haplotype network was constructed using the TCS 1.21 software (Clement, Posada, & Crandall, 2000). For a coalescent‐based estimate of the most recent trans‐Arctic invasion event and levels of gene flow after that, an MCMC simulation approach implemented in the program IMa was used (Hey & Nielsen, 2007; Nielsen & Wakeley, 2001), for 8 taxa with sufficient sample sizes (see Results). The IMa model assumes an ancestral population splitting into two descendant populations at time t, followed by divergence and potential gene flow. If the immigrant haplotypes all represented a subclade of the ancestral basin diversity, only that subclade was included in the IMa analysis (Table 4).
RESULTS
The diversity of biogeographical patterns
Our data set comprised 89 metazoan taxa with amphi‐boreal or (amphi‐)boreal–arctic distributions, whose initial divergence was judged to fit the timescale since the opening of the Bering Strait ca 5.5–7.0 My ago. In inter‐oceanic comparisons, their mitochondrial genetic distances varied greatly (Table 1). When scaled by our operational molecular rates (calculated in Table 2), this variation would cover practically the whole time range under consideration (Figure 1). In a large proportion of taxa, the phylogeographic patterns of lineage distribution implied two or sometimes several trans‐Arctic dispersal events and subsequent secondary contacts of lineages within a genus or even within a species (Table 1).
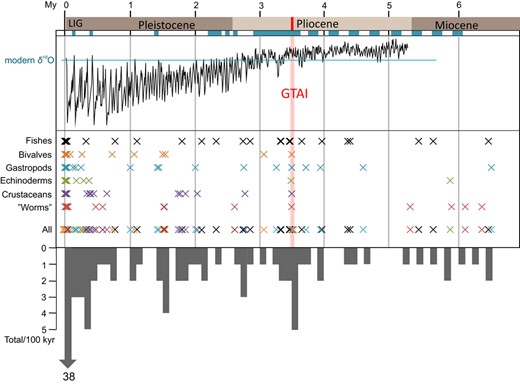
Distributions of inter‐oceanic divergence (time) estimates in different higher taxa. Net mtDNA sequence distances (TN + Γ) from pair‐wise inter‐population comparisons (Table 2) were scaled and plotted on a time axis using the tentative group‐specific divergence rates: ca 11.1% My−1 (for bivalves), 6.1% My−1 (for gastropods), 6.0% My−1 (for ‘worms’), 4.4% My−1 (for echinoderms), 4.3% My−1 (for crustaceans) and 1.1% My−1 (for fishes). The numbers of events are compiled in the histogram, each bar represents ‘a 100‐ky interval’. Globally distributed benthic δ18O records (Lisiecki & Raymo, 2005), indicating the pattern of climate variation over the past 5 million years, are plotted on the same time axis. The blue bars on the time axis are intervals related to high water levels in the Arctic (e.g. Miller et al., 2010)
The biogeographical patterns are summarized in a division into six main categories, which are not all mutually exclusive, and are schematically illustrated in Figure 2. The inferred classification for individual taxa and groups is in Tables 1 and 3, a summary of the overall frequencies of the patterns in Figure 3, and exemplary phylogeographies illustrated in Figure 4:
A simple long‐term inter‐oceanic vicariance without inferred reinvasion and secondary contact, recorded for 35 (+10) taxa (including the subcategory a1). Examples illustrated include the barnacle Semibalanus balanoides and the gadid fishes Eleginus gracilis versus E. nawaga.
a1 A subcategory of (a) comprises 10 taxa whose divergence is tentatively estimated to be of Early‐to‐Middle Pleistocene age and thus distinctly post‐date the Pliocene interchange.
Species or clades where a minimum of two distinct trans‐Arctic divergence events were recognized, recorded in 23 taxa, for example the sea slug Aeolidia papillosa and the barnacle Balanus crenatus.
Cases where the successive invasions were judged to have resulted in a secondary contact between diverged lineages in either of the basins, either at an inter‐ or an intra‐species level, inferred for 22 of the 23 instances in (b), for example Mytilus trossulus.
Relatively recent (late‐glacial/post‐glacial) dispersal or effectively ongoing migration, judged from incomplete lineage sorting between inter‐oceanic populations or otherwise close relationship (35 cases, e.g. the chalky macoma Macoma calcarea and the sand dollar Echinarachnius parma Figure 4d). Half of those represent genera or species where also evidence of earlier long‐term vicariance was documented (b), but in 17 instances, no evidence of a history deeper than the late‐glacial came up.
Secondary contact in the Arctic, following preglacial inter‐oceanic vicariance and subsequent post‐glacial inter‐oceanic dispersal to the Arctic basin but not (necessarily) further to the boreal zone (e.g. the northern shrimp Pandalus borealis).
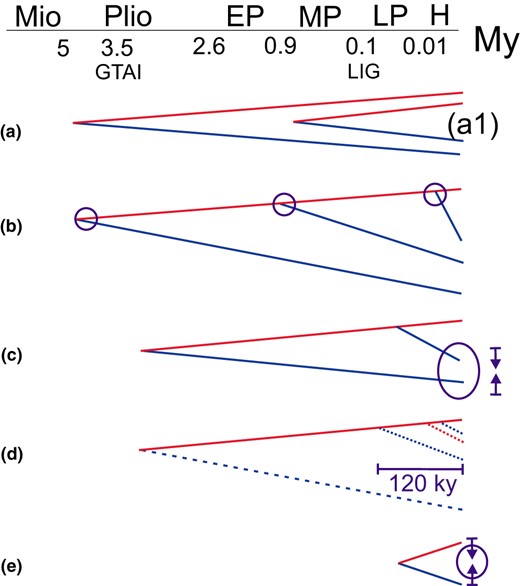
Illustration of the categories of inferred trans‐Arctic histories of Pacific (red) versus. Atlantic (blue) lineages in amphi‐boreal taxa. The schematic scale is not linear, and indicates division into Miocene (>5 My), Pliocene (>2.6), Early Pleistocene (>0.9), Middle Pleistocene (>0.13), Late Pleistocene (>0.01), and Holocene time frames. GTAI, Great Trans‐Arctic Interchange; LIG, last interglacial ca 120 ky. The patterns are as follows: (a) long vicariant histories (descending from the Pliocene–Early Pleistocene), with subcategory (a1) more recent vicariant histories (from the Middle Pleistocene, 1–0.2 My); (b) several (2–4) successive trans‐Arctic divergence events; (c) possible secondary contact following repeated dispersal; (d) late‐ or post‐glacial dispersal, <130 ky (incomplete lineage sorting or otherwise close relationship); (e) post‐glacial contact of shallow (LIG) lineages in the Arctic basin. See further in Results
Frequency of inferred phylogeographic patterns in the compilation of 89 amphi‐boreal data sets, partitioned by the major taxa included
| Pattern | Molluscs | Crustaceans | Echinoderms | “Worms” | Fishes | Seals | All |
| Number of taxa | 22 | 13 | 10 | 14 | 28 | 2 | 89 |
| a (simple deep vicariance) | 11 | 7 | 1 | 6 | 10 | 35 | |
| a1 (Middle Pleistocene vic.) | 2 | 2 | 3 | 3 | 10 | ||
| b (repeated invasions) | 5 | 2 | 2 | 4 | 9 | 1 | 23 |
| c (secondary contact) | 5 | 2 | 2 | 3 | 9 | 1 | 22 |
| d (late/post‐glacial) | 8 | 3 | 6 | 8 | 10 | 1 | 36 |
| e (Arctic contact) | 1 | 4 | 5 | ||||
| Patterns a‐e total | 31 | 17 | 14 | 21 | 45 | 3 | 131 |
Note that all patterns are not exclusive of each other, but several patterns can be found in a given taxon. The data are compiled from the information detailed in Table 1 (see summary in Figure 3).
![Summary of the frequencies of inferred trans‐Arctic histories in the 89 taxa (genera) examined (Table 1; last column of Table 3). The biogeographical histories are classified into the categories illustrated in Figure 2. The patterns b,c,d frequently occur together (e.g. secondary contact following a recent trans‐Arctic reinvasion), and the overlap is shown within the broader [b c d] column. The darker section of column c refers to cases of documented hybridization (h)](https://oup.silverchair-cdn.com/oup/backfile/Content_public/Journal/jeb/34/1/10.1111_jeb.13674/2/m_jeb13674-fig-0003.jpeg?Expires=1748211056&Signature=Z3H6ATpiv2LOsN-ye~xA00ETTGB9f3IA6omliZWwSDF7mppoQpOwm6s5oHnqqYrLwgFRtms6rXBH6wnt8J-W3hS7IsgitlGik2HxqJ10BT~tqkBIJV~W3Lpr8-1CcJSwEwUaJThU8Oc4ttnd8amj2Iqb5URbZ-l4XDdfhI4GgIK8PKhMabOotO3gB6KCXXy3HL5M0H0ArsBySAeEKKLnXmF6nPuCLEyiKVEGtCsdfvFFzzRszcKnU8amif6ObMah3a6JsRcCUR4XUNBXUDku2Ut0IDJx2V3YpyOOSDOOX4co3vbE~-Zm4A~1nrs6QBawzRWUYKfpEYLQB0fQj0qGbA__&Key-Pair-Id=APKAIE5G5CRDK6RD3PGA)
Summary of the frequencies of inferred trans‐Arctic histories in the 89 taxa (genera) examined (Table 1; last column of Table 3). The biogeographical histories are classified into the categories illustrated in Figure 2. The patterns b,c,d frequently occur together (e.g. secondary contact following a recent trans‐Arctic reinvasion), and the overlap is shown within the broader [b c d] column. The darker section of column c refers to cases of documented hybridization (h)
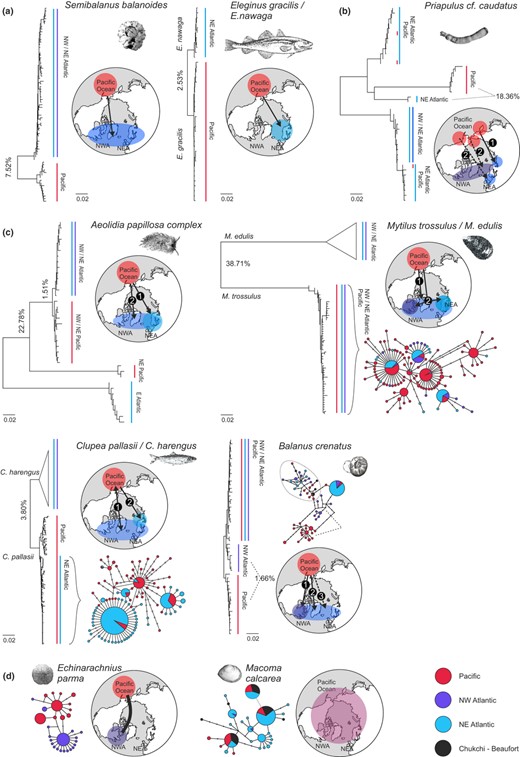
Exemplary phylogeographic patterns in mtDNA genealogies (NJ trees from TN + Γ substitution model distances), as classified in Table 1, Figure 2. (a) Deep vicariant histories (since Pliocene–Early Pleistocene). (b) and (c) Repeated trans‐Arctic invasion (a minimum of two distinct divergence events), with possible secondary contacts following repeated trans‐Arctic dispersal (in c), or (in b) without detected secondary contacts. (d) Incomplete lineage sorting between the ocean basins, interpreted as post‐ or late‐glacial dispersal. Further examples are illustrated in Figure S1
The contents of the various categories are further decomposed below, and additional examples are illustrated in Figure S1.
Distribution of deep inter‐oceanic divergence estimates
The inter‐oceanic model‐corrected net distances are plotted on a timescale based on the operational group‐specific rates, estimated in Table 2 separately for fishes, molluscs, crustaceans, echinoderms, and polychaetes (Figure 1). The rates vary strongly between the groups, from 1.1% My−1 in fishes to 11% My−1 in bivalves. Within each of these groups, the distribution of divergence estimates was broad, involving up to 10‐ to 20‐fold differences among taxa. In fishes, a majority of estimates would well fit the mid‐Pliocene time frame, but there were several substantially younger estimates, and others at the upper limit of the time range. The spread within the other major taxa was even more prominent, whereas for instance, the crustacean estimates tended to be in the lower (Pleistocene) end of the scale.
Using the HABC approach, the hypothesis of a simultaneous trans‐Arctic divergence for 16 fish taxa was decisively rejected (Ω = 0.33, BF < 0.000), and the best estimate of number of different divergence events was 7 (Ψmean = 7.1) (Table S6). Based on the exemplary case and the comparative dispersion of estimates in each of the other taxonomic groups (Table 2, Figure 1; also see Loeza‐Quintana et al., 2019), we judge that the rejection can safely be generalized to the other groups.
Deep divergence of vicarious Pacific and Atlantic lineages (patterns a, a1)
Further invertebrate taxa where a putative Pliocene vicariance without evidence of further contact was inferred (pattern a) included the bivalves Modiolus modiolus and Turtonia minuta, the sea slug Alderia modesta, the amphipod Calliopius laeviusculus, and mysids Neomysis spp., among many others, and of vertebrates the flatfishes Limanda and Platichthys, and clades in the sculpin genus Myoxocephalus. Dichotomies representing a clearly younger, plausibly Middle Pleistocene timescale (a1), are indicated for several sea star genera (Corstorphine, 2010), eelpouts Zoarces spp., and for the largely freshwater stickleback genera, Gasterosteus and Pungitius (also see Fang, Merilä, Riberio, Alexandre, & Momigliano, 2018).
In several instances, a three‐way vicariance is evident, comprising both an amphi‐oceanic split and a trans‐oceanic split of similar age within the target or the source basin. These involve the morphologically defined Neomysis spp., echinoderm Asterias (Wares, 2001) and newly identified molecular taxa in the amphipod Calliopius laeviusculus, bivalves Turtonia minuta and Modiolus modiolus and the polychaete Nereis pelagica. Further, the category involves instances of intra‐basin species radiations that post‐date the basic vicariance, notably within both oceans in the genus Littorina (Reid, 1990). Within the Pacific, such radiations are detected in the sculpin fish genera Myoxocephalus and Gymnocanthus and within the Atlantic in the polychaete complexes Hediste diversicolor (Audzijonyte, Ovcarenko, Bastrop, & Väinölä, 2008) and Harmothoe imbicata (Carr et al., 2011) and in the fish Gasterosteus aculeatus.
Repeated inter‐oceanic invasions and secondary contact (b, c)
The 23 instances where multiple trans‐Arctic invasions within a taxon were inferred (b) represent a mix of different spatial and temporal patterns (Table 1). For twelve taxa, the basal divergence plausibly corresponds to a Pliocene event. In 17 cases, the latest exchange was judged to be post‐glacial (see further in next section). Secondary invasions that took place earlier, up to the LIG, are inferred, for example for the bivalve Hiatella spp. (Laakkonen, Strelkov, & Väinölä, 2015), the sea slug Aeolidea papillosa, the priapulid Priapulus caudatus and for the harbour seal Phoca vitulina, which meets in the Pacific with the earlier invasion of the spotted seal lineage (P. largha). As a rule, a secondary invasion has led to a secondary contact (pattern c; defined as the presence of lineages in the same geographical area), but there are a few instances where no secondary contact has been documented (Hiatella L versus. K, P. caudatus). On the other hand, a Middle or Late Pleistocene invasion and vicariance may also represent the basal event, followed by another invasion late‐ or post‐glacially (see below).
Post‐glacial and late‐glacial relationships (d, e)
In these final patterns, the net inter‐oceanic distances (Table 4) generally represent divergence equivalent to no more than a couple of substitutions (generally D = 0.1%–0.4%, with extremes of 0.02% (Hiatella L) and 0.7% (Pandalus spp.)). Temporally, that corresponds to the post‐ or late‐glacial time frame. Alternative estimates from the IMa coalescence simulations ranged from 0.04% to 0.31% sequence divergence (or 0.24 to 1.58 mutational units; Table 4). The lowest estimates were 0.24 mutational units for Macoma calcarea (no significant differentiation), 0.55 for Limecola balthica and 0.53 for Echinarachnius parma. Somewhat higher and clearly pre‐LGM were estimates for S. droebachiensis (1.28) and B. crenatus (1.58). Post‐divergence gene flow between the Pacific and Atlantic was inferred for Hiatella L, L. balthica, S. droebachiensis and C. pallasii.
Taxa where post‐glacial or late‐glacial inter‐oceanic relationships were inferred (or suspected), and divergence estimates
| Species | Post‐ or late‐glacial invasion | Contact region | net p‐dist. (%) | n Pac / n Atl | τ | τ / L (%) | References |
| Bivalves | |||||||
| Hiatella L a | NP → NWA d | NWA | 1.10 | 59/26 | Laakkonen, Strelkov, and Väinölä (2015) | ||
| Hiatella L a | NP → NWA | NWA f | 0.02 | 59/48 | 0.65 | 0.10 | Laakkonen, Strelkov, and Väinölä (2015) |
| Macoma balthica | NP → NEA g | NEA | 0.09 | 26/26 | 0.55 | 0.09 | Nikula, Strelkov, and Väinölä (2007) |
| Macoma calcarea a | NEP/A/NWA/NEA b | 0.30 | 20/85 | 0.24 | 0.04 | This study, Layton et al. 2013 | |
| Mytilus trossulus | NP → NWA/NEA g | NWA/NEA | 0.08 | 194/68 | 0.53 | 0.10 | Marko et al. 2010, this study |
| Gastropods | |||||||
| Acanthodoris pilosa | NA → NEP | NEP | 0.11 | 2/15 | BOLD | ||
| Dendronotus venustus/frondosus | NEA → NEP | NEP | 0.51 | 2/10 | Dewaard 2017, Korshunova et al. 2019, Pola & Gosliner 2010, | ||
| Ekimova et al. 2016 | |||||||
| Limacina helicina | f | 0.28 | 209/138 | Abyzova et al. 2018, Chichvarkhin 2016, Shimizu et al. 2017, Hunt et al. 2010, Layton, Martel & Hebert 2014, Jennings et al. 2010 | |||
| Velutina velutina | ? | 0.47 | 2/8 | BOLD | |||
| Crustaceans | |||||||
| Balanus crenatus | NP → NWA d/NEA d | NWA/NEA | 0.22 | 9/24 | 1.58 | 0.08 | This study |
| Balanus crenatus | (NP → NWA/NEA) h | (NWA/NEA) | 0.00 | 4/57 | This study | ||
| Centropages abdominalis | NA → NEP | 0.34 | 6/19 | Young 2016, BOLD | |||
| Pandalus borealis | NP → ARC ← NA | ARC f | 0.70 | 5/20 | This study, BOLD, Radulovici et al 2009 | ||
| Gammarus setosus a | NWP/NA | NWP | This study, BOLD, Radulovici et al 2009 | ||||
| Pleopsis polyphaemoides | (NA → NEP)h | (NEP) | 0.27 | 2/20 | Durbin et al. (2008) | ||
| Podon leukcartii | (NA → NEP)h | (NEP) | 0.04 | 6/12 | Durbin et al. (2008) | ||
| Echinoderms | |||||||
| Echinarachnius parma | NP → NWA d | 0.30 | 63/53 | 0.53 | 0.08 | This study | |
| Henricia cf. oculata | NEP → NWA | 0.34 | 3/4 | Corstorphine (2010) | |||
| Henricia sp. AAB9183 | NEP → NWA | NWA | 0.49 | 2/13 | Layton, Corstorphine & Hebert 2016 | ||
| Henricia sp. EAC06 | NEP/NWA | Corstorphine (2010) | |||||
| Strongylocentrotus droebachiensis | NP → NWA d | NWA f | 0.41 | 33/115 | 1.28 | 0.31 | Palumbi & Kessing 1991, Addison and Hart (2005), this study |
| Strongylocentrotus pallidus | NP/NWA/NEA | Balakirev et al 2008, Corstophine 2010, Hardy et al. 2011 | |||||
| Polychaetes | |||||||
| Glycera capitata | Ber/NWA/NEA | Carr et al. (2011), Hardy et al. 2011 | |||||
| Harmothoe imbricata group | NEP/ARC/NWA | NEP/ARC/NWA | Carr et al. (2011), Hardy et al. 2011 | ||||
| Harmothoe rarispina CMC03 | NWA → NEP | NEP | 0.11 | 8/17 | Carr et al. (2011), BOLD | ||
| Nereis pelagica CMC03 | NWA → Ber | 1/26 | Hardy et al. 2010, Carr et al. (2011), BOLD | ||||
| Nereis pelagica CMC03a | Ber/NWA | NWA | Carr et al. (2011), Hardy et al. 2011 | ||||
| Phyllodoce sp. CMC01a | Ber/ARC‐NWA | Carr et al. (2011) | |||||
| Pholoe baltica A | Ber/ARC‐NWA | Carr et al. (2011) | |||||
| Pholoe minuta A | Ber/ARC‐NWA | 0.55 | 4/29 | Carr et al. (2011) | |||
| NEP/NEA | NEA | This study | |||||
| Fishes | |||||||
| Anisarchus medius a | NP → ARC ← NWA (?) | ARC | Mecklenburg et al. (2011) | ||||
| Aspidophoroides monopterygius | NP c → NWA | NWA | Mecklenburg et al. (2011) | ||||
| Clupea pallasii | NWP → NEA g | NEA | 0.06 | 111/242 | 2.32 | 0.21 | Laakkonen et al. (2013) |
| Eumesogrammus praecisus a | NP c → ARC ← NWA | ARC f | Mecklenburg et al. (2011) | ||||
| Gadus chalcogrammus (G. finnmarchicus) | NP → NEA | NEA | Ursvik et al. (2007),Gorbachev et al. 2014 | ||||
| Gadus macrocephalus (G. ogac) | NP → NWA | NWA | Coulson et al. (2006) | ||||
| Gymnocanthus tricuspis | NA → NP | Ber | Yamazaki et al. 2013 | ||||
| Leptagonus decagonus a | NWP c → ARC ← NA | ARC f | McCusker et al. 2012, BOLD | ||||
| Leptoclinus maculatus a | NP → ARC ← NA | ARC f | Mecklenburg et al. (2011) | ||||
| Liopsetta glacialis | NWP → NEA b | 0.16 | 7/17 | This study, Kartavtsev et al. (2014) | |||
| Lumpenus fabricii | NP → NEA | NEA e | This study, Mecklenburg et al. (2011) | ||||
| Mallotus villosus | NP → ARC/NWA | NWA | Dodson et al. (2007) | ||||
| Myoxocephalus scorpius a | NEA/NWA → NEP | NEP | This study, Mecklenburg et al. (2011) | ||||
| Osmerus dentex | NWP → ARC/NEA | NEA | 0.22 | 4/9 | Kovpak et al. 2011, Skurikhina et al. 2013 | ||
| Reinhardtius hippoglossoides a | NP/NWA/NEA | 0.06 | 5/280 | Vis et al. 1997, Kartavtsev et al. (2014) | |||
| Mammals | |||||||
| Phoca hispida (sspp. hispida & ochotensis)a | NEA /ARC/ NWP b | This study | |||||
IMa analysis was performed only for taxa with sample sizes n > 10 in both basins: τ is an estimate of distance in terms of the number of observed inter‐oceanic nucleotide differences, and τ / L is the relative distance (per site), from the IMa analysis. The genetically documented distribution of the invading lineage and the inferred direction of post‐glacial spread and possible intra‐generic contact regions are indicated. References for previously published sequence data are listed in Table S2.
Net distance estimates between relevant clades are indicated, if sequence data were available (n > 2 for each population). Estimates were calculated with MEGA (Tamura et al. 2013). For a subset of comparisons, the population split time estimate from the IM analysis, translated to per‐site distance units, is also given.
Boreal–arctic species with possibly continuous range through the Arctic.
Post‐glacial spread without refugial disjunction.
No sequence data (from the actual basin).
Inferred spread in the last interglacial (ca 110–130 kya).
Other intra‐species contacts (not related to trans‐Arctic dispersal).
Contacts of late‐glacial lineages.
Instances where hybridization has been documented.
Suspected anthropogenic invasion.
Regarding the inferred sequence of events, the recent connections comprise a number of subcategories. Taxa, where a Pacific lineage seems to have recently secondarily spread to the Atlantic following an early initial colonization (often in the Pliocene), involve, for example, the bivalves Limecola balthica (see Nikula et al., 2007), Mytilus trossulus and Hiatella sp. L, the Pacific herring Clupea pallasii (from Laakkonen et al., 2013; Laakkonen, Strelkov, & Väinölä, 2015) and the gadid fishes Gadus macrocephalus (= G. ogac) and Gadus chalcogrammus (= G. finnmarchicus) (e.g. Coulson et al., 2006; Ursvik et al., 2007), all addressed in previous studies. Further fish examples include Lumpenus fabricii (Mecklenburg, Møller, & Steinke, 2011, this study), Myoxocephalus scorpius (Mecklenburg et al., 2011, this study) and Osmerus dentex (Skurikhina, Kukhlevsky, & Kovpak, 2013). In the opposite direction, the cladoceran crustaceans Podon leuckartii and Pleopsis polyphemoides have secondarily spread from the Atlantic basin to the Pacific (Durbin, Hebert, & Cristescu, 2008). Instances of incomplete lineage sorting with unresolved direction occur in boreal–arctic polychaetes (Carr, Hardy, Brown, Macdonald, & Hebert, 2011), in the amphipod Gammarus setosus (this study) and the fishes Anisarchus medius (Mecklenburg et al., 2011), and in Reinhardtius hippoglossoides (Kartavtsev et al., 2014).
This category also includes taxa, which show shallow divergence between predominant haplogroups of the (northernmost) Atlantic versus Pacific, but also occasional sharing of haplotypes, that is co‐occurrence of the clades within either of the basins or between them in the Arctic: the widespread echinoderms E. parma (Figure 4c) and S. droebachiensis; the trans‐Arctic bivalve Hiatella sp. L; and the pelagic boreal–arctic shrimps attributed to Pandalus borealis/ P. eous, where shallow inter‐oceanic lineages co‐occur in the arctic Chukchi Sea. Similar secondary contacts within the Arctic basin (pattern e) are recorded in several fishes with characteristically northern distributions: Leptoclinus maculatus, Leptagonus decagonus, Eumesogrammus praecisus, Anisarchus medius (Mecklenburg et al., 2011) and possibly Myoxocephalus scorpius. The vicariance in these cases is shallow and plausibly represents the latest glacial cycle.
As an extreme instance, the boreal–arctic bivalve Macoma calcarea exhibits no structure and no deeper divergence among widespread samples from three oceans, and there is no deeper record of species history but the post‐glacial homogenization (Figure 4d). The variation in the boreal–arctic flatfish Liopsetta glacialis can also be interpreted as a result of post‐glacial spread of (an initially introgressed) lineage from the NW Pacific to the European Arctic and the White Sea, with a bottleneck, but this hypothesis requires verification. In the amphi‐oceanic Greenland halibut Reinhardtius hippoglossoides, fish from the Bering Sea contact area represent the Atlantic diversity, suggesting post‐glacial spread through the Arctic (but material from deeper in the Pacific was not studied; Kartavtsev et al., 2014). Another case of inter‐oceanic homogeneity is the predominantly arctic ringed seal Phoca hispida, which has isolated boreal outposts (subspecies) in both oceans.
Secondary contacts of successive invasion waves (pattern c) usually involve a very recent invader (d) and thus in effect are contacts between current Pacific and Atlantic taxa. In the Northeast Atlantic sector, sister species pairs of fishes now in contact involve Clupea pallasii/C. harengus, Gadus chalcogrammus/G. morhua and Osmerus dentex/O. eperlanus, all recognized by morphology (Table 1). In invertebrates, similar contacts, which however represent cryptic lineages, are recognized in the bivalves Mytilus trossulus/M. edulis and Limecola b. balthica/L b. rubra, in the nudibranch Aeolidia papillosa, the barnacle Balanus crenatus, amphipod Gammarus setosus and polychaete Harmothoe imbricata (Table 1).
In the Northwest Atlantic, similar pairs of recently versus earlier invaded sister taxa included the bivalves Mytilus trossulus/M. edulis, Limecola balthica (lineages d/c/L. petalum), and the fishes Aspidophoroides monopterygius/A. olrikii and Gadus macrocephalus/G. morhua (Table 1). Two cryptic lineages both present in the Northwest Atlantic are detected in the bivalve Hiatella L, amphipod Gammarus setosus, polychaetes Eunoe nodosa, Harmothoe imbricata, H. rarispina and Nereis pelagica and in the fish Mallotus villosus (Table 1).
DISCUSSION
The invasion of numerous Pacific taxa following the Pliocene opening of the Bering Strait fundamentally shaped the boreal Atlantic biotic diversity we see today, whereas the invasions to the opposite direction shaped the Pacific diversity to lesser extent (Briggs, 2003; Durham & MacNeil, 1967; Vermeij, 1991). These invasions, known as the GTAI (Great Trans‐Arctic Interchange), are thought to have peaked at ca 3.5 My ago. The idea of a broadly synchronized invasion is based both on the fossil record and on a major hydrographic change, when the main current in the north Pacific shifted northwards and through the Bering Strait. The shift was induced by the closure of the previously open Panamanian Strait at a more southern latitude (Haug & Tiedemann, 1998). However, geological, palaeontological, taxonomical and genetic (molecular) arguments now suggest that amphi‐boreal distributions do not stem from this event only. Indeed, although the GTAI hypothesis makes a convenient starting point for a discussion, a number of other time frames are often considered for explaining trans‐Arctic affinities (e.g. Mecklenburg et al., 2011; Nikula et al., 2007; Rawson & Harper, 2009), particularly the connections during the last interglacial (LIG), the early post‐glacial (or Holocene Thermal Maximum, HTM) or still more recent, human‐assisted migration. Although our sampling of taxa is not comprehensive and cannot be representative in the biological sense, the distribution of the main patterns illustrates well the diversity of the underlying phylogeographic scenarios (Figures 1–4). Also, although the rate calibrations would only be indicative, the frequency of late‐ and post‐glacial dispersal events (<0.2 My) is high at all events (about 50% of taxa; Tables 3 and 4), showing that the recent interchange has strongly influenced the current diversity of the North Atlantic boreal fauna. Repeated invasions within a genus were common, and usually the latest event was quite recent, post‐glacial or even ongoing. As a rule, the ranges of such successively invaded lineages were found to overlap, although sample sizes and coverage were often quite limited.
Opening of the Bering Strait and the basal trans‐Arctic divergence
There is a set of several fish taxa where the basic divergence estimates coincide and could plausibly represent the 3.5 My GTAI (Table 2, Figure 1). No such pattern is seen in other groups, and the scatter of estimates is particularly broad in bivalves and polychaetes (up to 39% TN + Γ; Table 2). That is notable, as the concept of GTAI (and the calibration of rates) largely relies on mollusc fossil evidence dated to ca 3.5 My. Yet, note that from geological (palaeobiological) evidence the Bering Strait was open already by 5.5 My, and climatically, much of the Pliocene was favourable for trans‐Arctic movements. Although cooling towards the Pleistocene would gradually have severed the connections, several further sea highstand periods have been suggested at turn of Pleistocene at 2.7 My, 2.6 My and 2.4–2.2 My (or alternatively ca 1.4 My) (e.g. Miller et al., 2010).
If repeated or continuous exchange indeed was possible through the Pliocene, we would not even expect a signal of coincident divergence. Within the target basin, the current haplotypes will coalesce and represent a single invading haplotype line, most likely not an early one coinciding with the fossil date but any of those that arrived later. This could account for the wide variation of basal divergences, if the within‐phylum rates indeed were relatively constant. For example, the Atlantic snails Littorina littorea and Nucella lapillus both are cited as early Pliocene invaders but their COI divergences differ almost two‐fold (22% versus 12% TN + Γ). Similarly, the basal vicariances in the bivalves Mytilus and Macoma correspond to 39% and 16% COI distance, respectively (cf. Yurchenko, Katolikova, Polev, Shcherbakova, & Strelkov, 2018). Actually even the first fossil record dates vary, which sometimes goes ignored in calibrations, for example from Early Pliocene for the first Atlantic Mytilus (5.3–3.5 My), but Early Pleistocene for Limecola balthica (2.4 and 2 Myr for East Greenland and NE Atlantic, respectively) (Funder et al., 2001; Riches, 2010; Símonarson, Petersen, & Funder, 1998). This variation in the inferred divergence times reflects the complex nature of (even) the first trans‐Arctic divergence events.
Connections through the Pleistocene
After the Early Pleistocene highstands, the Bering Strait laid dry, reflecting a long‐term global cooling and relatively low sea levels of the Ice Age (Kaufman & Brigham‐Grette, 1993), and start of a plausibly lengthy isolation between boreal faunas. The initial 40‐ky glacial–interglacial cycles became longer and more severe towards the Middle Pleistocene, and during the last ~700 ky, their length has been ca 100 ky (Miller et al., 2010). The most notable interglacials that could have facilitated faunal exchange were MIS 11 at ca 400 ky ago, with higher sea levels than ever since (cf. Olson & Hearty, 2009), and the last interglacial c. 120 ky ago (e.g. Anderson et al., 2006).
The genetic data point to substantial trans‐Arctic exchange even during the Pleistocene. Some potential peaks in the distribution of divergence estimates (e.g. 0.3 and 1.5 Myr on the putative invertebrate scales of Figure 1) might be associated with the Pleistocene transgressions. In any case, exchange during several interglacial events is suggested, directly from the wide range of relative divergence estimates within each group independently (Table 2), and from the ABC analysis for fishes. In fishes, for example the estimates of 2.0% in Hippoglossus, 1.1% in Zoarces and 0.4% in Gasterosteus plausibly represent the Pleistocene. Even stronger evidence of multiple invasion times comes from taxa where successive invasions are implied within the same species (complex). A sequence of four trans‐Arctic events was hypothesized for Limecola balthica sensu lato, corresponding to COI distances of 16% (NW Atlantic L. petalum), 8.4% (European L. b. rubra), 3.2% (NW Atlantic M. b. balthica c lineage) and finally to a post‐glacial invasion by the current Pacific L. b. balthica d lineage (Nikula et al., 2007).
The Pleistocene and Late Pliocene invasions were mostly inferred to have been in the Pacific‐to‐Atlantic direction. Rare exceptions include the marine cladocerans of a European Atlantic origin, inferred to have reached the Pacific either in the Pleistocene (Evadne nordmannii and Podon leukcartii) or in the Holocene (P. leukcartii and Pleopsis polyphemoides) (Durbin et al., 2008).
Late‐ and post‐glacial dispersal
Apart from the Pliocene GTAI, the last interglacial LIG that started the Late Pleistocene has been implicated as a period of significant inter‐oceanic exchange (Mecklenburg et al., 2011). The current data emphasize the relative commonness of even later connections.
We primarily aimed at separating post‐glacial (<12 ky), late‐glacial (<130 ky) and earlier events from each other (Table 4). In separating late‐glacial from post‐glacial relationships, a pattern of inter‐basin reciprocal monophyly, even if shallow, was interpreted as a late‐glacial (LIG), whereas incomplete lineage sorting (ILS) could reflect either time frame, depending on concepts of mutation rate and Ne. Particularly for vertebrates where mutation rates are slow, a high observed level of variation (related to Ne) sometimes suggests that even the intra‐oceanic coalescences can be older than Late Pleistocene age (e.g. Laakkonen et al., 2013; Palo & Väinölä, 2006) and ILS since LIG is thus not unexpected.
Inter‐basin exchange in LIG was recognized in several instances, sometimes followed by further post‐glacial interchange (Hiatella L, Balanus crenatus, Strongylocentrotus droebachiensis). The shallow intra‐species vicariance in the harbour seal may also represent that timescale (see below). Also, the pattern (e) where a Late Pleistocene (LIG) vicariance was followed by post‐glacial expansion north from the Pacific and a contact of lineages within the Arctic, but with no evidence of post‐glacial amphi‐boreal exchange so far, was recorded in several instances.
For the closest trans‐Arctic relationships, the nominal age estimates (from IMa) of ca 8 ky in Macoma calcarea and L. balthica would even approximate the Holocene thermal maximum, whereas estimates for Mytilus trossulus, Hiatella L, Echinarachnius parma and Clupea pallasii would rather point to the Middle or Late Weichselian (late‐)glacial times (18–38 ky), which appears palaeogeographically impossible. Considering the calibration bias due to the ‘apparent time dependency of molecular rates’ (e.g. Crandall et al. 2011; see Appendix S2), also these events are however credibly projected to the post‐glacial. Post‐glacial trans‐Arctic dispersal to the NE Atlantic was newly inferred for the arctic flounder Liopsetta glacialis, the amphipod Gammarus setosus and the priapulid Priapulus caudatus, on top of the cases recognized earlier (Table 4).
A more complex scenario involving an earlier invasion (>200 ky) followed later by strong Holocene gene flow was implicated for the urchin S. droebachiensis (Addison & Hart, 2005; Addison & Pogson, 2009). Analysis of our expanded data set (with new NW Pacific samples) agrees with the model but suggest that the basal invasion could rather be of LIG age c, 120 ky. Echinoderms are good dispersers, and close trans‐Arctic affinities have been documented in at least six further species (Table 4).
Idiosyncrasies
The data imply that the trans‐Arctic dispersal histories among taxa have been very diverse, and the resulting genetic patterns have further been shaped by other population genetic phenomena such as bottlenecks (e.g. in Gammarus setosus, Lumpenus fabricii, Clupea pallasii, Liopsetta glacialis) and hybridization and genetic introgression (Mytilus, Limecola, Clupea; see below).
The haplotype distributions in G. setosus and the barnacle Balanus crenatus appear particularly complex. The structure of the fouling barnacle (expectedly) seems to have been moulded by recent shipping, but also retains strong signatures of more ancient events (Figure 4b), that is two distinct Pleistocene invasions of which the latter plausibly of LIG age (Table 4). The disproportionate dominance of a single haplotype in widespread samples of both oceans implies a third, human‐mediated wave of invasion of very recent age (no new Atlantic mutations).
The seal data involve both inter‐ and intra‐species events. The harbour seal versus. spotted seal split is interpreted as an initial invasion of the ancestral P. vitulina lineage to the Pacific c. 1 My ago and evolution of the endemic Pacific P. largha from this lineage since then. A reinvasion of P. vitulina then followed during a later interglacial, possibly the LIG. In the arctic–boreal ringed seal P. hispida, the high intra‐population variability (cytb nucleotide diversity π ~1%) precludes confirmation of the age of invasion of the Pacific population (P. h. ochotensis) from the current data.
Cryptic amphi‐boreal taxa
Evidence of cryptic allopatric taxa, from deep divergences between formally conspecific Atlantic versus. Pacific lineages, was frequent particularly in invertebrates. The depths of these divergences are sometimes comparable to those of formal sister species attributed to the GTAI (Table 2). Putative new species were seen in the nudibranchs Aeolidia papillosa (Carmona, Pola, Gosliner, & Cervera, 2013, this study) and Alderia modesta (Ellingson & Krug, 2006), amphipod Calliopius laeviusculus (this study), barnacle Semibalanus balanoides (this study) and several polychaetes from Carr et al. (2011). Further, the bivalves Turtonia minuta (this study) and Modiolus modiolus (Halanych, Vodoti, Sundberg, & Dahlgren, 2013, this study) evidently contain cryptic allopatric species. Those cases are analogous to the trans‐Arctic taxon pair Hiatella L and Hiatella K (Laakkonen, Strelkov, & Väinölä, 2015) or the initially cryptic taxa in Mytilus and Limecola, which later have also come to secondary contact.
Invasions to the Northeast versus Northwest Atlantic
From fossil evidence, the endemic North Atlantic component of the shallow‐water mollusc fauna on the North American coast is exclusively derived from colonizers from Europe. Vermeij (2005) speculated that also the (nonendemic) trans‐Arctic component of the fauna (representing GTAI) could have reached North America indirectly through Europe, but the fossil data could not verify this hypothesis. From our compilation of phylogeographic data, Pacific lineages from the more recent invasion waves seem to have arrived variably either to the NE or NW Atlantic, or both. The data are however often too patchy to conclusively resolve whether both regions were invaded simultaneously. Yet, for instance, the broad mtDNA data set of the capelin Mallotus villosus (Dodson, Tremblay, Colombani, Carscadden, & Lecomte, 2007) would suggest approximately simultaneous invasion of both NW and NE Atlantic. In the post‐glacial time, the NW Atlantic seems to have been invaded directly and uniquely by Hiatella L, Harmothoe imbricata and Gadus macrocephalus whereas the NE Atlantic margins were similarly invaded at least by Clupea pallasii, Osmerus dentex, Gadus chalcogrammus, Liopsetta glacialis, Lumpenus fabricii, Limecola balthica and Priapulus caudatus. For Mytilus, the initial coast of post‐glacial invasion may remain unresolved (cf. Väinölä & Strelkov, 2011).
What factors then have facilitated the establishment of a post‐glacial invasion to either Atlantic margin? The ‘ecological opportunities’ concept suggests that invasion success primarily depends on niche availability (Cunningham & Collins, 1998; Vermeij, 1991). It is thought that glaciations would have caused local extinctions of benthic taxa along the Atlantic coasts, vacating habitats for the new invaders. Pacific taxa, arriving through the Arctic route, would be cold‐tolerant, and thus at advantage in colonizing newly deglaciated habitats before the Atlantic taxa expanded from their southern refugia. This scenario can be postulated for the post‐glacial invasions of M. trossulus and L. balthica in NE Europe, where the resident sibling taxa representing earlier invasion waves would have been able to reinvade northwards only later (cf. Strelkov, Nikula, & Väinölä, 2007; Väinölä, 2003). A comparable scenario could hold for the post‐glacial invasion of the Pacific herring to the NE European seas (Laakkonen et al., 2013).
Considering geological and habitat differences between the NW versus NE Atlantic coasts, it was suggested that glacial refugia for obligate rocky shore species were largely restricted to Europe and American populations more easily extirpated, whereas soft‐bottom refugia were present on both coasts (Jenkins et al., 2008). Our data do not give much support to the idea of these habitat differences governing success of colonization. The soft‐sediment Limecola balthica both survived on and recolonized both coasts, whereas of Hiatella L and K (more typical of hard substrates), only the NW Atlantic Hiatella L recolonized and merged with the resident lineage. Also, it seems that both the rocky littoral Mytilus trossulus and soft‐subtidal Macoma calcarea have post‐glacially invaded both North Atlantic coasts. Also, North American polychaetes involve examples of both hard‐ and soft‐substrate taxa, which recently invaded the Northwest Atlantic and others that did not (Carr et al., 2011).
The fish data so far revealed post‐glacial invaders that are present only on either the NE or NW Atlantic margins. These invasions seldom reached the actual boreal zone; for example the European Clupea, Liopsetta and Osmerus invaders are rather limited to the White, Eastern Barents and Pechora seas. The occupancy may partly reflect the alternative trans‐Arctic routes of invasion, along the Canadian or Siberian coasts, which may have been favoured by the predominant currents and the asynchrony of climatic optima during interglacials (cf. Renssen, Seppä, Crosta, Goosse, & Roche, 2012). At all events, both routes seem to have been used post‐glacially.
Secondary contacts and hybridization
We recorded overlapping distributions of sister species or distinct genetic lineages in nine vertebrate and eleven invertebrate taxa, or overall some 22% of the genera studied (Tables 1 and 3). These secondary contacts were between sisters broadly different in age—from encounters of deep, Pliocene lineages to post‐glacial reunion of lineages diverged just since the LIG. The fish contacts are mainly of the old category and involve morphologically recognized species (e.g. Gadus spp., Clupea spp.), whereas contacts of shallow intra‐species fish lineages, probably of late‐glacial age, were only found within the Arctic basin (e.g. Myoxocephalus scorpius, Leptoclinus, Leptagonus, Eumesogrammus). Invertebrate contacts regularly were between morphologically cryptic taxa, whether old or young. Contacts of shallow lineages were inferred in the Arctic basin (Pandalus) but also on boreal shores (e.g. Hiatella L, Balanus crenatus).
mtDNA alone is not sufficient for evaluating the contact outcomes in terms of potential interbreeding, but nuclear markers are needed. They have been rarely used in this context, except for the deeper lineages that were initially easily distinguished even by the slowly evolving allozyme markers. Evolution of incompatibility over a single glacial cycle appears unlikely, and for young lineages, observations of haplotype mixing plausibly reflect merging of the refugial ancestries (however, see Addison & Kim, 2018). This was inferred in Hiatella L in a broad sector of the NW Atlantic range (Laakkonen, Strelkov, & Väinölä, 2015). In principle, a repeated succession of interglacial invasions and fusion of intermittently isolated gene pools would seem to provide a mechanism enhancing the intra‐population diversity, similar to the Pleistocene pump effect of glacial cycles suggested to account for species‐level diversity in other environments (e.g. April, Hanner, Dion‐Cote, & Bernatchez, 2013). If the invasion was regularly in the same direction, the result could be gradual increase in variation in the target basin but not in the donor. Although secondary contacts of young lineages seem to be common in the data, so far there is little conclusive evidence of such repeated process over a broader time frame. A broader genomic sampling should elucidate this, and interesting histories to be addressed could involve Gammarus setosus and Balanus crenatus, apart from the ongoing genomics of Strongylocentrotus, which provides insights also to rapid reproductive isolation and habitat segregation in contacts of young lineages (Addison & Kim, 2018).
For deeper lineages (often taxa), there are now several examples of introgressive hybridization following a post‐glacial secondary contact. Inter‐taxon gene flow has substantially shaped the genetic diversity and systematic identities of some North Atlantic populations of Limecola, Mytilus, Clupea and Strongylocentrotus (Addison & Kim, 2018; Laakkonen, Strelkov, Lajus, & Väinölä, 2015; Nikula, Strelkov, & Väinölä, 2008; Rawson & Hilbish, 1998; Strelkov et al., 2007; Väinölä & Strelkov, 2011), and the observations on these contact zones were a central incentive for this broader survey. Interestingly, no further conclusive evidence of such contacts emerged however. Notably, the zones of interbreeding are centred in the marginal and inland seas that were glaciated until recently, in line with the more general observation that hybridization is typical of newly deglaciated and (re)colonized habitats (Hubbs, 1955). The question remains, whether the novel environments facilitate hybridization, or whether, vice versa, hybridization would enhance the colonizing success of new habitats (cf. Lucek, Roy, Bezault, Sivasundar, & Seehausen, 2010; Nolte, Freyhof, Stemshorn, & Tautz, 2005).
CONCLUSION AND PERSPECTIVES
The accumulated data demonstrate that the trans‐Arctic dispersal of boreal marine fauna has been a repetitive and dynamic process. During the Pliocene, prolonged faunal exchange was feasible and the coalescences between current taxa do not necessarily represent the earliest invasions. The data also point to interchange during various stages of the Pleistocene, and in several instances, the inferred basal divergence (coalescence) is not older than the last interglacial LIG. Most notably, in about half of the data sets, evidence of post‐ or late‐glacial inter‐oceanic dispersal was recorded (patterns d and e), and nearly half of those cases represent secondary trans‐Arctic invasions. The variable sequences of dispersal, vicariance and reinvasion or gene flow have produced a broad spectrum of phylogeographic patterns in the amphi‐boreal fauna.
Instances of deep divergences between nominally conspecific Atlantic versus Pacific populations, which most likely represent so far unrecognized vicarious cryptic taxa, are frequent in invertebrates, whereas in vertebrates morphological differences between such lineages are well established already. This is the first and conventional role of the trans‐Arctic exchange in promoting marine speciation and diversification on a circum‐boreal scale, through allopatry. The process will be further enhanced if the Eastern and Western Atlantic coasts are reached by different trans‐Arctic invasion waves, but remain in isolation from each other (e.g. Mallotus, Limecola, Strongylocentrotus).
Other roles arise from the repeated invasions and ensuing secondary contacts. If reproductive isolation evolved meanwhile, the isolation cycles could act as a simple speciation pump that could enrich a local fauna, given that also ecological divergence enabling co‐occupancy evolved. There is little evidence of such regular systematic diversification however. Instead, the shorter cycles of isolation and secondary contact can have a similar pump effect to enhance intra‐species variation both at inter‐ and intra‐population levels, which would potentially support adaptive diversification—as with any similar disjunction‐reconnection systems. Yet, the mitochondrial data alone bear little information of the genomic interactions and actual consequences of these phenomena.
Most intriguing are the outcomes of reinvasions when relatively strongly diverged (Pliocene) lineages, often recognized as distinct taxa, come to secondary contact and interbreed, and the compatibility of diverged genomes are tested. There are now several examples of hybridization and genetic introgression following trans‐Arctic secondary contacts. Most of them involve populations where introgression has substantially moulded the genetic identity of these taxa, and a local genetic equilibrium suggests that the mixed populations are self‐sufficient reproductive and evolutionary units. These populations as a rule arose in the post‐glacially vacated marginal environments, such as the low‐salinity Baltic and White Seas (e.g. Nikula et al., 2008). These examples highlight the independent evolutionary potential of hybrid populations arising from the trans‐Arctic contacts, which arguably could be considered as new taxa.
Another viewpoint to the sigificance of recent reinvasions of late‐glacially diverged lineages emerges in the context of the intra‐basin dynamics of variation. The roles of a number of distinct regional North Atlantic refugia in the course of the Pleistocene cycles, and of expansion waves out of them, have been emphasized in shaping the current phylogeography of littoral taxa within the basin (Maggs et al., 2008). The increasing evidence that vicarious Pacific populations of comparable age are post‐glacially reinvading the Atlantic basin points out that the North Pacific should be seen as another refugium and expansion source for the Atlantic taxa, an aspect largely overlooked so far. The significance of such a distant refugial source at the genomic level can be even stronger, if the inter‐oceanic vicariance was longer than one glacial cycle.
The effects of trans‐Arctic dispersal on boreal marine fauna are important both in the context of past and current zoogeography and of the ongoing and future changes in the marine Arctic, which are expected to enhance the faunal exchange (e.g. Greene, Pershing, Cronin, & Ceci, 2008, Vermeij and Roopnarine 2008, Miller & Ruiz, 2014). Among the first signs of a new wave of trans‐Arctic invasions were the arrival of a Pacific diatom in the Atlantic realm (Reid et al., 2007) and the increased activity of subarctic cetaceans in the Arctic regions (Alter et al., 2012; Clarke et al., 2013; Morin et al., 2010). Vermeij and Roopnarine (2008) argued that of the current Bering Sea molluscs, at least 77 taxa have the potential to expand their range to the North Atlantic within the next decades, even without direct human assistance. Nevertheless, the changing patterns of trans‐Arctic navigation will further contribute to restructuring of global boreal biodiversity, as has been amply evidenced by trans‐oceanic zoogeographical effects from more southerly maritime connections.
ACKNOWLEDGEMENTS
We thank all the individuals and institutions who participated or facilitated the collection of biological samples for this study, including Kira Regel, Todd Radenbaugh, Natalia Chernova, Andres Lopez, Heini Kujala, Petteri Lehikoinen, Andrey Voronkov, Marina Katolikova, Gita Paskerova, Natalia Shunatova, Evgeny Genelt‐Yanovsky, Alexey Sukhotin, Larisa Basova, Sergei Turanov, Anton Chichvarkhin, Yuri Kartavtsev, Igor Chereshnev, Alexey Tokranov, K. & N. Sanamyan, D. D. Danilin, Michael Zettler, Alexander Darr, Sally Sherman, Ocean Science Centre Logy Bay, WestWind SeaLab, Aberdeen Marine Laboratory (Marine Scotland), Dunstaffnage Marine Laboratory (ASSEMBLE framework), University of Washington Museum, and further colleagues and host organisations listed in Table S1. We thank Katja Nylund for contributions to the laboratory work, and John Wares, Thierry Backeljau and Kerstin Johannesson for feedback on the manuscript.
REFERENCES
Author notes
Data deposited at Dryad: https://doi.org/10.5061/dryad.zw3r22868
