


Abstract
The Mytilus complex of marine mussel species forms a mosaic of hybrid zones, found across temperate regions of the globe. This allows us to study ‘replicated’ instances of secondary contact between closely related species. Previous work on this complex has shown that local introgression is both widespread and highly heterogeneous, and has identified SNPs that are outliers of differentiation between lineages. Here, we developed an ancestry‐informative panel of such SNPs. We then compared their frequencies in newly sampled populations, including samples from within the hybrid zones, and parental populations at different distances from the contact. Results show that close to the hybrid zones, some outlier loci are near to fixation for the heterospecific allele, suggesting enhanced local introgression, or the local sweep of a shared ancestral allele. Conversely, genomic cline analyses, treating local parental populations as the reference, reveal a globally high concordance among loci, albeit with a few signals of asymmetric introgression. Enhanced local introgression at specific loci is consistent with the early transfer of adaptive variants after contact, possibly including asymmetric bi‐stable variants (Dobzhansky‐Muller incompatibilities), or haplotypes loaded with fewer deleterious mutations. Having escaped one barrier, however, these variants can be trapped or delayed at the next barrier, confining the introgression locally. These results shed light on the decay of species barriers during phases of contact.
Abstract

INTRODUCTION
Divergence between species is almost always accompanied by hybridization during phases of contact (Abbott et al., 2013), and so the study of speciation is intertwined with the study of introgression (Aeschbacher et al., 2017; Chaturvedi et al., 2020; Duranton et al., 2018; Gagnaire et al., 2018; Martin et al., 2019; Roesti et al., 2013; Schumer et al., 2018). The outcome of any given contact will depend on intrinsic and extrinsic factors. When barriers are weak, there can be massive introgression, leaving differentiation at only a few strongly selected loci. But even strong barriers can be rapidly crossed by adaptive alleles and flanking neutral variants (Barton, 1979a; Faure et al., 2008).
If some variation is bi‐stable (Barton & Turelli, 2011) such that one parental genotype is fitter, but heterozygous or recombinant genotypes are unfit, the spread of the fittest genotype is hindered at the barrier and thereby contributes to the barrier (Barton, 1979a; Barton & Bengtsson, 1986; Piálek & Barton, 1997). Stochastic processes, such as random drift or variable migration rates, can free the spreading wave of these variants one by one (Piálek & Barton, 1997). The overall result is a sequential decay of the species barrier. However, the process can be very slow, and so difficult to observe in action.
A promising system to study these processes is the Mytilus complex of marine mussels, comprising the three species M. trossulus, M. edulis and M. galloprovincialis. Current transoceanic isolation (e.g. East and West Atlantic in M. edulis and M. trossulus, Riginos & Henzler, 2008; Varvio et al., 1988) and ancient allopatry (e.g. Atlantic and Mediterranean lineages in M. galloprovincialis, El Ayari et al., 2019; Quesada et al., 1995) subdivides these taxa into infra‐specific lineages (Fraïsse et al., 2016; Simon et al., 2020). However, they are broadcast spawners with a dispersive larval phase, and so true geographic isolation is relatively rare. For this reason, the complex is divided by numerous post‐glacial hybrid zones, maintained by both intrinsic and extrinsic mechanisms of reproductive isolation (Bierne, et al., 2003; El Ayari et al., 2019; Fraïsse et al., 2016; Hilbish et al., 2012; Riginos & Cunningham, 2005; Strelkov et al., 2017). In particular, in the Northern Hemisphere all three species form a geographic mosaic delimited by many hybrid zones (Fraïsse et al., 2016).
This biogeographical history has two important consequences. First, contacts between similar lineages occur multiple times, and so we can observe the same species barrier in multiple demographic and ecological contexts (Abbott et al., 2013; Harrison & Larson, 2016; Simon et al., 2020). Second, with its narrow hybrid zones, combined with very long‐range admixture (Fraïsse et al., 2016), this complex provides us with a continuum of divergence between the interacting taxa. Precisely because of this heterogeneity, however, it is challenging to identify diagnostic loci for the Mytilus complex.
Recently, Fraïsse et al. (2016) captured 1,269 contigs from reference populations of the Mytilus complex. Using these data, they identified regions that were divergent between species and outliers of differentiation between populations of the same species. These intra‐specific outliers are significant in two ways. First, they can be used to identify individual lineages. Second, phylogenetic analyses of gene trees suggested that the majority of the outliers were due to local introgression between species, rather than local intra‐specific selective sweeps. As such, they provide information about introgression in the complex.
Here, we extend the analyses of Fraïsse et al. (2016). First, we built a SNP panel of a few hundred loci chosen from their outlier contigs and therefore enriched in highly differentiated markers. Having included intra‐specific outlier loci, we then examined their allele frequencies in a wider range of populations, allowing us to examine local introgression on a broader scale. Finally, we also sampled within hybrid zones and carried out genomic cline/concordance analyses (Gompert & Buerkle, 2011; Macholán et al., 2011). Our aim here was to test the effect of the choice of parental populations (local vs. distant) in the detection of discordant behaviour.
After verifying that our SNP panel is effective in identifying the lineages of interest, our results confirm that local introgression is both widespread in these Mytilus lineages and heterogeneous across the genome. At some loci identified as intra‐species outliers in Fraïsse et al. (2016), heterospecific alleles are sometimes fixed, or nearly so, in one parental patch close to a hybrid zone, whereas remaining nearly absent from other population patches farther from the zone. Genomic clines suggest high concordance among loci in the centre of hybrid zones, but only when local parental populations are used as reference. However, a few loci do depart from the genomic average and demonstrate moderate asymmetric introgression. Unlike outliers that exhibit enhanced local introgression at a large scale, the introgression of these genomic cline outliers does not extend outside of the hybrid zones where lineages coexist.
MATERIALS AND METHODS
Sampling
Mytilus spp. individuals were sampled from 58 locations, including several known hybrid zones (Figure 1, Table 1). Sampling sites are located on the American Pacific coast, the American and European North Atlantic coasts, and in the Mediterranean, Baltic, North, Barents and Black seas. We genotyped 441 individuals and extracted 72 genotypes by sequencing (GBS) from the published sequence data set of Fraïsse et al. (2016).

Definition of reference populations, classified by species level (L1), ocean basin or continent (L2), and regional groupings (L3). The ID column gives the population number referenced in Figure 1 and Table S1. Abbreviations used in the manuscript and figures are combinations of text in parentheses (e.g. edu_eu_north)
| L1 | L2 | L3 | Comment | ID |
| M. trossulus (tros) | America (am) | – | Saint Lawrence | 08, 09 |
| Europe (eu) | North (north) | Russia and Scandinavia | 18, 19 | |
| Baltic (baltic) | Baltic sea | 22 | ||
| Pacific (pac) | East (east) | From Californian coast | 01, 02, 05 | |
| M. edulis (edu) | America (am) | – | Long Island region | 10–17 |
| Europe (eu) | External (ext) | – | 26–28 | |
| Local (int) | – | 35–37 | ||
| North (north) | Russia and Scandinavia | 18, 19 | ||
| M. galloprovincialis (gallo) | Atlantic (atl) | External (ext) | – | 40–41 |
| Local (int) | – | 31–32 | ||
| Mediterranean (med) | West (west) | – | 51–54 | |
| East (east) | – | 55–57 | ||
| Black Sea (bs) | – | 58 |
Assay design
We aimed to genotype previously identified differentiated and outlier loci across a large number of samples in a cost‐effective manner. For this purpose, we used an Illumina BeadXpress assay with Veracode technology (GoldenGate Genotyping Assay). This method is based on the hybridization and PCR amplification of SNP‐ and locus‐specific oligos differentially bound to two different dyes. The genotype of an individual is provided by the relative fluorescence. We designed an assay of 384 SNPs (being the multiplexing limit of the technology).
Loci were selected, prior to genotyping, based on their differentiation either between species or between populations of the same species, using the published results of Fraïsse et al. (2016). Briefly, this database was produced via a target enrichment method on the three species and multiple populations of the Mytilus species complex (Fraïsse et al., 2016, http://www.scbi.uma.es/mytilus/index.php). It contains 1,269 contigs sequenced for 72 individuals from eleven different locations. Contig length ranges from 97 to 25,242 bp with a mean size of 3,389 bp and a cumulative length of 4.3 Mbp.
From the called genotypes of Fraïsse et al. (2016), markers with a minimum allele frequency of 0.05 and a maximum missing data percentage of 50 % computed on all individuals were retained. Coverage was estimated as a mean computed on three populations (two Atlantic M. galloprovincialis and one Atlantic M. edulis). Contig regions with especially high coverage (> 300 reads) were excluded to avoid repeated elements. Regions of the database produced from cDNA were blasted against a draft genome (Murgarella et al., 2016) to exclude regions close to intron/exon limits as flanking sequences in 3′ and 5′ of the target SNP were needed to design primers for PCR amplification. For the same reason, SNPs close to the start and end of the contigs were also excluded. An ADT score, produced by Illumina Assay Design Tool, quantifies the expected amplification success and was used to filter the SNPs with the most probable design success (ADT score > 0.4). FST was computed between pairs of populations and species such as those shown in Table 2. A first filtration step kept the 5 highest FST markers per contig for each comparison. We ensured a FST > 0.5 for all comparisons, except within edu_am and between gallo_atl and gallo_med where we used a FST > 0.4. Then, the six SNPs with the highest ADT scores per contig were retained. Finally, one SNP per contig and per category with the highest FST was selected (Table 2). Only for the M. trossulus comparison, the 70 SNPs with the highest ADT scores were retained. This SNP selection provides a final data set of 384 SNPs, balanced across comparisons (Table 2).
Number of SNPs per type of comparison. The SNP added to the data set (extra) corresponds to an introgressed amino‐acid changing variant (see main text). ‘all’ corresponds to the other populations
| Comparison | Number of SNPs genotyped | Number of SNPs retained |
| edu/all | 2 | 2 |
| edu_am/edu_eu | 39 | 22 |
| within edu_am | 17 | 5 |
| edu_eu/all | 51 | 16 |
| gallo_eu/all | 12 | 4 |
| gallo_atl/gallo_med | 27 | 17 |
| gallo/edu | 100 | 65 |
| gallo_med/all | 6 | 1 |
| tros_am/tros_eu | 34 | 12 |
| tros/all | 96 | 68 |
| Total | 384 | 212 |
Genotyping and filtering
Genotyping of the 441 individuals was performed with the BeadXpress (hereafter BXP) technology. Among the 384 SNPs genotyped, 252 were readable (clusters of homozygotes/heterozygotes well defined) and 132 were lost. This low rate of successful amplification is expected in such highly polymorphic species and because of our choice to retain only good quality SNPs. Forty additional SNPs were removed due to a differentiation between the BXP and GBS typing within populations. The threshold of missing data per SNP and per individual was set to 10 %. One marker (190) was rescued as the missing data were mostly due to low amplification in M. trossulus only (overall 12 % missing data). The genotypes for the 77 GBS individuals were retrieved from the calling in Fraïsse et al. (2016).
Two replicated individuals between the GBS and BeadXpress were present in the data set. They showed mismatch levels of, respectively, 2.83 % and 2.36 % between the two experiments, and this was due entirely to a well‐known heterozygote assignment bias in GBS experiments. The two replicated GBS individuals were removed from further analyses.
Three samples were removed from the analyses prior to filtering as they have already proven to be cancerous individuals (Riquet et al., 2017) (Por_40 from population 34; Arsud_05, Arsud_07 from population 38). Due to suspicious levels of M. trossulus ancestry in locations devoid of this species, which could indicate the presence of a transmissible cancer (Riquet et al., 2017), two additional samples from the Mediterranean sea were removed (MTP_05 and Collo_10 from populations 48 and 52, respectively). Filtering yielded a total of 514 individuals genotyped at 212 markers.
Reference populations were defined based on previous knowledge of the Mytilus species complex (Fraïsse et al., 2016; Simon et al., 2020). They are used first as a classification reference for newly genotyped individuals, to compute allele frequencies in analyses and to serve as parental populations. We used three levels of differentiation representing the species level (L1), the ocean basin or continent (L2) and regional groupings (L3) (Table 1). We used the GBS samples from Fraïsse et al. (2016) as references, and previously untyped individuals were assigned to a reference group if they belonged to the same GBS population or were geographically close to it. We used a preliminary Admixture analysis (v1.3.0; Alexander et al., 2009) at the species level (L1) using K = 3 and default settings (30 independent runs merged with CLUMPAK; v1.1; Kopelman et al., 2015) to correct the reference groups by removing inter‐specific migrants or hybrids, as sympatry and hybridization is a common phenomenon in the Mytilus species complex. Individuals assigned to those populations, and not filtered out, constitute the ‘reference data set’.
Hardy–Weinberg equilibrium was tested for the remaining markers within putative panmictic clusters outside of known hybrid zones (pegas 0.11, Paradis, 2010). Exact tests were performed using 1,000 bootstraps, and p‐values were adjusted for false discovery rate using the Benjamini–Yekutieli method (Benjamini & Yekutieli, 2001)..
We used a partial genetic map produced in Simon et al. (2020) based on an F2 cross between Mediterranean M. galloprovincialis and M. edulis, genotyped at a subset of the markers studied here (Bierne et al., 2002, 2006; Simon et al., 2018). In addition to this genetic map, we extrapolated genetic distances from physical distance for markers present on the same contig using a recombination rate of 2 cM/Mb (rounded from the estimate in Bierne, 2010).
Population structure
A principal component analysis (PCA) was performed using markers on different physical contigs (retaining the one with least missing data). This filtration was to avoid strong biases due to physical linkage and led to a final set of 160 markers. The genotype data were centred and scaled using the adegenet R package (v2.1.3; Jombart, 2008), with replacement of missing data by the mean allele frequencies. Following the PCA, a dimensional reduction method, UMAP (Diaz‐Papkovich et al., 2019; McInnes & Healy, 2018), was applied to the first 11 principal components. This threshold was chosen based on the expectation of 12 panmictic populations (level L3 of the reference groups, Diaz‐Papkovich et al., 2019). This method was performed using the python package umap‐learn (v0.3.9; McInnes & Healy, 2018) and the R wrapper package umap (v0.2.5.0; Konopka, 2019).
The Structure software (v2.3.4; Falush et al., 2003) was used to provide Bayesian estimates of ancestry with an admixture model. Structure was run with the admixture and linkage model (LINKAGE = 1). The data set was filtered with the following steps: (a) markers out of Hardy–Weinberg equilibrium were removed; (b) one marker per physical contig was retained (keeping the one with least missing data); and (c) the genetic map was used to produce linkage information for the retained markers, with the assumption that markers absent from the genetic map were unlinked (for lack of further information).
For the global Structure analysis, 20 independent Monte Carlo Markov Chains (MCMC) runs of 20,000 burn‐in iterations followed by 80,000 steps were performed to estimate model parameters for each K between 4 and 12. The standard deviation for the α prior was set to 0.05 for better mixing of the chains. The Clumpak software (v1.1; Kopelman et al., 2015) was used to investigate and aggregate Structure outputs with an Markov clustering (MCL) threshold of 0.9. Only major clusters are presented in the results.
Hybrid zone analyses
Each hybrid zone was defined by parent 1 (P1), parent 2 (P2) and central populations (Table 3). Each parental population was classified as either ‘local’ or ‘distant’, according to observed levels of introgression or geography. A local parental population is defined as a population close to the focal hybrid zone and being potentially subject to recent gene flow from the hybrid zone. A distant parental population is defined as a population distant from the hybrid zone, which has been less influenced by recent gene flow from it but can still have a substantial rate of established introgression due to past contacts. In a few cases, a local parental population was not available in our sampling design, and in these cases, a distant population was used instead (Table 3). Excluding the special cases of the Øresund and Scotland hybrid zones, ‘local’ references correspond to populations less than 250 km away from the central populations (in great circle distance). Similarly, ‘distant’ references are composed of populations more than 450 km away from the central populations.
Grouping of populations for each hybrid zone considered in this study. We consider parental populations (P1/P2) from either the distant or the local zone. See Figures 1–2 and Table S1 for population information. In the populations listed for parental groups, only the individuals representative of the focal group are retained (e.g. only M. edulis individuals in populations 18 and 19 in the Øresund analysis)
| Hybrid zone | Lineages | P1 distant | P1 local | Central | P2 local | P2 distant |
| Øresund | edu_eu/tros_eu_baltic | 18, 19 | – | 20, 21 | 22 | 08, 09 |
| Scotland | edu_eu/gallo_atl | 26–27 | – | 24 | 31, 32 | 40, 41 |
| Brittany | edu_eu/gallo_atl | 26–27 | 35–37 | 33, 34 | 31, 32 | 40, 41 |
| Aquitaine | edu_eu/gallo_atl | 26–27 | 35–37 | 38 | 39 | 40, 41 |
| Algeria | gallo_atl/gallo_med | 40, 41 | – | 42–50 | 51, 52 | 55–57 |
| edu_eu_north | edu_eu/edu_am | 26–27 | – | 18, 19 | – | 10–14, 17 |
For each hybrid zone, three analyses were carried out: (a) estimation of hybrid indexes with the R package introgress (v1.2.3; Gompert & Buerkle, 2010), (b) a local Bayesian clustering analysis using Structure and (c) a Bayesian genomic clines analysis.
Structure analyses for each hybrid zone used the same parameters as for the combined data set, and the admixture with linkage model. The filtration of markers was similar to the global analysis. Each subset was filtered for irrelevant genetic backgrounds in the hybrid zone studied. For example, in the Øresund hybrid zone we compare M. edulis (P1) and M. trossulus (P2). Therefore, M. trossulus individuals living in sympatry in the P1 populations were removed from this reference. Each hybrid zone was studied for a K of 2 and 3, to make sure there was no hidden substructure in the subset of individuals considered. The tros_am population was used as a distant reference for the Øresund hybrid zone, as the tros_eu_north population had a lower number of individuals and a higher level of missing data. In the North‐European M. edulis hybrid zone (Table 3), populations 15 and 16 of the edu_am reference population exhibited an increased introgression from European M. edulis and were removed (see section 3.1).
Genomic clines are used to detect markers deviating from the average genomic expectation given the distribution of hybrid indexes. The program bgc (v1.03) was used to estimate genomic cline parameters with a Bayesian method (Gompert & Buerkle, 2011, 2012) for each hybrid zone considered. Data sets were prepared with custom R scripts. For each hybrid zone, fixed markers were removed as they are uninformative. The same filtered marker sets as for the Structure analyses were used. Four independent chains of 200,000 iterations including 20,000 burn‐in iterations with a thinning of 20 were performed. We used the ICARrho model for linked loci with the previously generated genetic map. The R package rhdf5 (v2.32.0; Fischer et al., 2019) was used to read the MCMC outputs. Convergence was assessed using the method and R code of Vehtari et al. (2020).
For each hybrid zone, we performed two analyses called ‘local’ and ‘distant’ in which the local or distant parental populations are taken as references, respectively (Table 3). Both analyses consider the ‘central’ population as admixed.
We estimated locus‐specific posterior distributions for the cline centre (α) and rate of transition in ancestry along the admixture gradient (β) (Gompert & Buerkle, 2011). Non‐zero values of α shift the cline from the centre (negative values to parent 1 and positive ones to parent 2). β controls the steepness of the transition, with positive values inducing a steep cline and negative ones inducing a flattened cline. Loci were classified as having ‘excess ancestry’ for α or β if the 95 % quantiles of the posterior distributions did not include zero (as in Gompert & Buerkle, 2012).
RESULTS
We use a set of 212 differentiated and outlier markers to investigate the population genetics of several hybrid zones and other introgressed populations in the Mytilus species complex. We start by showing that our target species and populations are identifiable with our ancestry‐informative panel of SNPs. We also identify previously uncharacterized lineages or admixed clusters. Then, we analyse the differentiation and introgression patterns in the hybrid zones at two spatial scales.
Power of the SNP panel and clustering results
Our markers were taken from a previous GBS study (Fraïsse et al., 2016), and so we first tested if the markers were still informative in our broader sample. To do this, we correlated FST values between the complete data set (BeadXpress and GBS) and the GBS genotypes considered alone (Table S2). Results showed good delimitation (i.e. high FST correlations) between species and between known semi‐isolated lineages within a species (e.g. each side of the Atlantic ocean or the Almeria‐Oran front), whereas comparisons between less separated entities were less successful (i.e. low FST correlations). Overall, however, the assay design produced a strong enrichment in high FST markers compared to the distributions of Fraïsse et al. (2016), showing that our markers could differentiate the lineages of interest (Figure S1).
Although the markers are informative, another consequence of increasing the sample size was that truly diagnostic markers became rare or absent at the species level. Although our data set contained many differentiated loci as expected, only two markers showed fixed differences between species. Indeed, when considering all reference individuals of one species, only marker 147 was fixed between M. edulis and M. galloprovincialis (Contig H_L1_abyss_Contig244 position 6092) and only marker 015 was fixed between M. edulis and M. trossulus (Contig Contig17324_GA36A position 1089).
Using our SNP panel, five genetic clusters could be defined without ambiguity in a principal component analysis (Figure S2; and noting that the order of the PCs is not meaningful, due to our method of selecting SNPs). As shown in Figure 2 using a dimension reduction algorithm (UMAP), the three species are clearly differentiated, and so are known genetic clusters within each species: (i) European and American M. edulis, (ii) Atlantic and Mediterranean M. galloprovincialis, (iii) Baltic and American/North‐European M. trossulus. (Note that the placement of the clusters is not meaningful due to the UMAP algorithm). We observed that the Baltic population of M. trossulus (22) is introgressed by M. edulis, as previously described by Fraïsse et al. (2016), and this cluster can be identified with Structure at K = 8 (Figure 2).

Top: PCA‐UMAP using the first 11 principal components. The reference level L3 (Table 1) is colour and shape coded as in Figure 1. Note that this representation does not conserve distances and is designed to maximize groupings between similar entities, see Figure S2 for PCAs. Annotations show five groups of interest discussed in the main text: (A) North‐European M. edulis; (B) Oresund hybrid zone; (C) Brittany, Aquitaine and Scotland hybrid zones (D) Algerian hybrid zone and (E) the port of Cherbourg. Bottom: Ancestry composition of each individual in the data set obtained with Structure for the major mode of K = 5. Populations are mainly ordered geographically. See Table S2 for population information
The remaining individuals in Figure 2 form clouds labelled A to E and represent the various admixed populations we sampled (see also Figure S2). For example, the hybrid zones of Brittany, Aquitaine and Scotland all involve Atlantic M. galloprovincialis and European M. edulis, and all are found in group C (Figure 2). By contrast, the Algeria hybrid zone involves Atlantic and Mediterranean M. galloprovincialis, and corresponds to group D (Figure 2).
Group E contains a small set of individuals sampled in the leisure marina of Cherbourg in 2003, on the French coast of the English Channel (population 29). These individuals exhibit admixture largely between Mediterranean M. galloprovincialis (66 % ancestry) and European M. edulis (29 % ancestry). We note that a nearby population, in Barfleur (population 28, around 30 km from Cherbourg), is composed exclusively of European M. edulis, the expected local genetic lineage.
Group A comprises North‐European M. edulis. Those M. edulis individuals found in Russia (populations 18 and 19), in sympatry with M. trossulus, exhibit intermediate ancestries between South‐European M. edulis (edu_eu_ext and int) and the American lineage of M. edulis (edu_am; Figures 2, S4 and S5). Additionally, they do not differentiate on an independent axis on a classic PCA (Figure S2). The group defined as North‐European M. edulis does not exhibit visible introgression from the sympatric M. trossulus. Although two F1 individuals were found between the North‐European M. edulis and M. trossulus in population 19, the levels of introgression between these sympatric populations were not higher than those in the American populations. A similar admixture is also visible in the Edinburgh population (23), which has additional Atlantic M. galloprovincialis ancestry due to its localization close to the Scottish hybrid zone. Finally, group B corresponds to admixed individuals of the Øresund hybrid zone (populations 20–21) between the newly identified North‐European M. edulis and the Baltic M. trossulus (Figure 2).
The Structure analysis shows some further patterns. First, on the West coast of the USA (populations 01 to 07, Figure 2), we observe introduced Mediterranean M. galloprovincialis individuals, and a single F1 hybrid with the native M. trossulus parent (population 06). This is consistent with the report of Saarman and Pogson (2015).
Second, M. edulis samples from the Long Island region (USA, East coast, populations 10 to 16) were mainly assigned to the American M. edulis cluster (Figure 2), but there also appears to be some infra‐specific ancestry coming from Europe (already noticed by Simon et al., 2020). An analysis considering only M. edulis samples, Figure S4, shows more clearly that individuals from the most southern populations of the Long Island Sound (15, 16) sometimes have higher European ancestry than other American populations (e.g. Boston, population 17).
Genetic differences between patches of parental populations close to or distant from hybrid zones
We investigated the allele frequency differences between an intergradation of populations both between M. edulis and M. galloprovincialis (Figure 3), and between M. edulis and M. trossulus (Figure 4). This representation illustrates that outlier loci (identified by Fraïsse et al., 2016) between populations within parental species most often correspond to a high frequency of the heterospecific allelic state (defined on the basis of allele frequency differences between species) in the population close to hybrid zones: blue smudges (edulis allelic state) in M. galloprovincialis, red smudges (galloprovincialis allelic state) in M. edulis (Figure 3), blue smudges (edulis allelic state) in M. trossulus and green smudges (trossulus allelic state) in M. edulis (Figure 4). The discordance between populations close to and distant from hybrid zones is indicative of differential introgression (similar reasoning to the now well established Patterson's D or Reich's f3), but at a given SNP the allelic state is not informative of the ancestry, and so this observation can also be explained by an increased frequency of a shared ancestral allele. However, Fraïsse et al. (2016) used gene phylogenies to identify that roughly half of these outliers were the consequence of enhanced local introgression, whereas the other half was the consequence of a local selective sweep independent of introgression. Because the present study only uses strongly differentiated and outlier SNPs, we lack the neutral baseline required to re‐conduct outlier tests done by Fraïsse et al. (2016). Nevertheless, we confirm a strong signal that does not seem consistent with a fully neutral interpretation knowing the very low level of genetic differentiation between populations of the same species at the genome scale (Fraïsse et al., 2016).
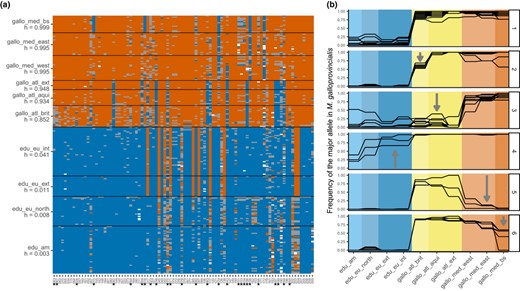
Visualization of introgression between M. galloprovincialis and M. edulis using the reference data set. (a) Plot of the raw genotypes. Orange: homozygous M. galloprovincialis; blue: homozygous M. edulis; grey: heterozygous. The orientation of alleles and mean hybrid indexes for each population (h) were computed with the R package introgress. The edu_eu_north population was taken as parent 1 (P1), and the gallo_med_east and gallo_med_bs populations were taken as parent 2 (P2). Loci identified by an asterisk are plotted in panels B2‐6. (b) Allele frequency of the M. galloprovincialis allele (G) for a few loci selected visually to exemplify six categories found in the data set: (1) loci informative between M. edulis and M. galloprovincialis; (2) introgression only in the local M. galloprovincialis Atlantic of Brittany; (3) introgression in all M. galloprovincialis Atlantic populations; (4) introgression in M. edulis European populations; (5) potentially old introgression only in the M. galloprovincialis Mediterranean; (6) potentially old introgression only in the M. galloprovincialis from the Black Sea
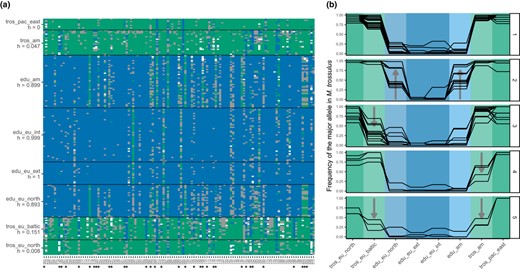
Visualization of introgression between M. trossulus and M. edulis using the reference data set. (a) Plot of the raw genotypes. Green: homozygous M. trossulus; blue: homozygous M. edulis; grey: heterozygous. The orientation of alleles and mean hybrid indexes for each population (h) were computed with the R package introgress. The tros_pac_east and tros_eu_north populations were taken as parent 1 (P1), and the edu_eu_ext and edu_eu_int ones were taken as parent 2 (P2). Loci identified by an asterisk are plotted in panels B2‐5. (b) Allele frequency of the M. trossulus allele (T) for a few loci selected visually to exemplify five categories found in the data set: (1) loci informative between M. edulis and M. trossulus; (2) introgression into M. edulis populations, either in both American and European or just one of them; (3) introgression into the Baltic M. trossulus population; (4) introgression into the East‐American M. trossulus population; (5) introgression into East‐American and Baltic M. trossulus populations, also showing a reduced introgression into the North‐European M. trossulus
The M. edulis‐M. galloprovincialis mosaic hybrid zones (Figure 3) can be seen as a large‐scale intergradation between the Mediterranean populations (starting in the Black Sea) and the North‐European ones. M. galloprovincialis populations are known to be more introgressed by M. edulis alleles in the Atlantic than the Mediterranean and our results confirm and illustrate this trend (see mean hybrid index, h, in Figure 3a). In addition, the local M. galloprovincialis population in Brittany (gallo_atl_brit), surrounded by two patches of M. edulis on either side (34–35 and 26–28, Figure 1), has a higher level of introgression than the local population in Aquitaine (gallo_atl_aqui). Interestingly, the Black Sea population (gallo_med_bs) displays a few fixed alleles with an M. edulis allelic state, contrasting with the rest of the Mediterranean basin (Figure 3a, B6). The South‐European M. edulis, both external and internal to the mosaic, have nearly as many smudges of M. galloprovincialis allelic state (Figure 3a, B4), and around half of these extend to Northern Europe.
For the M. edulis‐M. trossulus comparison, we investigated two intergradations, in America and Europe (Figure 4). American and North‐European M. edulis populations show introgression from M. trossulus, with shared patterns of heterospecific alleles. Those two populations share potential local introgressions (Figure 4a), and almost none are private to either population (though see marker 183 in Figure 4). Regarding introgression from M. edulis to M. trossulus, whereas the Baltic M. trossulus has been highly introgressed (exhibiting a mean hybrid index of h = 0.15), American M. trossulus shows lower levels of global introgression (mean hybrid index of h = 0.05).
Concordance in hybrid zones
The hybrid zones studied here involve four pairs of lineages, as listed in Table 3. We considered three types of populations: (a) ‘central’ populations, from the centre of the hybrid zone where two species or lineages coexist; (b) local parental populations (P1 and P2 local) on each side of the hybrid zone and impacted by recent hybridization; and (c) distant parental populations (P1 and P2 distant) which are not in direct contact with the focal hybrid zone and so potentially less affected by local introgression.
A genomic cline analysis is designed to identify loci that shift from the genome‐wide expectation on the basis of the multilocus hybrid index. Departure from the expectation is usually interpreted as evidence of selection (adaptive introgression, incompatibility or balancing selection). We posit that such analysis can strongly depend on the reference populations used in the analysis. Our outlier SNPs, for instance, should not appear as outlier in the genomic clines analysis if the local parental populations are used as references, but should if distant populations are used instead. We therefore contrast analyses done with different references.
As a general trend, the local genomic clines (Figure 5, middle panels) exhibited good convergence of the models in the Bayesian analyses ( close to 1, Vehtari et al., 2020) with a limited number of excess ancestry markers both for α and β. On the other hand, analyses with distant parental populations taken as reference (Figure 5, right panels) exhibited an increase in outlier loci. We note that certain new outliers may be false positives due to a reduced convergence between chains in the latter analysis. For instance, the Aquitaine genomic cline analysis using distant parental populations appears to be a failure of the algorithm, where not enough intermediate genotypes are present to correctly estimate the parameters.
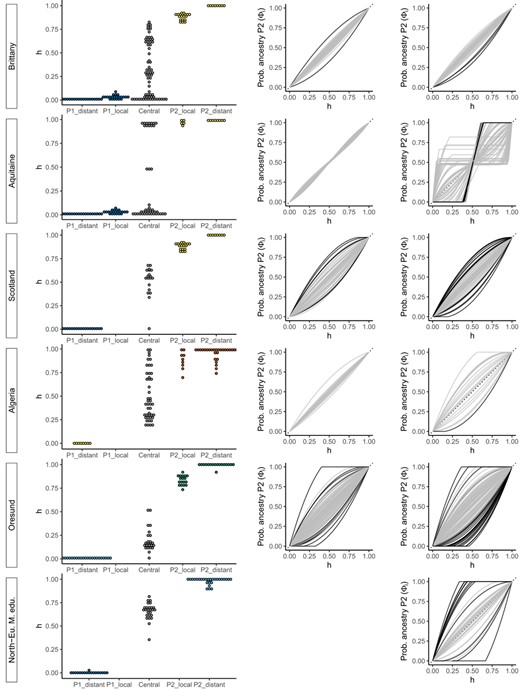
Left panels: Hybrid index (h) distributions from introgress, for each group of the hybrid zone. Middle panels: Genomic clines computed with the local parental groups (P1_local, P2_local or distant when not available) with clines presenting a significant excess in either α or β parameters highlighted in black. Right panels: Genomic clines computed with distant populations as parental groups. For genomic clines, only markers with an allele frequency difference > 0.3 between P1_distant and P2_distant are drawn. The probability of the locus‐specifc ancestry for P2 against the genome‐wide hybrid index (h) is plotted. When distant parental populations are used in place of local ones, the number of discordant loci increases. See Table 3 for a list of the populations used in the analyses
Three hybrid zones, in Brittany, Aquitaine and Scotland, involve contact between South‐European M. edulis and Atlantic M. galloprovincialis (Figure 5, Figures S6–S8). The Brittany and Aquitaine zones are on one side of a patch of South‐European M. edulis on the French Atlantic coast (Bierne, et al., 2003). Nevertheless, these two zones exhibit strong differences in their hybrid index distributions, and this is reflected in their genomic clines (Figure 5). On one hand, Brittany presents a broad distribution of hybrid types between the two parental populations and a local M. galloprovincialis parental population that is introgressed (P2_local, Figure S6). On the other hand, Aquitaine presents only three F1 hybrids between the two parental types and the local M. galloprovincialis population (P2_local, including some individuals in sympatry with the M. edulis P1_local population) does not present strong introgression compared with the distant population (P2_distant) (Figure S7). In Scotland, the central population exhibits variable hybrid indexes and so resembles Brittany more than Aquitaine (Figure 5 and Figure S8). The genetic composition of local M. edulis and M. galloprovincialis populations in Scotland is largely unknown. However, the only M. edulis individual sampled in population 24 is indiscernible from the edu_eu_ext references (Figures 2 and 5).
The Algerian hybrid zone was sampled most extensively (El Ayari et al., 2019). As previously shown with 4 markers (El Ayari et al., 2019), the distribution of hybrid indexes is wide, and the zone of coexistence of the two lineages extends to around 600 km (Figure 5 and Figure S9). We did not sample Atlantic M. galloprovincialis populations close to this zone (P1_local). If the local population and hybrid zone were harbouring local introgressions, we would have expected discordant loci when using the P1_distant population as parental. As only one locus was shifted and not significantly, we can hypothesize that the local population of Atlantic M. galloprovincialis is not heterogeneously introgressed by the Mediterranean M. galloprovincialis.
The Øresund hybrid zone includes the North‐European M. edulis lineage (Figure 2, populations 20–21). Therefore, we treated such individuals from Russia as the P1 parental population. In this zone, the central population exhibits relatively homogeneous hybrid indexes and is mainly composed of North‐European M. edulis introgressed by M. trossulus (Figure 2 and Figure S10). On the other side of the hybrid zone, the Baltic M. trossulus population is introgressed as shown above (Fraïsse et al., 2016; Väinölä & Strelkov, 2011; Figures 4 and 5).
To highlight the intermediate character of the North‐European M. edulis lineage, we carried out an analysis treating the North‐European M. edulis individuals as admixed in the Russian populations (18 and 19, Figure S5). As shown by the hybrid index and the Structure analyses, these mussels have a homogeneous admixture of around 60 % South‐European M. edulis and 40 % American M. edulis.
When finally considering the correlation of genomic cline parameters (α and β) between hybrid zones, only two correlations proved statistically significant after correcting for multiple tests. The correlated parameters are α and β between the Scotland and Brittany local hybrid zone (Permutation tests of the Spearman correlation coefficients ρ = 0.38 and ρ = 0.36, respectively, with p‐values < .005 using 104 permutations), and β between the Brittany and Aquitaine hybrid zones (ρ = 0.38, p‐value = .002).
DISCUSSION
Mytilus mussels are genetically differentiated, but fixed differences are extremely rare
One aim of this study was to develop a panel of highly differentiated, and potentially diagnostic markers for the Mytilus complex in the Northern Hemisphere. To this end, we started with 51,878 high‐quality SNPs from 1,269 sequences (Fraïsse et al., 2016) and selected SNPs with the greatest discriminatory power. We combined differentiated variants between species with intra‐specific FST outliers to provide a more detailed identification. This procedure was successful, in that we were able to discriminate not only individuals of the three species (M. edulis, M. galloprovincialis and M. trossulus) but also partially isolated genetic lineages within species (European and American M. edulis; Atlantic and Mediterranean M. galloprovincialis; and Baltic and American/North‐European M. trossulus; Figure 2).
Nevertheless, of 92 highly differentiated loci between M. edulis and M. galloprovincialis (Figure 3), only one was a fixed difference in our sample. Similarly, there was only one fixed difference among 125 highly differentiated loci between M. edulis and M. trossulus (Figure 4). All the other SNPs were found at least once in heterozygous state (grey squares in Figures 3 and 4) and even sometimes as heterospecific homozygotes. Our approach highlights that loci originally claimed to be diagnostic are likely to loose their diagnostic status in a large‐scale assay.
Similar failures of diagnostic loci in Mytilus have already arisen for the widely used Me15/16 marker (also known as Glu‐5') where the ‘E’ allele was observed in M. galloprovincialis (Bierne, et al., 2003; Borsa et al., 1999; Hamer et al., 2012; Wood et al., 2003) and the ‘G’ allele in M. edulis (Bierne, et al., 2003; Kijewski et al., 2009; Luttikhuizen et al., 2002). In Mytilus mussels, therefore, it seems prudent to replace single marker diagnosis with multilocus inference, and our results suggest that 5–10 well chosen loci should be sufficient for this purpose, but not less.
It is unlikely that this situation is unique to mussels. In the highly divergent Ciona tunicate species, C. robusta and C. intestinalis, loci initially assumed to be diagnostic and used to identify hybrids (Bouchemousse et al., 2016; Nydam & Harrison, 2011; Sato et al., 2014) were subsequently found to harbour shared polymorphisms in a multilocus analysis, and heterozygous genotypes were found in parental populations, both at the initially studied markers and at many of the newly designed markers (Bouchemousse et al., 2016). As for the Mytilus system, Ciona species have very high nucleotide diversities and have been shown to go through a history of secondary contact (Roux et al., 2013) resulting in a higher proportion of high frequency derived alleles either shared between populations or private to one population (i.e. top left and bottom right of the unfolded joint allele frequency spectrum) than expected for well isolated and low Ne species.
Enhanced local introgression is widespread and has several possible causes
A notable feature of our data was the appearance of heterospecific alleles that were present at high frequency in one or a small number of populations. These alleles were very common (at least one such allele was found in each population of each lineage of all three species), but were found heterogeneously across the genome (Figures 3 and 4).
Fraïsse et al. (2016) also found this pattern, in their much smaller sample. Furthermore, their use of genome‐wide data, combined with analyses of gene‐genealogies, suggested that the pattern was due to local introgression, rather than, say, incomplete lineage sorting (e.g. the local sweep of a shared ancestral variant). Although our data do not allow us to distinguish between these possibilities, and although both have no doubt taken place, our use of the data of Fraïsse et al. (2016) to choose our SNPs, combined with the finding that these alleles are preferentially found in contiguous populations (Figures 3 and 4), strongly suggest high levels of local introgression in the Mytilus complex (Fraïsse, et al., 2018; Fraïsse, et al., 2018).
The biogeography of the complex also allowed us to study introgression of a very particular kind: the M. galloprovincialis/M. edulis transition is characterized by near‐continuous intergradation between the Black Sea and Scandinavia, but with genetic barriers to gene flow at multiple points. This leads to a mosaic distribution in several regions. For example, the isolated M. edulis and M. galloprovincialis patches on the Atlantic coast of France are separated by three hybrid zones, in Aquitaine, South Brittany, and Normandy (not sampled in this study) (Bierne, et al., 2003; Hilbish et al., 2012). This structure revealed multiple instances of enhanced local introgression, that is, introgression events that are localized both genomically, and geographically, with allelic variants crossing one barrier to gene flow, but halted at a subsequent barrier (Figure 3).
Three possible mechanisms could explain the heterogeneity of local introgression. First, introgression could be adaptive (Hedrick, 2013; Pardo‐Diaz et al., 2012; Racimo et al., 2017; Staubach et al., 2012). In this case, the fact that introgression was halted at a subsequent barrier could be explained either by an environmental difference (such that the allele was only locally beneficial), or by a very strong barrier (in which case the halting would be transient). However, Fraïsse et al. (2016) found no clear links between the biological function of outlier genes and the environmental conditions of introgressed populations. Alternatively, if the markers are not the direct target of selection—as seems highly plausible (Fraïsse et al., 2016)—a marker might hitchhike through one barrier, but be halted at a second (Barton, 2000; Faure et al., 2008).
A second possibility is that introgression acts to reduce genetic load in the recipient population (Harris & Nielsen, 2016; Juric et al., 2016; Kim et al., 2018). This scenario is similar to adaptive introgression, but emphasises the role of deleterious mutations in the recipient population rather than advantageous mutations in the donor population.
Third, and finally, introgression could involve bi‐stable variants in a tension zone (Barton & Hewitt, 1985). Such variants can individually move via an asymmetry in parental fitness, that is when one parental genotype is fitter than the other and both are fitter than hybrids (Barton, 1979a; Barton & Turelli, 2011). However, they can easily be trapped for long periods by a density trough, a barrier to dispersion and coupling (Barton & Turelli, 2011; Bierne et al., 2011, see El Ayari et al., 2019 for a possible example in Mytilus). This scenario also implies transience in the structure, because tension zones can move due to genetic drift or changes in the environmental conditions (Piálek & Barton, 1997). In other words, rare stochastic events can free the ‘pushed’ wave of advance (Piálek & Barton, 1997). This hypothesis was already proposed in Mytilus by Fraïsse et al. (2014) and has also been proposed for other systems such as Bathymodiolus mussels (Plouviez et al., 2013), sea bass (Duranton et al., 2020), killer whales (Foote et al., 2019) and house mouse (Macholán et al., 2008).
High overall concordance of barrier loci at hybrid zones
With high levels of local introgression, it can be difficult to study genomic clines. With our data, this was evident in the occasional failures of our cline analyses, for instance in the Aquitaine hybrid zone. Nevertheless, in most cases these analyses yielded clear results: a high level of concordance with respect to local parental populations (Figure 5 middle panels) and increased discordance with respect to distant parental populations (again, consistent with local introgression).
Even with local parental populations, we observed a few SNPs that deviated from the genomic average. The anomalous ‘excess ancestry’ loci observed in Scotland and Øresund in the local analysis could still be a consequence of enhanced local introgression, as P1_local populations were missing from our sampling. Nonetheless, deviating loci are still observed, for example in Brittany (Figure 5). These loci tend to introgress more than the others in the centre of the zone, but—unlike established introgression—have not escaped the genetic barrier. We suspect that these loci might contribute to bi‐stable variation that is asymmetric, as described above, but with a lower fitness difference between parental genotypes.
Genomic cline outliers with asymmetric introgression are often interpreted as evidence of adaptive introgression, that is directional selection (Gompert & Buerkle, 2009). Our results support directional selection in the centre of the hybrid zones, but not in flanking parental populations. If a force is opposing the spread of the adaptive variant from a barrier, it could be selection against heterozygous or recombinant hybrid genotypes (Barton, 1979b).
Finally, the observation of a small but sometimes significant correlation of the genomic cline parameters can point us to parallel processes that may be at play in the hybridization of Mytilus species. Here, correlations were only found in hybrid zones implicating the same species and lineages. However, Simon et al. (2020) already showed that parallel deviations in admixed populations of mussels exist, and that it can also sometimes happen between different lineages. Such cases call for further investigations of potential selective effects in the regions of the studied markers, either due to positive selection or barrier loci.
The timing and context of introgressions
Given the heterogeneity in the introgression patterns we have observed, it seems likely that they were shaped by both contemporary contacts, and historic contacts during the Quaternary period (Hewitt, 2000).
In some cases, our data allow us to make inferences about the timing of specific introgression events. For example, local introgression of M. edulis alleles into M. galloprovincialis from the Black Sea and Mediterranean is consistent with ancient contacts between these populations (Fraïsse et al., 2016; Gosset & Bierne, 2013). The two private introgressions into the Black sea were nevertheless unexpected. Fraïsse et al. (2016) did not sample these populations, and so our data set was not enriched for discriminatory SNPs. Therefore, such introgressions might be quite numerous in the rest of the genome.
By contrast with these putatively ancient introgressions, it is likely that the private introgressions found in M. galloprovincialis from Brittany (Figure 3a, B2) are relatively recent. This is probably because, given its position enclosed in the mosaic, this population only became established after the last post‐glacial period.
More recently still, it is likely that the admixed individuals between Mediterranean M. galloprovincialis and South‐European M. edulis, observed in the port of Cherbourg represent a recent human‐mediated introduction. Similar admixed individuals have been observed in other ports in the English Channel and French Atlantic coast (Simon et al., 2020), where these ‘dock mussels’ form small‐scale hybrid zones with the native lineages outside of the port.
In one final case, shared introgressions allow us to make inferences about the historical biogeography of the Mytilus complex. In particular, we found that several introgressions from M. trossulus to M. edulis were shared between M. edulis populations in Northern Europe and America, and the most parsimonious explanation is that these introgressions predated their split. This hypothesis sheds light on the origins of the North‐European M. edulis population. We have shown that this population is differentiated from both American, and South‐European M. edulis, and appears as intermediate in the PCA (Figure S2), Structure (Figure 2 and Figure S5) and hybrid index analyses (Figure 5). This observation previously made in Simon et al. (2020), has recently been confirmed by Wenne et al. (2020). Given its presence as the parental M. edulis population in the Øresund hybrid zone, and the complete absence of American ancestry in the Netherlands, the border between Southern and Northern European M. edulis probably falls somewhere near to the Danish coast (see also the previously observed differences between the North Sea and populations North of the Kattegat region; Bierne et al., 2003; Stuckas et al., 2009). Given the shared introgressions, therefore, the contemporary biogeography could reflect a recolonization of America after the last glacial maximum, by a proto‐North‐European M. edulis, which was later introgressed by the South‐European M. edulis (Wares & Cunningham, 2001). Alternatively, American M. edulis, having survived in a refugium (Riginos & Henzler, 2008), might have colonized the North Atlantic and Scandinavia, and then been introgressed by the South‐European M. edulis in Europe. Finally, although North‐European M. edulis and M. trossulus live in sympatry in several locations around Scandinavia and northern Russia (this study; Katolikova et al., 2016; Simon et al., 2020), our analyses show that introgression is not higher than in American populations.
Implications for speciation research
The Mytilus species complex is characterized by diverse levels of genetic differentiation between lineages and species, and by pervasive introgression due to a dense history of secondary contacts and mosaic geographical distribution. As such, it constitutes a powerful model to investigate the maintenance of species barriers in the marine environment. Based on our results and previous studies (Bierne, et al., 2003; Fraïsse et al., 2016), we suggest that secondary contacts are not only periods of neutral introgression, but also periods during which genetic incompatibilities can be swamped resulting in a punctuated decay of the barrier to gene flow. This vision is rooted in the observation that gene flow after secondary contacts in the Mytilus complex is shown to be heterogeneous along the genome (Fraïsse, et al., 2018; Roux et al., 2014, 2016). In regions of higher gene flow, some alleles have locally introgressed. Those can either be missed when distant parental populations are not taken into account, or observed and interpreted as local adaptive introgression. Another explanation exists, considering that bi‐stable variants, which could be associated with or responsible for genetic incompatibilities, can punctually escape a zone of coupling. Overall, our results suggest that asymmetrical parental fitness differences may enhance introgression at some regions of the genome yet successive barriers can prevent or delay propagation.
ACKNOWLEDGEMENTS
Data used in this work were partly produced through the genotyping and sequencing facilities of ISEM and LabEx CeMEB, an ANR ‘Investissements d'avenir’ program (ANR‐10‐LABX‐04‐01) This project benefited from the Montpellier Bioinformatics Biodiversity platform supported by the LabEx CeMEB. We thank Norah Saarman, Grant Pogson, Célia Gosset and Pierre‐Alexandre Gagnaire for providing samples. This work was funded by a Languedoc‐Roussillon ‘Chercheur(se)s d'Avenir’ grant (Connect7 project). P. Strelkov was supported by the Russian Science Foundation project 19‐74‐20024. This is article 2020‐240 of Institut des Sciences de l'Evolution de Montpellier.
Peer Review
The peer review history for this article is available at https://publons.com/publon/10.1111/jeb.13709.
DATA AVAILABILITY STATEMENT
All data and scripts for analyses are available in the Dryad archive https://doi.org/10.5061/dryad.r4xgxd29n.
