


Abstract
Extensive research reveals gender gaps in social media expression, particularly women’s reduced propensity for sharing political information and opinions. We examine the impact of political defeat on the gender gap in political expression on social media by pairing Twitter data from candidate supporters with a voter file. Our results indicate that Trump’s 2020 defeat reduced tweet volumes only among his female supporters, while his male supporters remained unaffected. This dampening effect was stronger for female Trump supporters who expressed their gender identity in their Twitter bios than those who did not. Tweet content remained largely unchanged for both genders. These findings enhance our understanding of how social media and political defeat together contribute to the gender expression gap and its relationship with offline political behaviors post-defeat. They also demonstrate the power of our methodological approach in revealing temporal and individual differences.
Lay Summary
Many studies demonstrate that women are less likely than men to talk about and participate in politics in digital spaces. This study asks how the gender gap in political expression on social media is affected by a significant life event: political defeat. We hypothesize that women’s psychological traits and social media’s digital architecture worsen the blow that political defeat deals to women supporters of losing politicians. Our empirical analysis combines Twitter data with voter records to track changes in the online activity of supporters of winning and losing political campaigns. The results show that only female Trump supporters experienced a steep drop in the volume of tweets they posted after Trump’s defeat in the 2020 U.S. general election. This tendency was more pronounced among female Trump supporters who displayed their gender identity in their Twitter bios. However, the content difference of tweets was minimal and did not change much after defeat. Our findings provide a new window into understanding how the gender expression gap is affected by both social media and political defeat as well as shed light on how women and men respond to political defeat offline differently.
Gender disparities in politics have been extensively documented, with women exhibiting lower political interest, knowledge, and participation levels than men (e.g., Burns, 2007). These gaps extend to online spaces, manifesting in women’s lower propensity to share political information and express political opinions on social media and in news websites’ comment sections (e.g., Bode, 2017; Peacock & Van Duyn, 2023).
This article explores the impact of political defeat, the loss of one’s preferred candidate in an election (Shaffir & Kleinknecht, 2005), on the gender gap in political expression. The 2016 and 2020 U.S. presidential elections highlighted how such defeats can influence democratic participation. Post-2020, Trump supporters attacked the U.S. Capitol (Luke, 2021). Although not as direct of an attack on democracy, mass protests broke out after Hilary Clinton’s defeat in 2016. While liberal women mobilized en masse during the Women’s March following Clinton’s defeat (Fisher et al., 2017; Weber et al., 2018), only 13% of the arrested Capitol rioters were women (Matfess & Margolin, 2022), indicating a gender disparity in reactions to those electoral losses. Hence, the question of how political defeat affects the gender gap in political expression online not only speaks to the potentials and limitations of digital media in fostering women’s and men’s participation but also sheds light on their different offline political behaviors in response to political defeat and other significant life events.
We collected data from Twitter, a social media platform central to political expression and political participation (Gil de Zúñiga et al., 2014; González-Bailón et al., 2011). We first combined previously identified communities of supporters of losing and winning political candidates in the United States (including Trump, Sanders, and Biden supporters) with voter file data to add gender information for each supporter.1 Then, we applied multi-level growth modeling (Grimm et al., 2016) to analyze women’s and men’s expression levels and content before, during, and after defeat. We provide novel methods for researchers to investigate the temporal dynamics of online communication while accounting for individual differences, enhancing existing survey-based research on the gender gap and political defeat.
Literature review
Gender gap in political expression offline and online
Political expression, offline and online, is “the soul of democracy.” It produces positive psychological effects, promotes understanding of diverse viewpoints, spurs political participation, and shapes democratic decision making (González-Bailón et al., 2010; Shah, 2016). Yet, women are less involved in political discussions than men (Beauvais, 2020; Karpowitz et al., 2012; Nir & McClurg, 2015). This disparity is part of a broader gender gap: globally, women show less interest in politics (Verba et al., 1997; Wolak & McDevitt, 2011) and are less involved in institutional politics, such as joining parties, interacting with politicians, or attending public events (Desposato & Norrander, 2009).
Research offers three explanations for gender disparities in politics. First, socialization: from a young age, men and women are taught social roles and gender norms that later reinforce the belief that politics is male dominated (Bos et al., 2022; Fraile & Sánchez-Vítores, 2020; Verba et al., 1997). Second, situational differences: women often have fewer resources like education and income but more family responsibilities that divert attention from politics (Burns, 2007; Verba et al., 1997). Third, psychological factors: women generally show less enjoyment in contention, tend to avoid conflict, and have lower self-confidence, which diminishes their political interest, attention, and efficacy (Preece, 2016; Wolak, 2020, 2022).
In contemporary society, social media has prevailed as a source of political information, social interaction (Diehl et al., 2016), campaign communication (Kreiss, 2016), and collective action mobilization and coordination (González-Bailón et al., 2013). Though it offers egalitarian access and participation (Xenos et al., 2014), it can amplify the gender gap in political expression. Men more frequently engage with political content and more visibly express opinions online (Brandtzaeg, 2017; Bode, 2017; Vochocová et al., 2016), while women are less likely to engage in highly public or risky online activities (Bode, 2017; Brown et al., 2018). This difference is partly due to psychological factors like men’s higher perceived efficacy and women’s focus on agreeableness and conflict avoidance (Bode, 2017; Schumacher & Morahan-Martin, 2001). A recent survey indicates minimal gender differences in political activities on platforms like Facebook and Twitter but highlights internal efficacy as a barrier to women’s active participation (Lilleker et al., 2021). Gender role socialization, promoting a view of men as political and women as communal, furthers women’s reluctance to visibly express political opinions online (Bode, 2017; Peacock & Van Duyn, 2023).
The technological design of social media also contributes to the gender gap. Just as procedural design can shape gender expression disparity in public deliberation offline (Karpowitz et al., 2012), social media also molds online expression patterns. Its digital architectural designs likely widen the gender expression gap. Social media platforms shape gender perceptions of users through “design decisions” (e.g., gender classification on sign-up pages) and “demographic targeting” (Bivens & Haimson, 2016). Social media algorithms customize content streams by inferring users’ gender, which can be error-prone, especially for non-binary people (Fosch-Villaronga et al., 2021). Social media can “enact culture by managing and shaping the construction and meaning of identity categories like gender” (Bivens & Haimson, 2016, p. 7), fostering gendered social media use (Horvát & Hargittai, 2021; Schwartz et al., 2013).
Lastly, social media is a hostile climate for women, where they receive gender-based harassment and attacks and become more unwilling to speak up (Koc-Michalska et al., 2021; Southern & Harmer, 2021). Online harassment against women has a greater silencing effects on women than on men, especially when the harassment targets women’s gender identity (Nadim & Fladmoe, 2021) via a greater sensitivity to uncivil comments than men (Kenski et al., 2020). However, an analysis of Facebook comments shows that though women comment less, they post more civil comments and are not disproportionately punished for their uncivil ones (Küchler et al., 2023).
Methodologically, research on the gender gap in online political expression mainly relies on survey research, with some leveraging social media comment data. Some findings are contradictory. For example, while one study shows that men are more likely to “like” political information (Brandtzaeg, 2017), other studies provide no such evidence (Bode, 2017; Vochocová et al., 2016). This study investigates the gender gap in political expression using social media data and computational methods, which allow granular and temporal analysis. More importantly, we build on prior research by considering psychological, technological, and social factors while extending the work by introducing the exogenous factor of offline external events, given how they can rewire online communication dynamics (Gong et al., 2023; Hebbelstrup Rye Rasmussen & Petersen, 2023). Specifically, we ask if political defeat, as a consequential offline external event, compounds the gender gap in political expression on social media.
The impact of political defeat on the gender gap in political expression on social media
Political defeat, when one’s preferred candidate loses an election, significantly influences politics and social movements (Mirer & Bode, 2015; Shaffir & Kleinknecht, 2005). It impacts supporters’ democratic satisfaction, political trust, and views on electoral reform (Anderson & LoTempio, 2002; Bowler & Donovan, 2007; Hansen et al., 2019). While some research indicates increased mobilization among supporters of defeated candidates (Anderson & Mendes, 2006; Bilali et al., 2020; Esaiasson, 2011), the effect of defeat on social media political expression is less clear.
This relationship between defeat and social media expression is important because political defeat directly affects political protest behavior post-defeat (Anderson & Mendes, 2006), a relationship that can be mediated by political expression that spreads across online networks on social media (González-Bailón et al., 2011; Jost et al., 2018). For those who express themselves on social media, their political expression on social media contributes to their offline participation (Gil de Zúñiga et al., 2014; Vaccari et al., 2015; Wojcieszak, 2009; Yamamoto et al., 2015). Mere exposure to political expression also increases participation in offline settings (Bond et al., 2012; Kim & Ellison, 2022; Tang & Lee, 2013).
Post-defeat, supporters may intensify online political expression to show solidarity or dispute election outcomes, potentially leading to heightened affective polarization and offline anti-democratic behaviors, especially in the absence of conciliatory messages from political leaders (Anderson et al., 2005; Chernykh, 2014; Lawall et al., 2023; Esaiasson et al., 2023). Conversely, political defeat might also reduce political expression and participation due to diminished confidence or satisfaction with democracy (Nadeau & Blais, 1993). Therefore, we first ask whether political defeat leads to a lower level of expression or not on social media (RQ1).
Next, we examine how offline political defeat affects the online gender gap. Here, one must distinguish between the absolute levels of the expression of men and women and the relative change in expression after defeat. As discussed above, women may face higher thresholds for participating in political expression due to psychological, technological, and social factors, which could manifest as lower baseline levels of expression compared to men (Bode, 2017; Peacock & Van Duyn, 2023; Lilleker et al., 2021). Therefore, the relative change in expression of men vs. women indicates how political setbacks can amplify or mute the existing gender gap in political expression. If defeat boosts discourse, women’s increased participation may be subdued due to higher initial barriers. Conversely, if defeat suppresses expression, women’s participation might decline more, due to their greater concern over the costs of political engagement. Therefore, we hypothesize that political defeat exerts a weaker mobilization effect or a stronger dampening effect on women’s expression than men’s (H1).
Women who prominently express their gender identity on social media, such as through Twitter bios, may face enhanced suppression of expressiveness following defeat. This phenomenon is anchored in gender identity as a social identity (Tajfel & Turner, 2004), which colors cognitive processes and affects behaviors online and offline (Rathje et al., 2021; Van Bavel & Pereira, 2018). Social media’s flexible nature allows for varied expressions of gender identity, shaped by social norms and audience perceptions (Kapidzic & Herring, 2015). Recently, expressing one’s gender identity on Twitter profiles has become more prevalent, with tweets from posters that used she/her and he/him pronouns increasing by 11 times and 20 times, respectively, between 2017 and 2022 (Rogers & Jones, 2021; Tucker & Jones, 2023).
The expression of gender identity online can promote gender-norm-consistent behaviors. This understanding is informed by the Social Identity model of Deindividuation Effects (SIDE), which suggests that operating behind a username in computer-mediated communications can enhance the salience of social identities, leading to group norm conformity (Spears et al., 2002). This effect is seen in online behaviors, including political discussions (Rains et al., 2017). In this study, female supporters of campaigns who express their gender identity in Twitter bios may alter their online expressiveness to conform to traditional gender norms after electoral defeat.
Furthermore, adopting a gendered perspective, female users, often subjected to patronizing speech, incivility, and harassment online (Kenski et al., 2020; Koc-Michalska et al., 2021; Nadim & Fladmoe, 2021), may be more impacted by a hostile social media environment. In this generally unwelcoming environment, political defeat, possibly construed as a rebuke to one’s identity and an attack on one’s esteem (Tajfel & Turner, 2004), might be more strongly felt by those whose gender identity remains salient. Therefore, we hypothesize that women who express a gender identity exhibit lower levels of political expression after political defeat than women who do not on social media (H2).
In addition to examining expression levels before and after defeat, the content of the expression may also change. Therefore, we ask how the content of men’s and women’s expression changes after defeat on social media (RQ2). We investigate three Twitter content aspects: amplification of community members, candidate interaction, and populist language use. Amplification reflects in-group support during adversity (Halevy et al., 2008). Candidate interaction, a common supporter activity, shows allegiance (Zhang et al., 2018). Populist language use is examined because of supporters’ lower democratic satisfaction, trust, and support for electoral reform following the political defeat (Anderson & LoTempio, 2002; Bowler & Donovan, 2007).
Methods
Data
We collected data from Twitter because this platform played a vital role in American politics before being acquired by Elon Musk and rebranded as “X.”2 Offering real-time communication and information dissemination, Twitter has been integral to political campaigns, policymaking, and public opinion formation (Bode et al., 2014; González-Bailón et al., 2011, 2013). Twitter remains one of the most studied social media platforms (Lukito et al., 2023), but X’s reduced academic data access policy may result in fewer studies about the platform.
User data
Specifically, we identified relevant Twitter users from an existing dataset, which contains tweets collected daily from “homogeneous, interactive, and stable” groups (what they call “flocks”) of political opinion leaders (Zhang et al., 2022). These groups were identified in two steps: (a) selecting seed accounts (including prominent news media, journalists, activists, and political pundits) and conducting targeted sampling (using the personalized PageRank algorithm) of politically relevant opinion leaders and (b) applying the Vintage Sparse Principle component analysis, based on who follows whom, to identify groups of similar accounts and select the most representative accounts from each for tweet data collection.
We used three groups in our analysis, each representing Trump ( = 1,094), Sanders ( = 734), and Biden ( = 858) supporters who sent at least one tweet during our total data collection period (December 2, 2019, to July 1, 2021). We primarily analyze Trump supporters from the “#MAGA” flock, as Trump suffered the most prominent recent political defeat during the 2020 U.S. Presidential Election which led to political unrest. We compared Trump supporter’s level of expression to a winning group, the “#UniteBlue” flock of mainstream/moderate Democrats who likely supported the more traditional Democratic candidate Joe Biden. Including a baseline group is important because it controls for the potential general cooling effect of the conclusion of an election on the volume of tweets sent from supporters of both the winning and losing campaigns.
Given that conservatives and liberals exhibit diverging psychological traits and political behaviors offline and online (Dahlke & Hancock, 2022; Grinberg et al., 2019; Jost et al., 2018), we also analyzed Bernie Sanders supporters during Sanders’s 2020 U.S. Democratic presidential primary election via the “Bernie Bros” flock, to avoid ideological overgeneralization. This group was compared against the baseline group of Biden supporters since Biden won the Democratic primary. Of course, these elections are not perfectly comparable, so we focus on within-group change instead of between-group comparisons.
To identify Twitter users’ gender, we matched users to a commercial voter file3 (e.g., Grinberg et al., 2019). Commercial voter files are a highly accurate list of registered voters (Ansolabehere & Hersh, 2012). Two independent coders took the accounts with enough personal details in their profile (e.g., name, location) and hand-matched them with voter file data to capture the gender of users (Cohen’s kappa = .73). This step produced 265 accounts that matched a voter file record and sent tweets during our periods of analysis (62 Trump supporters [11 females, 18.0%]; 86 Sanders supporters [31 females, 36.0%]; 118 Biden supporters [48 females, 40.7%]). Of course, this process meant that we only analyzed accounts that provided enough information to locate them and reliably match them. However, matched and unmatched users did not differ across key metrics (Supplementary Material B). Among the 265 users, we identified individuals who shared a gendered identity in their Twitter bios by checking if the users included any of the following words: she, her, hers, female, woman, mother, he, him, his, male, man, father, dad, mom, wife, sister, grandma, grandmother, husband, brother, grandfather, grandpa, resulting in 68.7% (n = 182) of the 265 users who were labeled as having expressed a gendered identity in their bios.
Tweet data
We collected all tweets (matched and unmatched) from all the users from December 2, 2019, to July 1, 2021, totaling 4,009,034 original tweets, retweets, and replies. Figure 1 displays the average number of tweets sent by accounts of supporters of each candidate. Table 1 presents the average number of tweets sent by supporters of each campaign in three different periods: before Sanders’s and Trump’s defeat (December 1, 2019, to April 7, 2020), after Sanders’s defeat (April 8, 2020, to November 6, 2020), and after Trump’s defeat (November 7, 2020, to July 1, 2021). For our primary analysis of Trump supporters, we specifically analyzed tweets from Trump and Biden flocks that were posted within a window of 30 days before or after November 7, 2020, the day that most major news organizations declared Trump the loser of the 2020 U.S. Presidential General Election. For analyzing Sanders supporters, we examined tweets from Sanders and Biden supporters within 30 days before or after April 8, 2020, the day that Sanders dropped out of the Democratic Primary of the 2020 U.S. Presidential Primary Election. These main analyses (users with gender information from the voter file in the 30-day window) included 286,048 tweets from Trump supporters (M = 76.9, SD = 130.1), 99,472 from Sanders supporters (M = 19.0, SD = 33.1), and 286,048 from Biden supporters (M = 22.2, 48.6).
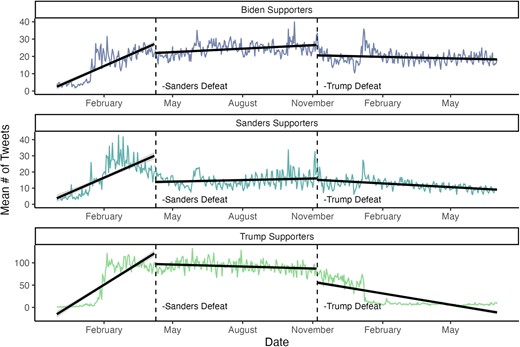
Average number of tweets per day by supporters of the Biden, Sanders, and Trump campaigns.
Note: Descriptive plot of the average number of tweets sent by supporters of each campaign. The vertical break-points are the days of defeat for Sanders (April 8, 2020) and the Trump campaigns (November 7, 2020).
Descriptive statistics of tweet volume
| Group | Gender | Pre-defeats (December 1, 2019 to April 7, 2020) | Post-Sanders defeat (April 8, 2020 to November 6, 2020) | Post-Trump defeat (November 7, 2020 to 7 January 2021) |
|---|---|---|---|---|
| Biden supporters | F | 19.5 (18.5–20.5) | 27.7 (26.7–28.6) | 22.1 (21.3–22.9) |
| Biden supporters | M | 11.6 (10.9–12.3) | 22.0 (21.1–22.8) | 17.6 (16.9–18.3) |
| Sanders supporters | F | 13.9 (13.0–14.8) | 10.5 (10.0–10.9) | 6.8 (6.5–7.1) |
| Sanders supporters | M | 18.5 (17.7–19.4) | 17.4 (16.7–18.1) | 15.1 (14.5–15.6) |
| Trump supporters | F | 109.2 (100.0–118.4) | 191.9 (184.6–199.2) | 42.3 (38.8–45.9) |
| Trump supporters | M | 40.5 (38.2–42.8) | 70.1 (67.5–72.8) | 17.8 (16.6–18.9) |
Note: Descriptive statistics of the average number of tweets sent by supporters of each campaign for various time periods by gender. The average number of tweets is the primary number in each column with 95% confidence intervals. Gender column: F = female, M = male.
For the main dependent variable of political expression on social media, we calculated the number of tweets each person sent daily during their analysis window.4 Besides measuring expression levels, we also analyzed content tweets across three dimensions. Amplification was measured by the percentage of tweets that were retweeted or quote-retweeted to users within the same flock. Trump supporters averaged 12.6% (SD = 14.8%) of tweets amplifying flock members, compared to 14.1% (SD = 7.1%) for Sanders and 1.7% (SD = 7.1%) for Biden supporters. Interaction with candidates was tracked by the percentage of daily tweets retweeting, quote-retweeting, or mentioning the candidate. Trump supporters interacted in 15.0% (SD = 17.2%) of their daily tweets, while Sanders and Biden supporters showed 4.6% (SD = 11.7%) and 2.1% (SD = 8.7%), respectively. Finally, populist language usage, identified using populism dictionaries from Bonikowski & Gidron (2016) and Rooduijn & Pauwels (2011), was calculated as a daily percentage per person. Trump, Sanders, and Biden supporters used populist language in 6.0% (SD = 8.1%), 5.1% (SD = 10.2%), and 3.5% (SD = 9.26%) of their tweets, respectively.
Growth modeling
Note that we recentered time around the day of defeat, meaning that on the day of defeat is “0.” Thus, represents the average value of the dependent variable on the defeat day. The time variable is a negative value that starts at −30, goes up until 0 on the defeat day, and remains 0 thereafter. Therefore, represents the change in the dependent variable in the lead-up to defeat day. The variable is a binary variable that is “0” before the defeat, then, on the day of defeat, becomes a “1” and remains so for the remainder of the period. As a result, captures the transformational change starting on the day of defeat. Next, is a time variable that is 0 until the day of defeat, then starts counting up. Thus, is the gradual change after the day of defeat. Supplementary MaterialFigure S1 visually represents these time variables in Equation (1). Finally, is the remaining variance not captured by the model.
The parameters are the population average of the parameters. We allow individuals’ baseline level of the dependent variable to vary via , a random effect and varies by individual . The binary variable represents whether individual supported the losing (Trump or Sanders) or winning (Biden) campaign. Therefore, the parameters capture the effects of being a supporter of a losing campaign. So, represents the difference in the number of tweets sent by losing campaign supporters on the day of defeat; is the difference in gradual change per day in the lead-up to the election for losing campaign supporters; represents the difference in the transformational change exhibited by supporters of the losing campaign; is the difference in the gradual change per day after the day of defeat for the losing campaign supporters.
The variable is whether individual is a female. The is the fixed effect of being a female. The parameters are, therefore, the interaction effect of being a female supporter of a losing campaign. These interactive parameters are the main parameters of interest to the present research because they capture the unequal intraindividual change in women who experience political defeat. For example, captures the transformational change starting on election day, specifically for women who supported the losing campaign.
Like Equation (3), another covariate, , is added in Equation (4) and represents whether individual expressed a gendered identity in their Twitter bio. The main parameters of interest are the parameters representing the difference shown by women who supported a losing campaign and expressed a gendered identity in their Twitter bio. For example, captures the transformational change starting on election day for women who supported the losing campaign and expressed a gendered identity. We also use this model to estimate content differences to answer RQ2.
In addition to the main analysis, we conducted robustness checks, including power calculations (Supplementary Material E), varying time windows (Supplementary Material F), and nonlinear model specifications (Supplementary Material G). These checks suggest more robustness for findings from the conservative model compared to the liberal model. Findings from the conservative than the liberal mode. Thus, we primarily present results from the conservative models.
Results
First, we report levels of political expression among supporters of the losing Trump campaign during the 2020 U.S. Presidential Election. For RQ1, we report results from Model 1 (Equation (2)), the simplest model that only considers whether an individual supported a losing campaign and levels of political expression (Table 2). For conservatives in Model 1, we find that supporters of the losing campaign averaged many more tweets on the day of defeat () than supporters of the winning campaign (with representing the average number of tweets sent per day on the day of defeat by supporters of the winning campaign and representing the additional difference, above and beyond , in supporters of the losing campaign). However, we do not see transformational change on the day of defeat () nor gradual change after ().
Effect of political defeat on political expression levels of supporters of winning and losing campaigns
| Term | Conservatives Est. | Conservatives CI | Liberals Est. | Liberals CI |
|---|---|---|---|---|
| Fixed effects | ||||
| Intercept (Baseline on Day of Defeat) | ||||
| γ00 | 28.66*** | 13.22, 44.09 | 24.91*** | 18.07, 31.75 |
| γ01l | 71.95*** | 44.88, 99.03 | −6.41 | −16.73, 3.91 |
| DaysToDefeat (Gradual Leading up to Day of Defeat) DefeatBinary | ||||
| γ10 | −0.07 | −0.27, 0.13 | −0.05 | −0.12, 0.03 |
| γ11l | −0.37* | −0.72, −0.03 | −0.22*** | −0.33, −0.11 |
| (Transformational Starting on Day of Defeat) | ||||
| γ20 | 1.66 | −3.36, 6.68 | −2.75** | −4.55, −0.95 |
| γ21l | −7.63 | −16.28, 1.02 | 4.25** | 1.52, 6.98 |
| DaysSinceDefeat (Gradual Starting on Day of Defeat) | ||||
| γ30 | −0.40*** | −0.60, −0.21 | 0.03 | −0.04, 0.10 |
| γ31l | 0.00 | −0.33, 0.33 | −0.23*** | −0.33, −0.13 |
| Random effects | ||||
| std(u00i) | 76.6 | 68.3, 85.9 | 35.3 | 31.9, 39.0 |
| Model fit | ||||
| AIC | 126,434.6 | 127,824.8 | ||
| BIC | 126,508.1 | 127,900.5 | ||
| Log-likelihood | −63,207.2 | −63,902.4 |
Note: Coefficients using Equation (2). , . Time is centered on the day of defeat. Est. = estimate; CI = 95% confidence interval; AIC = Akaike information criterion; BIC = Bayesian information criterion.
p < .001;
p < .01;
p < .05.
Model 2 (Equation (3); testing H1), however, reveals that gender is a key moderator in losers’ levels of political expression in response to political defeat (Table 3). Female supporters of the Trump campaign were much more active on Twitter on the day of defeat () than male supporters of the winning campaign (). Female supporters of the Trump campaign gradually sent more tweets as the day of defeat approached (). However, they experienced a large, transformational decrease in their tweet volume starting on the day of defeat (), a change their male counterparts did not experience ().5
Effect of political defeat on political expression levels of male and female supporters of winning and losing campaigns
| term | Conservatives Est. | Conservatives CI | Liberals Est. | Liberals CI |
|---|---|---|---|---|
| Fixed effects | ||||
| Intercept (Baseline on Day of Defeat) | ||||
| γ00 | 25.17* | 5.83, 44.50 | 20.09*** | 11.12, 29.07 |
| γ01l | 46.54** | 15.45, 77.62 | 0.48 | −12.75, 13.71 |
| γ02f | 8.49 | −21.68, 38.66 | 11.33 | −2.44, 25.10 |
| γ03f ∗ l | 122.47*** | 63.20, 181.73 | −16.88 | −37.92, 4.16 |
| DaysToDefeat (Gradual Leading up to Day of Defeat) | ||||
| γ10 | −0.11 | −0.37, 0.16 | −0.08 | −0.17, 0.02 |
| γ11l | −0.69*** | −1.10, −0.28 | −0.19** | −0.33, −0.05 |
| γ12f | 0.08 | −0.32, 0.49 | 0.07 | −0.08, 0.22 |
| γ13f ∗ l | 1.66*** | 0.85, 2.47 | −0.05 | −0.27, 0.17 |
| DefeatBinary (Transformational Startinging on Day of Defeat) | ||||
| γ20 | 0.51 | −6.07, 7.08 | −2.16 | −4.54, 0.21 |
| γ21l | 3.28 | −6.97, 13.53 | 3.65* | 0.13, 7.16 |
| γ22f | 2.75 | −7.39, 12.88 | −1.38 | −5.01, 2.25 |
| γ23f ∗ l | −50.76*** | −70.94, −30.57 | 1.40 | −4.19, 6.98 |
| γ20 | 1.66 | −3.36, 6.68 | −2.75** | −4.55, −0.95 |
| γ21l | −7.63 | −16.28, 1.02 | 4.25** | 1.52, 6.98 |
| DaysSinceDefeat (Gradual Starting on Day of Defeat) | ||||
| γ30 | −0.40*** | −0.60, −0.21 | 0.03 | −0.04, 0.10 |
| γ31l | 0.00 | −0.33, 0.33 | −0.23*** | −0.33, −0.13 |
| γ32f | −0.19 | −0.57, 0.20 | −0.22** | −0.36, −0.08 |
| γ33f ∗ l | −0.31 | −1.08, 0.46 | 0.27* | 0.06, 0.48 |
| Random effects | ||||
| std(u00i) | 76.6 | 68.3, 85.9 | 35.3 | 31.9, 39.0 |
| Model fit | ||||
| 127,808.4 | 127,808.4 | 127,808.4 | ||
| 127,944.6 | 127,944.6 | 127,944.6 | ||
| −63,886.2 | −63,886.2 | −63,886.2 |
Note: Coefficients using Equation (3). , . Time is centered on the day of defeat. Est. = estimate; CI = 95% confidence interval.
p < .001;
p < .01;
p < .05.
To test H2, Model 3 (Equation (4)) considers the role of expressed gendered identity in levels of political expression (Table 4). We find that starting on the day of defeat, supporters of the losing Trump campaign, as a baseline, sent gradually fewer tweets (), and female supporters of the losing Trump campaign who expressed their gender identity () gradually posted even fewer tweets. In contrast, their male counterparts () gradually posted more tweets.6
Effect of political defeat on political expression levels of male and female supporters of winning and losing campaigns who did and did not express a gendered identity
| Term | Conservatives Est. | Conservatives CI | Liberals Est. | Liberals CI |
|---|---|---|---|---|
| Fixed effects | ||||
| Intercept (Baseline on Day of Defeat) | ||||
| γ00 | 6.14 | −25.10, 37.38 | 11.53 | −2.90, 25.95 |
| γ01l | 66.23* | 8.13, 124.33 | 0.70 | −21.82, 23.22] |
| γ02f | 22.79 | −31.20, 76.78 | 14.61 | −10.72, 39.94 |
| γ03f ∗ l | 135.68* | 22.48, 248.87 | −15.69 | −52.81, 21.42 |
| γ04id | 30.52 | −8.99, 70.04 | 13.66 | −4.62, 31.95 |
| γ05id ∗ l | −30.47 | −99.21, 38.28 | −1.54 | −29.23, 26.15 |
| γ06id ∗ f | −23.63 | −88.60, 41.34 | −6.76 | −36.91, 23.39 |
| γ07id ∗ l ∗ f | −14.71 | −146.51, 117.10 | 0.61 | −44.30, 45.53 |
| DaysToDefeat (Gradual Leading up to Day of Defeat) | ||||
| γ10 | −0.06 | −0.47, 0.34 | 0.12 | −0.03, 0.27 |
| γ11l | 1.68*** | 0.89, 2.47 | −0.46*** | −0.69, −0.22 |
| γ12f | −0.02 | −0.70, 0.66 | −0.07 | −0.32, 0.19 |
| γ13f ∗ l | 0.83 | −0.78, 2.44 | 0.05 | −0.34, 0.44 |
| γ14id | −0.07 | −0.61, 0.46 | −0.32** | −0.52, −0.13 |
| γ15id ∗ l | −3.01*** | −3.93, −2.08 | 0.42** | 0.13, 0.72 |
| γ16id ∗ f | 0.16 | −0.69, 1.00 | 0.24 | −0.07, 0.55 |
| γ17id ∗ l ∗ f | 1.00 | −0.86, 2.86 | −0.18 | −0.66, 0.30 |
| DefeatBinary (Transformational Starting on Day of Defeat) | ||||
| γ20 | 1.18 | −8.98, 11.34 | −2.07 | −5.84, 1.71 |
| γ21l | 21.22* | 1.60, 40.84 | 2.87 | −3.02, 8.75 |
| γ22f | 4.80 | −12.10, 21.70 | −5.35 | −11.76, 1.05 |
| γ23f ∗ l | −73.06*** | −113.06, −33.06 | 5.52 | −4.19, 15.23 |
| γ24id | −1.14 | −14.39, 12.10 | −0.16 | −5.02, 4.70 |
| γ25id ∗ l | −22.58 | −45.70, 0.53 | 1.18 | −6.16, 8.52 |
| γ26id ∗ f | −2.87 | −23.93, 18.19 | 5.56 | −2.24, 13.35 |
| γ27id ∗ l ∗ f | 28.72 | −17.59, 75.04 | −5.76 | −17.64, 6.13 |
| DaysSinceDefeat (Gradual Starting on Day of Defeat) | ||||
| γ30 | −0.12 | −0.51, 0.27 | 0.09 | −0.06, 0.23 |
| γ31l | −1.59*** | −2.34, −0.84 | −0.16 | −0.38, 0.07 |
| γ32f | −0.12 | −0.76, 0.53 | −0.05 | −0.30, 0.19 |
| γ33f ∗ l | 1.78* | 0.25, 3.31 | 0.05 | −0.32, 0.42 |
| γ34id | −0.35 | −0.86, 0.16 | 0.07 | −0.12, 0.25 |
| γ35id ∗ l | 2.15*** | 1.26, 3.03 | −0.29* | −0.57, −0.01 |
| γ36id ∗ f | −0.05 | −0.86, 0.75 | −0.25 | −0.55, 0.05 |
| γ37iy ∗ l ∗ f | −2.72** | −4.49, -0.95 | 0.31 | −0.14, 0.77 |
| Random effects | ||||
| std(u00i) | 72.7 | 64.7, 81.5 | 34.7 | 31.3, 38.4 |
| Model fit | ||||
| AIC | 126,184.3 | 127,801.4 | ||
| BIC | 126,434.5 | 128,058.8 | ||
| Log-likelihood | −63,058.2 | −63,866.7 |
Note: Coefficients using Equation (4). , . Time is centered on the day of defeat. Est. = estimate; CI = 95% confidence interval; AIC = Akaike information criterion; BIC = Bayesian information criterion.
p < .001;
p < .01;
p < .05.
Next, we report the results from supporters of the losing Sanders campaign during the 2020 U.S. Democratic Presidential Primary Election. While there is a confluence of factors that may explain between-group differences among Trump and Sanders supporters (general vs. primary election, time of year, and ideology) and the results for the liberal model being less robust than the conservative model (see Supplementary Material E–G), we still report the liberal model results to show whether there is similar or differing within-group variation over time. In Model 1 (see Table 2), supporters of the losing campaign tweeted gradually less leading up to defeat (), transformationally tweeted more starting on the day of defeat () but tweeted gradually less after defeat (). In Model 2 (see Table 3), female supporters’ levels of political expression did not statistically significantly differ much from male supporters but may have been gradually more resilient after defeat (, these results are only marginally robust; see Supplementary Tables S2, S6, and S8) (these results are visualized in Figure 2). In Model 3 (see Table 4), we do not find evidence that the combination of gender and expressed gender identity moderated changes in political expression among supporters of the losing liberal campaign.
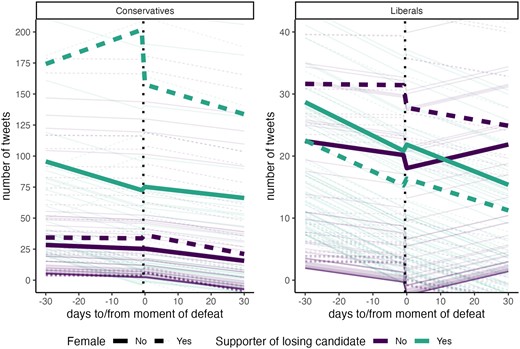
Prototypical and individual models of tweets per day.
Note: , . Model-predicted changes in mobilization (volume of tweets). Small lines represent individual predicted trajectories, while big lines represent the prototypical predicted trajectory. The x-axis represents the time to/from the day of defeat, with 0 representing “the day of defeat.” The y-axis represents the volume of tweets. The green lines represent supporters of the losing campaign. Purple lines are supporters of the winning campaign. The dotted lines represent females. The solid lines represent men.
For RQ2, examining changes in tweet content, we use Model 3 (Equation (4)), looking at flock amplification (Table 5), candidate interaction (Table 6), and populist language (Table 7). We find limited but notable changes in the content of tweets after defeat. For Trump supporters, we find that flock amplification (Table 5) transformationally increased among females of the winning (). However, this trend is more than reversed for female supporters of the losing campaign, who transformationally amplified flock members less after defeat (). Moreover, female supporters of the losing campaign who expressed a gendered identity transformationally amplified their flock members more after defeat (). In contrast, we find no significant changes, transformationally () or gradually (), after defeat among Trump supporters for candidate interaction (Table 6) or use of populist language (Table 7). However, even fewer observed changes are adequately powered in post-hoc power calculations (see Supplementary Material E). Therefore, we suggest caution in interpreting these content-based results and encourage them to be used as material for future hypotheses.
Flock amplification models
| term | Conservatives Est. | Conservatives CI | Liberals Est. | Liberals CI |
|---|---|---|---|---|
| Fixed effects | ||||
| Intercept (Baseline on Day of Defeat) | ||||
| γ00 | 0.012 | −0.025, 0.048 | −0.001 | −0.042, 0.040 |
| γ01l | 0.076* | 0.010, 0.141 | 0.109*** | 0.048, 0.170 |
| γ02f | 0.005 | −0.057, 0.066 | 0.004 | −0.066, 0.073 |
| γ03f ∗ l | 0.057 | −0.069, 0.183 | 0.059 | −0.042, 0.159 |
| γ04id | −0.001 | −0.047, 0.045 | 0.026 | −0.026, 0.078 |
| γ05id ∗ l | 0.040 | −0.038, 0.117 | −0.028 | −0.103, 0.048 |
| γ06id ∗ f | −0.006 | −0.080, 0.069 | −0.011 | −0.094, 0.072 |
| γ07id ∗ l ∗ f | −0.050 | −0.196, 0.097 | 0.002 | −0.120, 0.124 |
| DaysToDefeat (Gradual Leading up to Day of Defeat) | ||||
| γ10 | 0.000 | −0.001, 0.001 | −0.000 | −0.002, 0.001 |
| γ11l | −0.002* | −0.003, −0.000 | −0.002* | −0.004, −0.000 |
| γ12f | −0.001 | −0.002, 0.000 | 0.000 | −0.001, 0.002 |
| γ13f ∗ l | 0.003* | 0.001, 0.006 | 0.002 | −0.001, 0.004 |
| γ14id | −0.001 | −0.002, 0.000 | 0.000 | −0.001, 0.002 |
| γ15id ∗ l | 0.003** | 0.001, 0.004 | 0.000 | −0.002, 0.002 |
| γ16id ∗ f | 0.002* | 0.000, 0.003 | −0.000 | −0.003, 0.002 |
| γ17id ∗ l ∗ f | −0.004** | −0.007, −0.001 | 0.000 | −0.003, 0.003 |
| DefeatBinary (Transformational Starting on Day of Defeat) | ||||
| γ20 | 0.010 | −0.010, 0.031 | 0.003 | −0.025, 0.032 |
| γ21l | 0.013 | −0.022, 0.047 | 0.016 | −0.023, 0.055 |
| γ22f | 0.047** | 0.015, 0.079 | −0.005 | −0.049, 0.039 |
| γ23f ∗ l | −0.104** | −0.169, −0.038 | −0.074* | −0.139, −0.009 |
| γ24id | −0.005 | −0.030, 0.021 | −0.006 | −0.041, 0.029 |
| γ25id ∗ l | −0.025 | −0.066, 0.016 | 0.009 | −0.040, 0.057 |
| γ26id ∗ f | −0.051* | −0.091, −0.012 | 0.003 | −0.050, 0.055 |
| γ27id ∗ l ∗ f | 0.113** | 0.037, 0.189 | 0.047 | −0.031, 0.125 |
| DaysSinceDefeat (Gradual Starting on Day of Defeat) | ||||
| γ30 | −0.000 | −0.001, 0.001 | 0.000 | −0.001, 0.001 |
| γ31l | 0.001* | 0.000, 0.003 | 0.000 | −0.001, 0.002 |
| γ32f | −0.001 | −0.002, 0.000 | −0.000 | −0.002, 0.002 |
| γ33f ∗ l | 0.001 | −0.002, 0.003 | 0.001 | −0.002, 0.004 |
| γ34id | 0.000 | −0.001, 0.001 | 0.000 | −0.001, 0.001 |
| γ35id ∗ l | −0.000 | −0.002, 0.001 | −0.000 | −0.002, 0.002 |
| γ36id ∗ f | 0.001 | −0.000, 0.003 | 0.000 | −0.002, 0.002 |
| γ37id ∗ l ∗ f | −0.002 | −0.005, 0.001 | −0.002 | −0.005, 0.001 |
| Random effects | ||||
| std(u00i) | 0.077 | .068, .087 | 0.083 | .075, .092 |
| Model fit | ||||
| AIC | −17,060.7 | −15,307.2 | ||
| BIC | −16,822.1 | −15,061.6 | ||
| Log-likelihood | 8,564.3 | 7,687.6 |
Note: Coefficients using Equation (4). , . Time is centered on the day of defeat. Est. = estimate; CI = 95% confidence interval; AIC = Akaike information criterion; BIC = Bayesian information criterion.
p < .001;
p < .01;
p < .05.
Candidate interaction models
| Term | Conservatives Est. | Conservatives CI | Liberals Est. | Liberals CI |
|---|---|---|---|---|
| Fixed effects | ||||
| Intercept (Baseline on Day of Defeat) | ||||
| γ00 | 0.044* | 0.001, 0.088 | −0.008 | −0.031, 0.014 |
| γ01l | 0.142*** | 0.064, 0.220 | 0.012 | −0.020, 0.044 |
| γ02f | −0.007 | −0.080, 0.067 | 0.009 | −0.028, 0.046 |
| γ03f ∗ l | −0.026 | −0.174, 0.123 | 0.045 | −0.008, 0.098 |
| γ04id | −0.008 | −0.062, 0.047 | 0.014 | −0.014, 0.042 |
| γ05id ∗ l | −0.020 | −0.112, 0.073 | 0.006 | −0.034, 0.046 |
| γ06id ∗ f | 0.001 | −0.088, 0.090 | −0.004 | −0.048, 0.040 |
| γ07id ∗ l ∗ f | 0.025 | −0.150, 0.199 | −0.023 | −0.088, 0.041 |
| DaysToDefeat (Gradual Leading up to Day of Defeat) | ||||
| γ10 | 0.000 | −0.001, 0.001 | −0.001* | −0.002, −0.000 |
| γ11l | 0.000 | −0.002, 0.002 | −0.002*** | −0.004, −0.001 |
| γ12f | −0.000 | −0.002, 0.002 | 0.001 | −0.000, 0.002 |
| γ13f ∗ l | 0.001 | −0.003, 0.004 | 0.002* | 0.000, 0.004 |
| γ14id | −0.001 | −0.002, 0.001 | 0.001 | −0.000, 0.002 |
| γ15id ∗ l | 0.001 | −0.001, 0.004 | 0.000 | −0.001, 0.002 |
| γ16id ∗ f | 0.000 | −0.002, 0.002 | −0.002* | −0.003, −0.000 |
| γ17id ∗ l ∗ f | −0.002 | −0.006, 0.002 | −0.001 | −0.003, 0.001 |
| DefeatBinary (Transformational Starting on Day of Defeat) | ||||
| γ20 | 0.017 | −0.009, 0.044 | 0.008 | −0.012, 0.028 |
| γ21l | −0.038 | −0.083, 0.007 | 0.020 | −0.008, 0.048 |
| γ22f | −0.010 | −0.052, 0.031 | −0.006 | −0.037, 0.026 |
| γ23f ∗ l | 0.005 | −0.079, 0.090 | −0.031 | −0.077, 0.016 |
| γ24id | 0.001 | −0.032, 0.035 | −0.004 | −0.030, 0.021 |
| γ25id ∗ l | −0.011 | −0.064, 0.042 | −0.003 | −0.037, 0.032 |
| γ26id ∗ f | 0.009 | −0.042, 0.061 | 0.015 | −0.023, 0.053 |
| γ27id ∗ l ∗ f | −0.012 | −0.111, 0.086 | 0.008 | −0.048, 0.064 |
| DaysSinceDefeat (Gradual Starting on Day of Defeat) | ||||
| γ30 | −0.001 | −0.002, 0.001 | −0.000 | −0.001, 0.001 |
| γ31l | 0.001 | −0.001, 0.003 | −0.000 | −0.002, 0.001 |
| γ32f | 0.000 | −0.001, 0.002 | −0.000 | −0.001, 0.001 |
| γ33f ∗ l | 0.000 | −0.003, 0.004 | −0.001 | −0.002, 0.001 |
| γ34id | 0.000 | −0.001, 0.001 | −0.000 | −0.001, 0.001 |
| γ35id ∗ l | −0.001 | −0.003, 0.001 | 0.000 | −0.001, 0.001 |
| γ36id ∗ f | −0.001 | −0.003, 0.001 | −0.000 | −0.002, 0.001 |
| γ37id ∗ l ∗ f | 0.001 | −0.003, 0.005 | 0.000 | −0.002, 0.003 |
| Random effects | ||||
| std(u00i) | 0.090 | 0.080, 0.102 | 0.039 | 0.034, 0.043 |
| Model fit | ||||
| AIC | −12,886.2 | −22,256.5 | ||
| BIC | −12,647.62 | −22,010.8 | ||
| Log-likelihood | 6,477.1 | 11,162.2 |
Note: Coefficients using Equation (4). , . Time is centered on the day of defeat. Est. = estimate; CI = 95% confidence interval; AIC = Akaike information criterion; BIC = Bayesian information criterion.
p < .001;
p < .01;
p < .05.
Populist language models
| term | Conservatives Est. | Conservatives CI | Liberals Est. | Liberals CI |
|---|---|---|---|---|
| Fixed effects | ||||
| Intercept (Baseline on Day of Defeat) | ||||
| γ00 | 0.031*** | 0.013, 0.050 | 0.040*** | 0.017, 0.062 |
| γ01l | 0.039* | 0.007, 0.071 | 0.012 | −0.020, 0.044 |
| γ02f | −0.021 | −0.051, 0.009 | −0.019 | −0.055, 0.018 |
| γ03f ∗ l | −0.005 | −0.065, 0.055 | 0.037 | −0.016, 0.089 |
| γ04id | 0.001 | −0.022, 0.025 | 0.002 | −0.026, 0.031 |
| γ05id ∗ l | −0.013 | −0.051, 0.025 | −0.011 | −0.051, 0.028 |
| γ06id ∗ f | 0.018 | −0.019, 0.055 | 0.005 | −0.038, 0.049 |
| γ07id ∗ l ∗ f | 0.016 | −0.054, 0.087 | −0.023 | −0.086, 0.041 |
| DaysToDefeat (Gradual Leading up to Day of Defeat) | ||||
| γ10 | 0.000 | −0.000, 0.001 | 0.001 | −0.000, 0.002 |
| γ11l | 0.000 | −0.001, 0.002 | −0.001 | −0.003, 0.000 |
| γ12f | −0.002** | −0.003, −0.001 | −0.001 | −0.002, 0.001 |
| γ13f ∗ l | −0.000 | −0.003, 0.002 | 0.002* | 0.000, 0.005 |
| γ14id | −0.001 | −0.002, 0.000 | −0.000 | −0.002, 0.001 |
| γ15id ∗ l | −0.001 | −0.002, 0.001 | 0.001 | −0.000, 0.003 |
| γ16id ∗ f | 0.002* | 0.000, 0.003 | 0.000 | −0.002, 0.002 |
| γ17id ∗ l ∗ f | 0.001 | −0.002, 0.004 | −0.002 | −0.005, 0.000 |
| DefeatBinary (Transformational Starting on Day of Defeat) | ||||
| γ20 | −0.004 | −0.024, 0.017 | −0.010 | −0.034, 0.014 |
| γ21l | −0.015 | −0.049, 0.020 | 0.023 | −0.010, 0.057 |
| γ22f | 0.027 | −0.005, 0.059 | 0.020 | −0.017, 0.058 |
| γ23f ∗ l | −0.006 | −0.071, 0.059 | −0.059* | −0.115, −0.003 |
| γ24id | −0.004 | −0.029, 0.022 | 0.021 | −0.010, 0.052 |
| γ25id ∗ l | 0.009 | −0.032, 0.050 | −0.030 | −0.072, 0.012 |
| γ26id ∗ f | −0.020 | −0.060, 0.019 | −0.023 | −0.068, 0.023 |
| γ27id ∗ l ∗ f | 0.006 | −0.069, 0.082 | 0.069* | 0.001, 0.137 |
| DaysSinceDefeat (Gradual Starting on Day of Defeat) | ||||
| γ30 | 0.000 | −0.000, 0.001 | 0.000 | −0.000, 0.001 |
| γ31l | −0.000 | −0.002, 0.001 | −0.001 | −0.002, 0.000 |
| γ32f | 0.000 | −0.001, 0.001 | −0.000 | −0.002, 0.001 |
| γ33f ∗ l | 0.001 | −0.002, 0.003 | 0.001 | −0.001, 0.004 |
| γ34id | −0.000 | −0.001, 0.001 | −0.001 | −0.002, 0.000 |
| γ35id ∗ l | 0.001 | −0.001, 0.002 | 0.001 | −0.000, 0.003 |
| γ36id ∗ f | −0.001 | −0.002, 0.001 | 0.000 | −0.002, 0.002 |
| γ37id ∗ l ∗ f | −0.001 | −0.004, 0.002 | −0.001 | −0.004, 0.002 |
| Random effects | ||||
| std(u00i) | 0.025 | 0.021, 0.029 | 0.031 | 0.027, 0.036 |
| Model fit | ||||
| AIC | −17,458.0 | −18,546.2 | ||
| BIC | −17,219.4 | −18,300.5 | ||
| Log-likelihood | 8,763 | 9,307.0 |
Note: Coefficients using Equation (4). , . Time is centered on the day of defeat. Est. = estimate; CI = 95% confidence interval; AIC = Akaike information criterion; BIC = Bayesian information criterion.
p < .001;
p < .01;
p < .05.
Discussion
Extending the gender gap and political defeat literature, we explore how political defeat impacts the gender gap in online political expression by merging Twitter network data with voter file data to determine gender and monitor the online activities of individuals precisely. Our multi-level growth models demonstrated differences between losing and winning supporters around electoral defeat (Equation (2)). Trump supporters tweeted more than supporters of the winning campaign on the day of defeat. However, we find no statistically significant changes in posting frequency after political defeat (RQ1).
Nevertheless, we observed clear gender differences in levels of political expression in response to political defeat across temporal components (Equation (3)). Though conservative women who supported Donald Trump were more active than their male counterparts throughout the period, they exhibited a steep and transformational drop in their political expression after the defeat, which their male counterparts did not display. These results speak to the significant relationship between electoral loss and gendered changes in political expression levels, providing support for H1.
The theoretical concept of “internal efficacy” (Lilleker et al., 2021), reflecting an individual’s belief in their competence, is pertinent to this finding. Plausibly, the observed decline in expression among female Trump supporters could be attributed, in part, to perceived efficacy compared to men. This finding resonates with research on women’s political interest and participation in general, highlighting women’s lower self-confidence and higher inclination toward conflict avoidance (Preece, 2016; Wolak, 2020, 2022). Moreover, socialization, which perpetuates gender norms, may also contribute to the observed differences in how men and women respond to political defeat (Peacock & Van Duyn, 2023). These theoretical underpinnings contextualize our findings, highlighting that gender-specific factors influence political behaviors on social media even during significant political events.
Contrary to typical gender gap expectations, female Trump supporters were more active than their male counterparts, challenging the notion that men always exhibit higher levels of political expression. Analysis of expression levels among both genders before, during, and after the electoral season (Supplementary Material I) revealed that both men and women initially exhibited low levels of expression, which escalated during the electoral period and then decreased substantially afterward. Notably, both genders had comparable expression levels in pre- and post-electoral periods; yet, women displayed more pronounced changes during defeat. This finding implies that the gender gap in political expression is inconsistent across all groups; this gap may diminish or even reverse in certain scenarios, like high-stake periods for politically active social media users.
Moreover, we find support for H2. Trump-supporting women who expressed gender identity showed a greater gradual decrease than those who did not (Equation (3)). While social media facilitates the expression of social identities, it also creates gendered spaces (Bivens, 2017; Bivens & Haimson, 2016) with gender-specific incivility and harassment (Koc-Michalska et al., 2021; Nadim & Fladmoe, 2021; Southern & Harmer, 2021). Political defeat likely represents an identity threat, rebuking defining features of oneself and lowering one’s self-esteem (Tajfel & Turner, 2004). This event might be particularly felt by women who chose to express their gender identity and are more sensitive to potential attacks on their gender identity, suppressing their willingness to express themselves politically after political defeat.
In addition, the content of tweets (RQ2) reveals that among female Trump supporters, flock amplification after defeat transformationally declined among individuals who did not express a gendered identity and increased among those who did express a gendered identity. We find no significant changes in candidate interaction and populist language. These mixed results suggest that networked affordances (Boyd & Ellison, 2007; Wellman et al., 2003) of social media (González-Bailón et al., 2011; González-Bailón & Wang, 2016) are more important in changing network-related behaviors (e.g., network amplification) in computer-mediated communications after defeat compared to changing content (e.g., candidate interaction and populist language). However, these results are underpowered (Supplementary Material E), and there are many other ways in which content may change after defeat.
We make four key contributions. First, we extend past work on the gender gap on social media by considering how offline events interact with social media to entrench the gender expression gap. While past research shows how psychological, technological, and social factors promote gendered communication and interaction on social media, our study suggests that offline events like political defeats can intensify those factors and widen the gender expression gap.
Second, our study adds nuance to the gender gap by showing it is not homogenous across individuals or time. Among Trump-supporting political activists on Twitter, female supporters had higher levels of political expression throughout—a finding that contradicts prevailing assumptions about the gender gap. Future research should consider for which populations the gender gap may not exist or is even reversed. In addition, the gender gap is not constant and may fluctuate over time. As we demonstrate, the gender gap changes during political defeat, a major life event. Future research should also examine how the gap changes over time across contexts.
Third, our study contributes to the political defeat literature by highlighting the importance of incorporating gender in understanding political defeat, particularly from a temporal perspective. Past political defeat work has, at best, controlled for gender. Gender’s moderating effect has not been fully interrogated in political defeat, but we show its importance, particularly in computer-mediated settings. In addition, given the close link between online political expression and offline political participation (Gil de Zúñiga et al., 2014; Yamamoto et al., 2015; Kim & Ellison, 2022), our examination of how women and men respond to political defeat on social media can begin to advance our understanding of the relationship between online responses to political defeat and offline post-defeat political behaviors.
Fourth, we described gender gap changes over time under the growth modeling framework. Our design is not perfectly aligned with making definitive causal statements. For example, if operating under a regression discontinuity design (RDD), one must assume parallel trends leading up to the discontinuity. If we were to treat electoral defeat as that discontinuity point, then the data would need to exhibit parallel trends, something we do not show (). It would perhaps be surprising to find these parallel trends in most electoral defeat cases because the defeat process is endogenous to the actual defeat itself. Individuals can gather information on the likely outcome of the race through news and public polling. In order to get a more definitive causal assessment of the effects of political defeat, future work should look for instances in which the election outcome is seemingly random (e.g., both campaigns were equally likely to win) and assess whether the parallel trends assumption holds and conduct a more traditional causal inference analysis.
While our study provides insights into the effect of political defeat on the gender gap online, it has limitations. First, our study is contextualized within the 2020 U.S. Presidential Election. This focus limits the generalizability to other contexts or time. The study does not differentiate between ideology and election type, with conservative women reacting to a general election defeat by an ideologically different candidate, while liberal women faced a primary defeat. This distinction in ideological proximity influences applicability beyond the U.S.’s two-party system. In multi-party systems, the impact of defeat may differ when losing candidates are ideologically similar to winning candidates (Curini & Jou, 2016). Our findings are more relevant to contexts with ideologically distinct losers. Future research should extend these findings across political environments and geography.
Second, we analyze a specific subset of Twitter users identified in previous research, who may only partially represent the broader population supporting a candidate or all social media behaviors. Despite their lack of representativeness, these Twitter users influence online discourse, impacting public opinion and media narratives. We focused on users identifiable in a voter file, potentially overlooking systematic differences with anonymous accounts. However, matched users showed no significant variance in followers, tweets, or favorites (Supplementary Material B). This specificity limits our study’s external validity, as it may not capture the complete range of political engagement on Twitter or other platforms. Unfortunately, Twitter/X’s updated academic data access policy may hinder future replication and extension.
Third, though increasing the precision of gender identification, using a voter file to identify individuals’ gender does not capture the full complexity of gender identity. The voter file provides two discrete genders for individuals: male or female. Therefore, nonbinary, gender-fluid, and trans individuals are underconsidered. Future research should work to understand the unique dynamics surrounding these individuals, particularly those vulnerable to policy changes that may follow elections. Our study is also limited in identifying expressed gendered identity online. Future work should strive to more comprehensively document gender identity terms in computer-mediated communications and consider other identities.
Despite limitations, our study reveals gender differences in politically active users’ responses to defeats. By honing our theoretical and analytical lens on a consequential political event, i.e., a political defeat, and how it impacts men and women differently, this study advances our understanding of the gender gap in political expression on social media and the role of political defeat in it. Ultimately, it invites future research to explore the psychological, technological, and structural obstacles that prevent women from adequately participating in politics online and their implications for offline political behaviors.
Footnotes
See Supplementary Material A for a discussion of the ethics of combining Twitter and voter file data.
Twitter is now “X” after Elon Musk’s acquisition. It also changed its academic data access policy, potentially hindering replication and extension of this study.
l2-data.com/
Of a random subset of tweets, 88.8% were about politics (i.e., political expression; see Supplementary Material C).
Model 2 fits the Trump and Sanders models significantly better than Model 1 (Supplementary Material H).
Model 3 fits the Trump and Sanders models significantly better than Model 2 (Supplementary Material H).
Supplementary material
Supplementary material is available online at Journal ofComputer-Mediated Communication.
Data availability
The data underlying this article are available in the OSF repository at https://osf.io/tgxpr/. Twitter became “X,” and changes to data access policies may hinder replication.
Funding
R.D. is supported by graduate fellowship awards from Knight-Hennessy Scholars and Stanford Data Science Scholars at Stanford University.
Conflict of Interest: None declared.
Acknowledgments
We thank our editors and reviewers for their feedback. We also thank Joyce Lu and Taylor Gindlesperger for their research assistance and Fan Chen for querying the Twitter data.
