


Abstract
This study investigates gender representation in artificial intelligence (AI)-related images across various digital spaces to understand potential biases and visual narratives in the AI domain. We analyzed a dataset of 28,199 images from news media, technology news websites, social media, knowledge-sharing platforms, and other digital spaces. Our findings revealed the prevalence of male faces and the consistent underrepresentation of women across digital spaces. We also found distinct patterns in the visual framing of men and women, with women often portrayed as being disempowered and adhering to traditional gender stereotypes. Furthermore, our cluster analysis demonstrated consistent patterns of gender representation across various visual themes, reinforcing the pervasive nature of gender biases in AI news imagery. In conclusion, our study underscores the need for conscious efforts to promote a more balanced and inclusive portrayal of gender in AI news reporting, calling for a broad societal effort toward advancing gender equality and diversity.
Lay Summary
This work analyzes how gender is represented in news images featuring artificial intelligence (AI). The study uncovers an underrepresentation of women in AI news images across various digital spaces. Female faces tend to be portrayed as disempowered and adhering to traditional gender stereotypes. The study also identifies distinct clusters of images reflecting unique visual themes about AI and human–AI relationships.
Human beings are entering an algorithmically-infused society sustained by various applications of artificial intelligence (AI), ranging from robots and news recommendation systems, to chatbots powered by large language models (LLMs). People learn about this emerging technology through daily observation, personal experience, and media consumption of related coverage. Indeed, media—with varied formats spanning from analog and online to social media—plays a pivotal role in shaping public perception and understanding of AI (Atkin et al., 2017).
Despite mounting media reportage and public discussion about AI, media representation and communication could serve as a double-edged sword. On the one hand, quality communication can improve public learning and understanding of thriving technologies. On the other hand, imbalanced or biased reporting may lead to public misunderstanding of AI by reinforcing existing biases or creating new biases (Chuan et al., 2019). For example, if the media depicts a new technology as intimidating or dangerous, then it can decrease public willingness to embrace it. Similarly, if images of men are predominantly associated with AI in news representation, then that could lead to a perception that AI is male dominated. This potential gender bias can have significant implications, potentially discouraging women from participating in AI development and perpetuating entrenched gender inequality in the fields of Science, Technology, Engineering and Math (STEM).
Gender and technology are innately linked to each other and involved in the process of coproduction, forming a mutually constitutive relationship (Bray, 2007). For instance, substantial research has suggested that women are underrepresented in societal sectors (e.g., politics, engineering) where raw, innate talent or “brilliance” is perceived as a prerequisite for success (Laberge et al., 2022; Leslie et al., 2015). The bias, as mentioned above, is reflected in the workforce and media portrayals of these fields. Media tends to sustain the stereotypes that these fields are “male domains,” further discouraging women’s participation (Bian et al., 2017; Cheryan et al., 2011). Another study found that media representation of STEM fields is heavily skewed toward men, reinforcing the stereotype that these fields are not for women (Corsbie-Massay & Wheatly, 2022).
Given the above historical context, it is likely that this gender bias extends to the AI field. This bias may manifest not only in the underrepresentation of women in AI technologies (for instance, face recognition technology has gained notoriety for its gender bias, Herlitz & Lovén, 2013) but also in the media portrayal of AI. To date, there has been little research exploring potential gender bias in the communicative representations of AI, particularly across various digital spaces, such as news media, social media, and tech-information websites. Hermann (2022) noted that attributing gender or other human characteristics to AI can transform interactions from human-to-machine to human-to-human-like. This could ultimately lead to changes in human attitudes and behavior toward AI. More concretely, media images of AI are socially, culturally, and communicatively constructed; disseminating these images can have a significant impact on human–AI relationships over time. Furthermore, examining visual representations of AI in the media can provide valuable insights into the complex process of constructing the concept of AI, especially considering that existing research on media portrayal of AI has primarily focused on textual discussions.
The remainder of this article is structured as follows: The literature review section presents theoretical arguments that connect gender with AI, explores the relationship between media representation and visual framing, and discusses media logic across digital spaces. This section concludes with our hypotheses and research questions. In the methods section, we offer detailed explanations for each analysis with our dataset. The results section provides a summary of the main findings. In the discussion section, we interpret these findings in the context of existing literature, identify the limitations of our study, and suggest directions for future research.
Literature review
Coproduction of gender and AI
Gender can be understood as a discursive construct, an ongoing process that shapes individuals (Eagly, 2013; Stephen & Harrison, 1985; van Zoonen, 1992), which suggests that gender is not just about biological or sexual differences but also involves power dynamics and societal hierarchies. Communication scholars have explored the inherent link between gender and human–machine communication, distinguishing between the gendering of human–machine communication and the gendering of technologies (e.g., Fortunati & Edwards, 2022; Liu & Yao, 2023; Reeves & Nass, 1996).
The gendering of human–machine communication refers to the differences in how men and women interact with machines, such as AI. In this context, AI is not simply a technological object or artifact but a communicative and agentic “subject” that participates in the interaction. On the other hand, the gendering of technologies refers to the way AI, as an embodied entity, carries a social identity, such as gender, that is constructed through its interactions with humans. This means that AI can be perceived and treated as having a gender identity, influencing how people interact with it and their expectations of it. This aspect of gendering is crucial as it may shape the user’s experience and the societal implications of AI.
There is a burgeoning body of literature on the gender–technology relationship, particularly in feminist studies. Wajcman (2000) emphasized the value of two theoretical perspectives—the social construction of technology and the actor-network theory—in understanding the social process of shaping technologies and noted a lack of attention to the structural dimension (e.g., gender equality) of the gender–technology linkage. Based on the literature, the interplay between gender and AI can be viewed in two ways: the technologizing of gender and the gendering of technology (Green & Singleton, 2013). The technologizing of gender refers to how AI influences the construction of different genders, such as men, women, and nonbinary individuals. The gendering of technology, on the other hand, refers to how AI is imbued with a social identity; it reflects and reinforces existing gender norms and stereotypes, potentially shaping human perceptions and interactions with technology in a way that aligns with societal gender roles. Put differently, the social construction of gender is a process, and so is the social construction (including media depiction) of technology. The two processes constitute a convoluted coproduction meta-process that shapes the operation of gender relations and their bearing on AI. Sutko (2020), studying AI products such as Alexa, found that those products demonstrated a salient association between femininity and AI, and such an association challenged essentialized distinctions between actual intelligence and artificial intelligence.
Departing from the perspective of gender–technology coproduction, we argue that media representation of AI makes a subtle and sophisticated process of “doing” gender by presenting, absenting, or accentuating particular gender identities with their scripts about AI. Such media scripts may, over time, become part of our “normal daily life” and, hence, either reinforce existing or reform new gender relations (Green & Singleton, 2013). For instance, if news articles consistently depict AI products alongside men more often than with women, it could reinforce the stereotype that AI development is predominantly a male domain. Over time, this could also contribute to the misconception that AI is inherently masculine, or that AI has a male identity. For example, Cave et al. (2023) concluded that associating AI with masculine symbols (e.g., military products, corporate figureheads) in films amplified the perceived masculinity of AI as a whole. That is, depicting AI together with masculine milieus, through either direct or mediated communication, is likely to influence the gendering of AI. In particular, the way media represents or frames AI may, over time, instill certain social identity (e.g., gender) to AI.
Media representation via visual framing
Framing is a potent tool in media representation, shaping how audiences perceive and understand various topics. How media portrays certain subjects—the frequency, context, and presentation—can significantly influence public perception and discourse (e.g., Gene Zucker, 1978; McCombs & Valenzuela, 2020; Mutz, 1989). For example, framing climate change as a political issue rather than a scientific one can polarize opinions and hinder consensus on environmental policies. Similarly, the framing of a public health crisis like the opioid epidemic as a criminal issue rather than a health concern can shape public attitudes and policy responses.
Visual framing, a subset of framing that focuses on the use of images, is an area that has yet to be extensively explored despite being a critical aspect of media representation. Visual framing refers to how images construct a particular meaning or interpretation of a subject, often in alignment with textual framing (D’Angelo & Kuypers, 2010). Images can convey solid messages and shape perceptions more powerfully than words. They are crucial in framing issues and can significantly influence how audiences interpret them. For instance, researchers have found that in political communications, using human-interest framing in images can elicit more robust emotional responses and higher perceived communicative quality compared to no framing and can also influence the public’s perception of political actors (Brantner et al., 2011). Similarly, research has shown that when images of immigrants and refugees are framed in a political context, they tend to evoke negative emotions and attitudes. In contrast, using a human-interest frame for these images can increase positive emotions and enhance positive attitudes (Parrott et al., 2019).
Previous studies focusing on visual framing and gender bias suggest that how gender is depicted through images significantly impacts societal views and attitudes. For instance, visual framing analysis of sports has revealed a long-standing trend of female athletes portrayed as inferior to male athletes, with a lower portion of prime-time coverage about women (Billings & Eastman, 2003; Billings et al., 2008; Bruce, 2016). One study analyzed 1,587 Instagram images from American sports networks and discovered that female athletes tend to be shown accompanying a man and appear in culturally “appropriate” sports and nonathletic roles (Romney & Johnson, 2020). These visual depictions both reflect and actively mold and reinforce societal gender biases.
Examining gender bias through visual framing is significant because it can uncover the subtle, pervasive ways gender inequalities are maintained and reproduced in society (Entman, 2007; Goffman, 1979). Visual framing provides a lens to analyze how gender is constructed and represented, offering insights into underlying biases and assumptions informing these representations. As such, understanding how gender is visually framed may advance more equitable, inclusive media practices.
The current study aims to quantify gender bias in AI news imagery through multi-faceted visual framing analysis. First, we will examine the proportional distribution of male, female, and undetermined faces—which, if imbalanced, can reflect and reinforce gender biases as suggested by prior research on gendering of technologies (Cave et al., 2023). Second, we will conduct fine-grained coding of images across several dimensions, including gaze, posture, gestures, facial expression, and spatial positioning. Analyzing these visual cues is critical because prior research shows gaze aversion, deferent poses, diminished gestures, and background positioning disempower and marginalize subjects in images (Peña & Scott, 2022; Peng, 2018). Conversely, direct gaze, upright posture, expansive gestures, and foreground positioning convey agency and authority. Comparing the prevalence of empowered versus disempowered framing for men and women will shed light on the nuanced relations between gender and AI.
Media logic across digital spaces
Media logic, which refers to the norms and routines for constructing messages intrinsic to a particular medium, is pivotal in understanding the rules and codes that shape the presentation and recognition of information (Altheide, 2013, 2016; Mazzoleni, 2008). Emphasizing the modus operandi of media technologies, media logic highlights how media properties and affordances influence these codes. In this study’s context, media logic provides a framework for examining gender representation in AI news images across digital spaces (e.g., news media, technology-info news, social media, and knowledge-sharing platforms), offering insights into the entangled relationships between AI, gender, visual language, and digital space.
Though initially focused on professional news media and mass communication, media logic remains highly relevant when examining AI news images across digital spaces. A media logic perspective provides two valuable lenses for framing AI. First, it highlights how communicators adhere to particular rhythms, grammar, and formats to produce legitimate media messages while retaining flexibility within constraints (Altheide, 2004). Second, it recognizes the complex relationship between technological affordances and communicators who may or may not follow these codes (Altheide, 2016). These insights are particularly relevant to understanding the construction and perception of gendered AI representations, reflecting media constraints and possibilities.
Media logic varies across digital spaces, reflecting the unique values and affordances that shape communication styles within each medium. For example, newspaper images of political events often focus on key politicians and formal proceedings, while social media frequently capture more informal aspects like protest scenes. Similarly, entertainment blogs usually use casual language and provocative headlines, contrasting with magazines’ formal discourse and conventional poses. These observed patterns highlight the influence of medium-specific values on content presentation, yet comparing such variations across platforms remains a complex and underexplored area. By scrutinizing representations across platforms (e.g., news media, tech-info news, social media, and knowledge-sharing platforms), our study offers valuable insights into the complex interplay between media logic and gender portrayal about AI, highlighting the importance of media logic as a lens for understanding gender relations in digital spaces.
Hypotheses and research questions
In light of the above literature review, which speaks to the relationship between gendering, AI, visual framing, and media logic, we synthesize these insights to propose the following hypotheses and research questions:
H1: Images in AI news media will contain significantly more male faces than female faces, reflecting an underrepresentation of women in technology.
RQ1: In what manner does the pattern described in H1 manifest across various digital spaces?
H2: Images of women in AI news will more frequently depict disempowered visual framing (e.g., averted gaze, bowed postures, diminished gestures, background positioning, etc.) compared to images of men, reflecting the marginalization of women.
RQ2: How does the pattern described in H2 differ across different digital spaces?
RQ3: How does the gender representation in AI news images cluster across various digital spaces, and what underlying patterns or trends can be quantitatively identified?
Materials and methods
Data collection
We utilized a Python crawler to collect news articles from AITopics (https://aitopics.org), the most comprehensive repository of research updates, media reports, and public posts on AI. AITopics is a curated and reputable platform aggregating AI-related content from various sources, including academic journals, news outlets, and industry publications. It is maintained by the Association for the Advancement of Artificial Intelligence (AAAI), a well-established organization in the field of AI, ensuring the credibility and relevance of the content.
Our dataset covers AI news articles (filtered by “theme”) published on AITopics from January 2010 to December 2022. It comprises 321,715 articles from 32,091 websites, with 242,585 containing images. The news metadata include each article’s title, summary, source, URL, and industry type. This extensive collection allows a robust analysis of visual framing and gender representation in AI news images, reflecting media logic across various digital spaces. Our code and data are available on OSF (https://osf.io/dsajb/?view_only=cd1d797a3c794e21acc208e842d39d61).
Data selection
We selected 207,563 articles from 325 websites, each of which published at least 100 articles about AI. From these articles, we extracted 95,833 images, including 35,690 images containing human or human-like (e.g., robotic-looking, cartoonish) faces detected by RetinaFace. RetinaFace is a highly accurate and efficient face detection algorithm for natural scenes, proposed by the Insightface team in 2019.
Among the 35,690 images, we retained 28,199 images featuring only one face to serve as the foundation for our subsequent research analysis. This data screening was based on our preliminary analysis, which showed that images featuring two or more faces accounted for only a limited portion of the entire dataset. Furthermore, our initial analysis suggested that most images containing multiple faces were challenging to detect through both automatic and manual coding methods.
We have classified our news sources from AITopics into distinct categories, in accordance with the nature and primary functions of the platforms. Specifically, our categorizations include: news media (n = 10,903), which refers to mainstream news outlets that provide daily news updates and reports; social media (n = 1,702), platforms primarily designed for social interaction and user-generated content; technology-info sites (n = 8,597), dedicated portals that bring technology-related updates and news distinct from general news platforms; and knowledge-sharing platforms (n = 4,443), which bridge the gap between mass media and social media, emphasizing community-driven content, discussions, and knowledge dissemination. We have offered representative URLs for each of these categories in the Appendix for a clearer understanding. For those seeking a more exhaustive list, we have made it accessible via Supplementary File (https://osf.io/vfnwe?view_only=cd1d797a3c794e21acc208e842d39d61).
With respect to media logic, the concept is grounded in the understanding that different media platforms have their own inherent practices, patterns, and content representations. As an example, the logic of technology-info sites might prioritize depth, precision, and expertise given their audience’s interest in detailed technology trends, while knowledge-sharing platforms might lean more toward collaborative, user-driven, and diverse content. Through categorization and subsequent analyses, we aim to understand how the inherent logic of these diverse platforms connect to the representation of gender in AI news.
Data processing
Face recognition
To accurately identify human faces within our dataset, we manually labeled 2,000 images, differentiating between human faces and human-like entities such as robots or cartoon characters. We then utilized a convolutional neural network (CNN) algorithm to extract facial information from the images. Excluding those labeled as undetermined, we divided the remaining images into two parts: 1,129 images were randomly selected as the training set and 199 images were reserved as the test set for the classification task. The training was set to run for 10 iterations.
The CNN model was trained explicitly on this labeled dataset to classify the facial information into human (coded as 1) and human-like (coded as 0) categories. We implemented an adjusted-classify-and-count (ACC) method for post-classification correction to enhance the calibration in estimating label proportions. This corrected model proved effective in extracting and distinguishing facial information, achieving an accuracy of 0.91, precision of 0.64, recall of 0.75, and an F1-score of 0.69. We then applied this trained and corrected model to the entire image pool, successfully identifying 21,595 images containing human faces.
Gender identification
To categorize the gender (man, woman, and undetermined) in images (human faces only, n = 21,595), we first used DeepFace, a deep learning model for facial recognition (Taigman et al., 2014). DeepFace used a nine-layer neural net with over 120 million connection weights and was trained on four million facial images of more than 4,000 identities. The model uses 3D alignment of faces and a deep CNN to achieve high accuracy in facial recognition tasks, including gender categorization.
Recognizing the potential gender bias inherent in computer vision algorithms, we supplemented the DeepFace analysis with manual labeling. We had 2,000 randomly sampled images manually labeled for gender by human coders, ensuring a more nuanced and unbiased categorization. Combining automated DeepFace gender detection with manual human annotation allowed for an efficient yet multifaceted approach to analyzing gender in our image dataset. This method balances the scalability of machine learning with human judgment to mitigate bias. Based on the human-annotated data, DeepFace on our dataset achieved a precision of 0.99 and a recall of 0.84. It is worth noting that there were more instances of men being misidentified as women than the reverse, highlighting the importance of our combined approach in addressing potential biases.
Visual framing annotation
To analyze the visual framing techniques employed in portraying characters in images, we devised a comprehensive coding scheme. This scheme was informed by the rich body of literature on visual communication and gender portrayals (Archer et al., 1983; Emmons & Mocarski, 2014; Wang & Cooper-Chen, 2010). For each image, coders categorized the following for the main character: gaze direction (direct versus away), posture (upright versus bending/sitting/lying), facial expression (cheerful versus concerned), image proximity (large, medium, or small), and positional prominence (center versus background).
We randomly sampled 2,000 images from the 28,199 one-face image pool. The unit of analysis was each individual image. The authors trained two assistant coders using a sample of 300 images. After inter-coder reliability reached 0.9 and above on Cohen’s Kappa, the coders independently categorized the remaining images (n = 1,700). The final inter-coder reliability was 0.85, with any discrepancies resolved through discussion.
Initially, we planned to combine human annotation with a machine-learning algorithm to assess all 28,199 images. However, our trained CNN for postures, arm/hand gestures, social interaction, and settings achieved an accuracy just marginally better than chance, indicating concerns about its reliability. This suboptimal performance can be ascribed to the absence of extensive training data labeled with these intricate visual cues, considering our CNN model relied on pretrained weights from existing models. After discussions among the authors, we opted to rely exclusively on the human-annotated data for 2,000 images to test our H2 and RQ2. This decision was guided by our commitment to ensuring the accuracy and validity of our analysis. While this approach limited the number of images we could analyze, it allowed us to maintain rigorous standards in our assessment of visual framing, prioritizing quality over quantity. Furthermore, the sample size of 2,000 images was deemed sufficient to conduct powerful statistical inference, allowing us to test our hypotheses and answer our research questions confidently.
Statistical analyses
To examine H1 (the prevalence of men and women in AI news images), we operationalized prevalence as the frequency of male and female faces in the images (human face images only; n = 21,595). We first conducted a binomial test and then performed a Chi-square test to compare the gender distribution across different years. To test RQ1 (how the pattern of male and female prevalence varies across digital spaces), we conducted a Chi-square test for gender distribution across digital spaces.
To examine H2 (the visual framing of women in AI news as disempowered compared to men) and RQ2 (how the pattern of visual framing varies across different digital spaces), we implemented a two-step logistic regression analysis with L1 regularization (lasso regression). Lasso regression excels in feature selection and reduces the complexity of the model, making it more interpretable. Additionally, we employed nested cross-validation and grid search using the sklearn python library (https://scikit-learn.org) to perform lasso regression, enhancing the robustness of our model. This series of choices was made to ensure that our analysis could effectively address H2 and RQ2, taking into consideration the specific characteristics of our data.
The dependent variable in our analysis was gender (man = 1, woman = 0), and the independent variables included gaze direction, posture, facial expression, image proximity, positional prominence, and media type, all derived from human-annotated images. Recognizing that some images had these variables annotated as N/A (undetermined), we removed such images to enhance both the interpretability and statistical power of our model. Our final data include 439 images from the human-annotated set.
In the first step of our analysis, we assessed H2 by incorporating independent variables representing visual framing: gaze direction (direct versus away), posture (upright versus bending/sitting/lying), facial expression (cheerful versus concerned), image proximity (large, medium, versus small), and positional prominence (center versus background). In the second step, addressing RQ2, we extended the logistic regression model by adding the variable of digital space (i.e., media type). This allowed us to explore how the visual framing of gender varies across different digital platforms, providing insights into the nuanced ways in which gender is visually represented in various media contexts.
To address RQ3, which seeks to understand the visual representation patterns of gender in AI news images, we employed an exploratory cluster analysis. This technique groups images based on their visual similarities. We analyzed 28,199 images, encompassing both human and human-like faces. For feature extraction, we utilized ResNet50, renowned for its image classification prowess and capability to amplify image feature learning. ResNet50, a type of CNN, is recognized for its effectiveness in representation learning (He et al., 2016; Mascarenhas & Agarwal, 2021). ResNet50, as well as other CNNs, have proven to be highly effective in representation learning and are commonly used for deep feature extraction in image analysis (Al-Saffar et al., 2017).
Using ResNet50, which consists of a fully connected layer and 49 convolutional layers, we extracted various image features. By omitting the last fully connected layer, we derived a 2,048-dimensional feature vector, leveraging the pretrained weights from the ImageNet network. ResNet50, comprising a fully connected layer and 49 convolutional layers, continuously convolves the image data, extracting low-, mid-, and high-level features. The image data are transformed into a batch size ×2048 matrix, and the size of the input images was adjusted to 224×224 to meet ResNet50’s requirements. By deleting the last fully connected layer, we obtained a 2,048-dimensional feature vector using the pretrained weights in the ImageNet network without fine-tuning.
For post-feature extraction, we clustered the images using the K-means++ algorithm (Arthur & Vassilvitskii, 2007) and determined the optimal cluster count through the silhouette coefficient (SC) (Rousseeuw, 1987) and the Elbow method (Thorndike, 1953), evaluating the sum of squared errors (SSE). The SC ranges from −1 to 1 and is based on each sample’s mean intra-cluster and nearest-cluster distance, while the Elbow method identifies the point where the SSE begins to taper off. We started calculating the number of clusters (k) at k = 5, and the results indicated that k = 7 was the optimal choice (see Figure 3A in the Supplementary Materials). This methodology enabled a nuanced exploration of gender portrayals in AI news images across diverse digital platforms, offering valuable insights into gender representation within the AI media narrative.
Results
H1: The prevalence of men and women in AI news images
Among the 21,595 human face images analyzed, 18,040 (83.5%) were identified as men. A binomial test confirmed that this unequal distribution between men and women was significant (p < .001).
We further investigated gender distribution across years1 through a Chi-square test, which revealed a consistent pattern of male predominance across these years (Figure 1). The Chi-square test results were statistically significant (χ2 = 48.30, p < .001), with an effect size, measured by Cramér’s V, of 0.047, indicating a small effect. In summary, these findings support H1, providing evidence of a significant underrepresentation of women in AI news images.
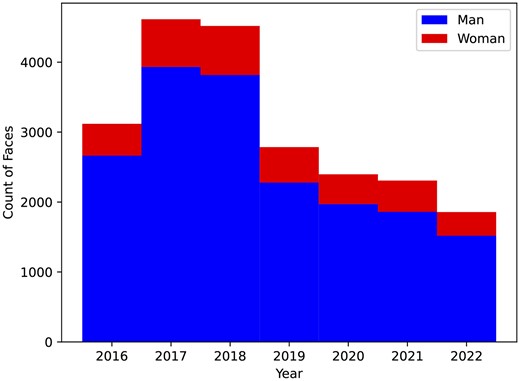
Gender prevalence by year.
RQ1: How the pattern of male and female prevalence varies across digital spaces
A Chi-square test was conducted to assess the distribution of male and female faces across various media platforms. The results of the Chi-square test were not statistically significant (χ2 = 2.82, p = .589), indicating that the distribution of male and female faces in AI news images did not significantly differ across the digital spaces under study (Figure 2). The effect size, as measured by Cramér’s V, was 0.011, suggesting a negligible effect. Overall, the findings for RQ1 suggest that the underrepresentation of women in AI news images is consistent across the examined digital spaces.
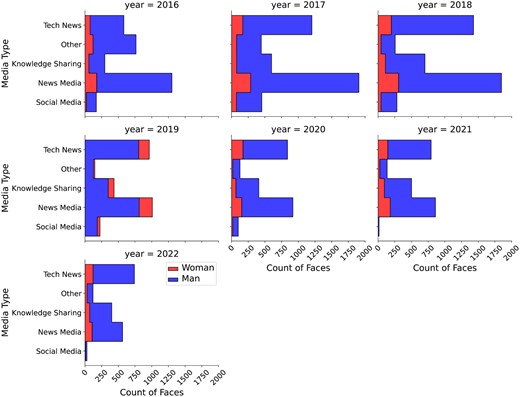
Gender prevalence by year and media type.
H2: The visual framing of women in AI news as disempowered compared to men
Our logistic regression model with L1 regularization, evaluated using nested cross-validation (k = 5), yielded a mean accuracy score of 0.6765.2Table 1 demonstrates that women in images are more likely to have averted gaze (β = −0.0316), upright postures (β = −0.0120), and background roles (β = −0.0220). These findings partially support H2, highlighting distinct visual framing patterns for men and women in AI news images.
RQ2: How this pattern of visual framing varies across different digital spaces
In the extended logistic regression model for RQ2, which included media type as an additional independent variable, the mean accuracy score was 0.6538. As shown in Table 1, adding the variable media type did not significantly change our model fit, and the coefficients for each media type were relatively weak. Specifically, the coefficients for knowledge sharing, news media, social media, tech news, and others were −0.0662, 0, 0.0134, −0.0282, and 0.0402, respectively. These values suggest that the visual framing of gender in AI news images does not vary substantially across different digital spaces. In other words, women are consistently framed as underpowered across various digital platforms.
RQ3: Exploratory analysis on gender representation in AI news across digital spaces
Our cluster analysis yielded seven distinct clusters of images (Figure 3B in the Supplementary Materials), each representing a unique visual theme. (a) The first cluster, labeled as photos of celebrities, primarily consists of close-up shots of renowned figures in the AI field, such as Andrew Ng and Fei-Fei Li. (b) The second cluster, labeled as symbolized faces, comprised composite images where human faces typically occupy one side, often juxtaposed with words or other visual elements. (c) The third cluster, labeled as outdoors interaction, depicts individuals engaging with objects outdoors, capturing a sense of interaction with the environment. (d) The fourth cluster, labeled as side portraits, is characterized by side-face portraits, mostly composite images, offering a profile view of the subjects. (e) The fifth cluster, labeled as indoor interactions, is similar to the third but features indoors, focusing on people interacting with objects within confined spaces. (f) The sixth cluster, labeled as presentation postures, centers on real people delivering speeches or presentations, capturing the essence of public speaking. (g) The seventh cluster, labeled as upper-body portraits, resembles the sixth but emphasizes more body parts, such as half-length portraits, providing a more comprehensive view of the speakers. These clusters encapsulate a diverse range of visual narratives, reflecting the multifaceted nature of gender representation in AI news images.
We calculated the proportion of gender (woman, man, and undetermined3) within each digital space (i.e., media type) for each cluster (see Table 2) and constructed two matrices with rows representing clusters and columns representing media types. One matrix contained the proportion of women’s faces, and the other contained the proportion of men’s faces. Figure 3 depicts the difference between those two matrices. We then performed a Wilcoxon Signed-Rank Test to investigate the difference in distributional patterns of men’s faces versus that of women’s faces. This nonparametric test is used to compare two related samples or repeated measurements on a single sample, especially when the distribution of differences between the two paired groups is not normally distributed. Our results (W = 0,4p < .001) indicate a significant difference in the distribution of men’s and women’s faces across the clusters within various digital spaces, suggesting distinct patterns in gender representation.
Logistic regression models for visual framing and gender (across digital spaces)
| Model 1 (H2) | Model (RQ2) | |||
|---|---|---|---|---|
| Coefficient | Odds ratio | Coefficient | Odds ratio | |
| Gaze direction (away) | −0.032 | 0.969 | −0.039 | 0.962 |
| Gaze direction (direct) | 0.056 | 1.058 | 0.042 | 1.043 |
| Posture (bending/sitting/lying) | 0.019 | 1.019 | 0.002 | 1.002 |
| Posture (upright) | −0.0120 | 0.988 | −0.026 | 0.974 |
| Facial expression (cheerful) | 0 | 1 | 0 | 1 |
| Facial expression (concerned) | 0.2875 | 1.333 | 0.230 | 1.259 |
| Image proximity (large) | −0.0143 | 0.986 | 0 | 1 |
| Image proximity (medium) | −0.0106 | 0.989 | −0.012 | 0.988 |
| Image proximity (small) | 0.0490 | 1.050 | 0.052 | 1.053 |
| Positional prominence (background) | −0.0220 | 0.978 | −0.013 | 0.987 |
| Positional prominence (center) | 0.1097 | 1.116 | 0.072 | 1.075 |
| Media type (knowledge sharing) | −0.066 | 0.936 | ||
| Media type (news media) | 0 | 1 | ||
| Media type (social media) | 0.013 | 1.013 | ||
| Media type (tech news) | −0.028 | 0.973 | ||
| Media type (other) | 0.040 | 1.041 | ||
| Mean model accuracy | 0.677 | 0.654 | ||
Note. In logistic regression, an odds ratio above 1 indicates that as the predictor variable increases, the odds of the outcome occurring increase. Conversely, an odds ratio below 1 indicates that as the predictor variable increases, the odds of the outcome occurring decrease. An odds ratio of exactly 1 means that the predictor variable does not affect the odds of the outcome.
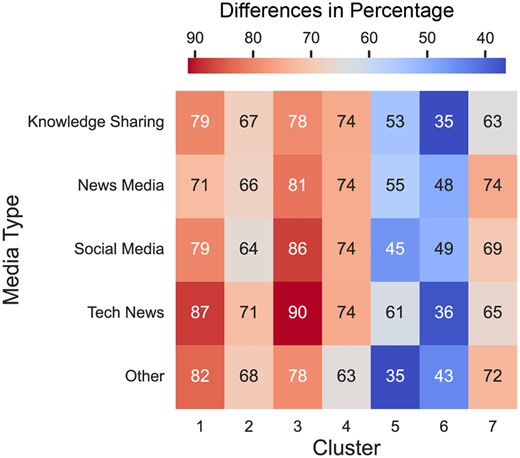
Differential percentage of male vs. female faces by media types and clusters.
Distribution of gender within media type for each cluster
| Cluster | |||||||
|---|---|---|---|---|---|---|---|
| 1 | 2 | 3 | 4 | 5 | 6 | 7 | |
| Knowledge sharing (Total) | 659 | 870 | 734 | 664 | 588 | 396 | 565 |
| Woman (%) | 67 (10.2) | 139 (16) | 76 (10.4) | 85 (12.8) | 137 (23.3) | 126 (31.8) | 103 (18.2) |
| Man (%) | 586 (88.9) | 725 (83.3) | 651 (88.7) | 576 (86.7) | 447 (76) | 266 (67.2) | 459 (81.2) |
| Undetermined (%) | 6 (0.9) | 6 (0.7) | 7 (0.9) | 3 (0.5) | 4 (0.7) | 4 (1) | 3 (0.6) |
| News media (total) | 1,305 | 1,005 | 2,059 | 982 | 1,863 | 1,681 | 2,074 |
| Woman (%) | 187 (14.3) | 165 (16.4) | 191 (9.3) | 125 (12.7) | 415 (22.3) | 429 (25.5) | 264 (12.7) |
| Man (%) | 1,113 (85.3) | 832 (82.8) | 1,855 (90.1) | 848 (86.4) | 1,440 (77.3) | 1,239 (73.7) | 1,800 (86.8) |
| Undetermined (%) | 5 (0.4) | 8 (0.8) | 13 (0.6) | 9 (0.9) | 8 (0.4) | 13 (0.8) | 10 (0.5) |
| Social media (total) | 255 | 532 | 110 | 248 | 149 | 165 | 258 |
| Woman (%) | 17 (6.7) | 74 (13.9) | 5 (4.5) | 32 (12.9) | 29 (19.5) | 51 (30.9) | 44 (17.1) |
| Man (%) | 238 (93.3) | 450 (84.6) | 104 (94.5) | 215 (86.7) | 120 (80.5) | 111 (67.3) | 212 (82.2) |
| Undetermined (%) | 0 | 8 (1.5) | 1 (1) | 1 (0.4) | 0 | 0 | 2 (0.8) |
| Tech news (total) | 1,465 | 1,217 | 1,035 | 1,375 | 1,193 | 1,064 | 1,292 |
| Woman (%) | 126 (8.6) | 191 (15.7) | 112 (10.8) | 165 (12) | 255 (21.4) | 300 (28.2) | 180 (13.9) |
| Man (%) | 1,331 (90.9) | 1,021 (83.9) | 921 (89) | 1,200 (87.3) | 931 (78) | 755 (71) | 1,109 (85.8) |
| Undetermined (%) | 8 (0.5) | 5 (0.4) | 2 (0.2) | 10 (0.7) | 7 (0.6) | 9 (0.8) | 3 (0.3) |
| Other (total) | 412 | 425 | 284 | 311 | 340 | 463 | 330 |
| Woman (%) | 43 (10.4) | 74 (17.4) | 19 (6.7) | 40 (12.9) | 94 (27.6) | 117 (25.3) | 51 (15.5) |
| Man (%) | 367 (89.1) | 346 (81.4) | 264 (93) | 269 (86.5) | 246 (72.4) | 345 (74.5) | 279 (84.5) |
| Undetermined (%) | 2 (0.5) | 5 (1.2) | 1 (0.3) | 2 (0.6) | 0 | 1 (0.2) | 0 |
| Total | 4,096 | 4,049 | 4,222 | 3,580 | 4,133 | 3,769 | 4,519 |
Discussion
The current study comprehensively examines gender representation in AI news images across various digital spaces and the visual framing associated with each gender. Three key takeaways from our findings are: (a) the prevalence of male faces and underrepresentation of women in AI news images across digital spaces; (b) the significant differences in visual framing of male and female faces, with female faces often portrayed being disempowered and adhering to traditional gender stereotypes; and (c) the identification of distinct clusters that reveal diverse linkages between AI and gender (e.g., celebrity use, environmental setting), highlighting the sophisticated nature of “doing” gender. In this discussion section, we will delve into the implications of our results, draw comparisons with prior research, explore potential explanations for the observed patterns, and identify limitations and future directions for further investigation.
Prevalence of male faces and underrepresentation of female faces
Our analysis revealed a pronounced prevalence of male faces and a significant underrepresentation of women in AI news images across various digital spaces (news media, technology news, knowledge-sharing platforms, social media, and others). This observed pattern aligns with previous literature that has documented gender biases in various media contexts (e.g., Singh et al., 2020). Studies have also shown that women are often underrepresented in technology-related fields, reflecting broader societal biases (e.g., Cheryan et al., 2011; Cheryan & Markus, 2020). Our research extends these findings by focusing specifically on AI news images across diverse digital platforms. By employing advanced machine learning techniques and statistical analyses, we were able to uncover subtle patterns and biases that contribute to the ongoing dialogue about gender representation in the media landscape of AI. Our study emphasizes the need for more equitable and diverse portrayals of gender, particularly in areas at the forefront of technological innovation.
Subtle visual framing of women in AI news images
We found distinct patterns in the visual framing of men and women in AI news images. For instance, images with an averted gaze, upright posture, large or medium image proximity, and background prominence were more likely to depict women. Conversely, men were more often associated with direct gaze, concerned facial expression, small image proximity, and center prominence. These patterns do not vary significantly across digital spaces.
These findings resonate with existing literature on gender stereotypes and visual framing in media (Johnson et al., 2022; Nee & De Maio, 2019; Pegoraro et al., 2018). Traditional gender roles often portray women in passive or secondary positions, while men are depicted in more active and dominant roles. Our study extends this understanding to the specific context of AI news images, uncovering subtle visual cues that reinforce these stereotypes. However, there are slight inconsistencies in our findings, such as women in images tending to have an upright posture and large or medium image proximity, while men have bending/sitting postures and small image proximity. This divergence from traditional stereotypes indicates that there might be more contextual information that we need to take into account when referring to disempowerment. Future studies may consider to refine the coding scheme at a finer-grained level to capture these nuances. Additionally, these inconsistencies might be attributed to our sampling bias, emphasizing the need for a more diverse and representative sample in subsequent research.
Consistent patterns of gender representation across clusters
Our cluster analysis identified seven distinct clusters of AI news images, each characterized by unique visual themes such as close-up shots of notable figures, side faces, interactions with objects, and speech scenarios. Despite these diverse visual characteristics, we found a consistent pattern of gender representation across clusters, with a disproportionate overrepresentation of men and underrepresentation of women. This finding aligns with the broader imbalance in gender proportion observed at the outset of our analysis, reflecting a pervasive trend rather than isolated occurrences within specific clusters. Furthermore, our finding testifies to the complex coproduction process of gender relations and AI concept (Bray, 2007).
This consistency across clusters underscores the entrenched nature of gender biases in AI news imagery. It suggests that the visual portrayal of gender is not confined to particular themes or contexts but permeates various digital spaces. The pattern resonates with the broader societal narrative of gender roles and representation, emphasizing the urgency for deliberate efforts to foster a more balanced and inclusive depiction of gender in AI news and media. The persistence of these biases across diverse visual themes highlights the complexity of the issue and calls for a nuanced understanding of the underlying factors. Future research could delve into these contributing elements and devise strategies to challenge and alter these deep-seated norms, promoting a more equitable portrayal of gender in the rapidly evolving field of AI.
Limitations and future directions
Our study, while insightful, has several limitations that warrant consideration. The focus on single-face images may not fully encapsulate the diversity and complexity of AI news images, potentially underrepresenting certain groups or situations. For example, the same upright posture might signify empowerment in a corporate setting but could indicate passivity in a domestic context. This highlights the importance of contextual information in images, which our study may not have fully captured. Another significant aspect to bear in mind is the potential use of digital images in image generation algorithms. By feeding these images into algorithms, there is a risk of perpetuating and amplifying existing biases, which could have broader implications for the AI field. Furthermore, our study did not explore the potential influences of cultural and social factors on gender representations in AI news images. Different cultures may have varying norms and stereotypes related to gender, which could affect the visual framing in AI news across different regions or communities.
While our study provides a comprehensive analysis of gender representation in AI news images, it stops short of examining the effects of these biases on the audience. This limitation is not an oversight but a deliberate scoping decision, as the examination of effects would require a different methodological approach such as experimental design. The effects of media biases in portraying AI are undoubtedly an essential aspect to explore. How do these visual representations shape public perceptions of gender roles within the AI field? What impact might the representations have on women’s participation in STEM fields? How do the representations reinforce or challenge existing gender stereotypes? These are critical questions that deserve attention.
Future research could build on our findings by designing experiments to test the effects of different visual representations on viewers’ attitudes and behaviors. For example, researchers could manipulate the visual framing of gender in AI images and measure the impact on participants’ perceptions of gender roles, career aspirations, or attitudes toward AI technology. Research can also look for visual symbols that may reinforce gender stereotypes. For instance, are women depicted with overtly feminine attributes, such as soft colors and delicate poses, while men are shown as serious and focused? Additionally, given the nuances between different social media platforms, a more granular approach examining individual platforms could yield insights into platform-specific media logic and its influence on AI-related gender portrayals. Such studies would provide insight into the complex interactions between the gendering of AI and the unfolding of media logic in media representations.
In conclusion, our study underscores the importance of addressing gender representation in AI news images across digital spaces, revealing representational disparities that have broader implications for societal perceptions of gender roles and inclusivity in the AI field. Future research should continue to explore these patterns, refine classification methods, and incorporate a broader range of visual cues to better understand the complexities of gender representation. This could include examining how specific visual elements contribute to image complexity differences and investigating the potential influences of cultural and social factors. By building on these findings, researchers can work towards more equitable portrayals of gender in AI news images, fostering a more inclusive and balanced depiction of the AI domain.
Footnotes
After all filtration steps, the remaining images spanned from 2016 to 2022.
When using Lasso regression with nested cross-validation, traditional significance levels are not applicable. Instead, the accuracy score is used for estimation. This approach emphasizes model selection and error estimation, making the concept of significance levels, typically associated with p-values, not relevant in this context.
We included non-human faces in the cluster analysis; undetermined refer to robotic-looking and cartoonish faces.
In the context of the Wilcoxon Signed-Rank Test, a test statistic of 0 means that all the differences between paired observations are either zero or have the same sign. In other words, the ranks of the differences are all in the same direction.
Supplementary material
Supplementary material is available at Journal of Computer-Mediated Communication online.
Data availability
The data underlying this article are available in OSF at https://osf.io/dsajb/?view_only=cd1d797a3c794e21acc208e842d39d61.
Funding
This work was supported by China National Social Science Foundation (Grant no. 22BXW045).
Conflict of interest: None declared.
References
Appendix. Exemplar URLs representing each media category
| Category | URLs |
|---|---|
| Knowledge-sharing platforms | |
| Technology-info sites | |
| Social media | |
| News media |
| Category | URLs |
|---|---|
| Knowledge-sharing platforms | |
| Technology-info sites | |
| Social media | |
| News media |
 Open Data
 Open Materials
