


Abstract
The longitudinal associations between Facebook use and well-being have received limited exploration with mixed results. We argue that the transition pattern of an individual’s social grooming style based on five social grooming behaviors at different times—referred to as the social grooming transition pattern—is the key to exploring this issue. Based on the social grooming style framework, we employed latent transition analysis through a nationally representative, three-year panel survey (N = 710) in Taiwan. We found that active users remained active in social grooming behavior and had options to shift, and inactive users largely remained inactive in terms of Facebook social grooming style. The results indicated that persistent social image managers gained the most social capital and well-being, greater than persistent social butterflies and those who transitioned from image managers to social butterflies, indicating that adopting strategic social grooming styles in the long-term delivered the best social outcomes.
Lay Summary
The long-term interaction between Facebook use and well-being has received limited attention with mixed results. One way to examine this is to study changes in the way that we “groom” one another in Facebook. That is, how we socially interact with others by discussing different topics with various styles and strategies. Based on the social grooming framework, we provide the first study employing latent transition analysis (i.e., to track how people change or maintain their social grooming style across time) to examine this issue using a nationally representative, three-year panel survey from Taiwan. Our study shows that most people maintain a stable user style over time. However, some become less active (e.g., they become “maintainers” or “lurkers”). Thus, the majority of Taiwanese users often do not create their own postings, but rather comment on, or simply view, the content of other Facebook users. By contrast, users who actively groom (e.g., those who are persistent “social butterflies” or “image managers”) continue to create online posts. Our analysis shows that users who are highly social benefit from greater bridging social capital. However, the strategically active social groomer is the winner as they benefit by gaining greater bridging social capital, social connectedness, and social life satisfaction.
Communication researchers have long been interested in the associations between communication technology and its social implications, such as well-being and social capital (Brandtzæg, 2012; Burke & Kraut, 2016). Approaches to understanding the abundant dynamics of social network site (SNS) usage have evolved along the way. On the basis of the user versus nonuser approach (Utz & Breuer, 2017), usage intensity (Ellison, Steinfield, & Lampe, 2007), channels of use (Shakya & Christakis, 2017), and types of communication ties (Burke & Kraut, 2016), researchers strive to understand how different means of interaction, with whom and on what channel, will influence users’ well-being and social capital.
Within these various approaches, researchers have called for studies to employ the “user style” approach based on various behaviors as opposed to a single behavior to obtain a more complete understanding of social style. For example, Brandtzæg (2012) classified users into five styles—sporadics, lurkers, socializers, debaters, and advanced—based on a combination of social and nonsocial activities that users engage on SNSs. Employing signaling theory, Lin (2019) argued that the topics we choose to discuss and how we socially interact with others—termed social grooming styles—have a key impact on social outcomes. The emergent social grooming styles identified in Lin’s (2019) study (i.e., social butterflies, image managers, trend followers, relationship maintainers, and lurkers) showed that a “social grooming style,” which is based on five social grooming behaviors, is an effective and useful approach to understand the association between SNS use and social outcomes.
Social outcomes are formed and affected by the accumulation of social interactions through communication technology, and examining the longitudinal associations between SNS use and social outcomes is key to advancing our knowledge. Very few studies have examined this issue through the longitudinal approach and the results have been mixed, which may be due to the employment of use and frequency as the lens to explore this issue (Steinfield, Ellison, & Lampe, 2008; Verduyn et al., 2015). In addition, most of the longitudinal research treats time 1 (T1) use as a lagged factor for time 2 (T2) social outcomes, which provides a limited scope from which to capture changes in use over time. The current study suggests that SNS users may change their social grooming user style over time. Therefore, longitudinal research must consider user style changes over time—referred to as user style transition patterns—when longitudinally examining the associations between user style and social outcomes. This study thus aims to be the first to examine how the social grooming style changes over time and whether these social grooming style transition patterns are associated with social outcomes such as social capital and well-being. Social media use has been largely integrated into our daily life for social and entertainment use. The proposed novel approach allows us to further identify increasing variations among how individuals participate in SNSs and the various social outcomes.
We first review the previous longitudinal studies on this topic and then briefly review the social grooming style framework from signaling theory as a theoretical basis (Lin, 2019), followed by the research questions that are posed for this study. Employing two waves of nationally representative panel data from 2017 to 2019, this study provides an examination of both longitudinal transition patterns and cross-sectional data.
Longitudinal research on the approaches of social media use and social outcomes
Two types of social outcomes, social capital and well-being, have received extensive attention in communication research (Liu, Ainsworth, & Baumeister, 2016; Song et al., 2014). Social capital, which forms through accumulative social interactions with others, refers to the social resources embedded within one’s social network (Lin, 2002). Bonding social capital is usually formed via tight connections, such as family and close friends, and can provide intimate emotional support and important information. Bridging social capital consists of loose social connections such as acquaintances or friends of friends, which have potentially rich resources for diverse information and can provide potential job or class mobility (Granovetter, 1973). Existing research has indicated that Facebook usage is an effective tool to gain bridging social capital (Ellison et al., 2007).
Well-being in communication research consists of complex dimensions and does not have a fixed measurement. Composite measures of both hedonic and eudaimonic perspectives, including personal relationships with others and the evaluation of one’s positive affect (Ryff & Singer, 2008), are often adopted in various studies (Brandtzæg, 2012; Burke & Kraut, 2016; Lin, 2019). This study employed the above measurement, including perceived social connectedness, happiness, loneliness, life satisfaction, and social life satisfaction.
Whereas most examinations of social media use and social outcomes are cross-sectional, few longitudinal studies provide fine-grained data to further explain the associations. We organized the existing longitudinal research on this topic in Table 1 according to the main approach used to assess SNS use, sample, and results. Regarding the approach to social media use, some longitudinal studies defined and measured such use in terms of intensity (Steinfield et al., 2008)—a mixture of behavioral self-report assessment (i.e., usage time) and psychological adherence (i.e., habit). Steinfield et al. (2008) found that the intensity of Facebook usage at T1 had a positive influence on bridging social capital at T2, whereas self-esteem moderated the association. Another common approach to the study of social media use is to examine differences in well-being among users and nonusers. For example, Utz and Breuer (2017) examined well-being and social support among SNS users and nonusers through six-wave data and found that life satisfaction did not differ between users and nonusers, although SNS users perceived greater social support than nonusers. However, a report also indicated that SNS users expressed greater levels of loneliness than non-SNS users (Brandtzæg, 2012). These mixed results may be due to the gradual adoption rate of SNSs in the early phase leading to contradictory outcomes. In addition, most studies adopt the frequency approach (i.e., “usage time” and a “user versus nonuser” approach), which provides a scope that is too general.
Description of Longitudinal Studies Regarding Social Media Use and Social Outcomes
| Social media “use”; | Sample | Results (positive, negative, mixed). | |
|---|---|---|---|
| Lagged factor or changed style | |||
| Steinfield et al. (2008) | FB intensity (use time and habits); | Years 2006–2007 (panel: 92; 2006: 277 U.S. respondents). | Positive, FB intensity at year 1 positively predicted bridging social capital (BSC) at year 2. Self-esteem moderates FB intensity on BSC. |
| Lagged factor | |||
| Verduyn et al. (2015) | Active versus passive FB use, direct social interactions on FB; lagged factor | Six days in a year before publication year 2015 with 89 U.S. respondents. | Conditional negative. Passive FB use undermines affective well-being. |
| Utz and Breuer (2017) | SNS users versus nonusers; | Six waves starting in the fall of 2013, with six months as the interval. Panel data had 1,330 Dutch respondents. | Positive. SNS users had more online social support than nonusers. No difference in life satisfaction. |
| Lagged factor | |||
| Shakya and Christakis (2017) | Links, likes, and status updates; lagged factor | Three waves in three years. Gallup polls on American households; 10,680 individuals in the panel, with subsets used for analyses. | Negative effects. A 1 standard deviation of likes clicked, links clicked, or status updates was associated with a decrease of 5–8% of a standard deviation in self-reported mental health. |
| Burke and Kraut (2016) | Broadcast, one-click, targeted and composed content; lagged factor | 1,910 Facebook users in the panel, June to August 2011. | Conditional effect. Receiving targeted and composed content from strong ties leads to increased well-being; viewing broadcasting and receiving one-click do not. |
| Teppers et al. (2014) | Adolescent motivation to use Facebook; lagged factor | Two waves (five-month interval, sometime prior to publication in 2014) of a panel of 256 Belgium adolescents aged 14–19 years. | Conditional effect. Facebook use for making new friends reduced peer-related loneliness over time, whereas Facebook use for social skills compensation increased peer-related loneliness over time. |
| Valkenburg et al. (2017) | Social esteem and SNS use; lagged factor | Three time points between September 2012 and December 2014 with one-year intervals in The Netherlands. Panel of 852 adolescents aged 10–15 years. | The longitudinal results: Adolescents’ initial SNS use did not significantly influence their social self-esteem in subsequent years. In contrast, their initial social self-esteem consistently influenced their SNS use in subsequent years. |
| Reinecke and Trepte (2014) | Online authentic behavior; lagged factor | A two-wave online panel (N = 374) survey from October 2010 to April 2011 in Germany. | Conditional positive effects that online authenticity had a positive longitudinal effect on three indicators of subjective well-being. |
| Brandtzæg (2012) | Users and nonusers; User type: socializers, lurkers, sporadics, debaters, and advanced; lagged | Norwegian online users (N = 2,000 in wave 1, wave 2 = 1,372, wave 3 = 708; age 15–75 years) in three annual waves (2008, 2009, and 2010). | Mixed results—(negative and conditional). SNS users, in particular males, reported more loneliness than nonusers. Socializers reported higher levels of social capital than other user types. |
| Current study | Latent transition pattern based on latent class (social grooming styles) at two time points; Changed style | National panel sample with 710 Taiwanese users aged 18 years and older in two waves (August 2017 and July 2019). | Long-term strategic social grooming yields the greatest benefits. Persistent image managers reported greater bridging social capital, greater social connectedness and social life satisfaction than other less active transition patterns. |
Other longitudinal research adopted various detailed approaches, such as motivation, social media activities, and the types of content with which users interact on social media to explore different dimensions of social media usage on users’ well-being. For example, Reinecke and Trepte (2014) found that authentic user behavior on SNSs intended to present the “true me” leads to greater subjective well-being. Teppers, Luyckx, K. Klimstra and Goossens (2014) found that adolescents’ motivation to use Facebook had different effects on their loneliness—the use of Facebook to make new friends leads to greater loneliness as opposed to the use of Facebook to improve social skills. Shakya and Christakis (2017) differentiated among modes of interacting on Facebook but found that greater activity (clicking links, clicking likes, or status updates) leads to worse mental health. By contrast, Burke and Kraut (2016) found the conditional effect that receiving targeted and composed content from strong ties leads to greater well-being, whereas receiving likes and browsing broadcasting updates do not. Other research has also differentiated between active and passive Facebook use and indicated the negative effects of passive Facebook use on loneliness (Verduyn et al., 2015). Although these longitudinal studies strive to study active social media usage based on the ways SNSs are used (e.g., motivation, number of activities, and types of communication content), the results are mixed (Valkenburg, Koutamanis, & Vossen, 2017). This variability may be due to the particular approach used to study SNS use, which provides a limited scope for researchers to examine such associations.
Since social media has been integrated in our lives as we are dependent on digital tools for social interactions and maintenance, the research in this line has naturally evolved from the study of use/nonuse and usage time to more nuanced approaches employed to understand how individuals develop social grooming styles (Lin, 2019) in social media and the impact of styles on social outcomes. The concept of “active use” in social media studies is no longer limited to whether we use it or how much we use it (i.e., usage time) but, rather, how we use it to obtain social outcomes.
Rather than studying the modes and frequency of SNS usage, evidence based on user style (Brandtzæg, 2012) that addresses how we use social media has indicated that socializers who engage in all activities on SNSs reported greater social capital outcomes than other types of users. In a cross-sectional study, Lin (2019) further suggested that social grooming style theorized based on signaling theory serves as an effective approach to understand the nuance of user social interactions. As indicated in Lin’s paper (2019; see the paper for a more theoretical argument), Brandtzæg (2012) defined user style as activities in SNSs, including activities not related to social interaction such as playing games. Lin (2019) theorized social grooming behavior based on perceived costs and benefits from signaling theory and proposed a framework of social grooming behavior, which is the first theoretical approach to define social media use specifically focusing on social interactions.
We argue that in longitudinal research, employing a social grooming style to identify transition patterns is key. The only longitudinal research employing user style (Brandtzæg, 2012) indicated opposite results for some user classes compared with those in Lin’s (2019) cross-sectional study. This difference may have arisen because Brandtzæg (2012) considered user style only at the initial time point and did not consider potential changes in user style at T2 and time 3 and focused solely on loneliness and bridging social capital as social outcomes. In addition, the existing longitudinal studies have either considered only lagged usage frequency at T1 as a predictor of social outcomes at T2 or have not considered changes in user style over time. The present study argues that changes in social grooming style over time are an important consideration when attempting to understand how social outcomes fluctuate (or not) across time. As opposed to the overly general or overly limited scope, the social grooming transition style provides nuanced changes in social grooming styles over time to capture user styles at different time points. We also argue that to use the longitudinal approach, transition style is a key factor that can only reflect changes over time. The theoretical framework of social grooming style is briefly reviewed in the next section.
Social grooming style and transition pattern
Based on signaling theory, Lin (2019) proposed a social grooming behavior framework identifying the updating of topics by users on their statuses as a social grooming tactic. In this framework, five social grooming behaviors were identified and categorized based on the costs and self-relevance dimensions. In SNSs, users freely choose the topics they discuss as the means to socially interact with others. They can talk about themselves (high self-relevance) or public figures and news (low self-relevance). In addition, within self-disclosure, emotional and information self-disclosure are theorized as having high versus low costs. Within public topics, controversial debates and trending/noncontroversial topics are theorized as having high versus low costs. Finally, relationship maintenance behavior does not require status updates but, rather, focuses on commenting on or clicking emoticons on other people’s posts, which is theorized as having the lowest cost among the five behaviors.
Lin (2019) argues that researchers should consider all behaviors to form a social grooming style as opposed to regressing social outcomes on various single behaviors. For example, latent class analysis (LCA) has been used to identify five social grooming styles—social butterflies (who frequently engage in all five social grooming behaviors), image managers (who selectively socialize with others and avoid controversial and trending topics), trend followers (who mostly talk about trending topics), relationship maintainers (who frequently engage only in relationship maintenance), and lurkers (who neither post nor comment on others’ posts). In Lin’s (2019) national representative data, lurkers (30.18%) and maintainers (28.76%) constitute more than half of the sample, followed by image managers (27.74%), social butterflies (8.27%), and trend followers (5.04%). We suggest that this theoretical framework serves as the basis from which to study how users interact on social media.
Due to increased privacy concerns in recent years, users may be reluctant to self-disclose on SNSs (Trepte & Reinecke, 2011). It is interesting to track changes in social grooming style over time, especially when several data-leaking scandals and accidents (Isaac & Frenkel, 2018) occurred during the three years covered by the data. The following research question is thus proposed.
RQ1: What are the distinctive social grooming styles among Facebook users at T1 (2017) and T2 (2019)?
In addition to identifying social grooming styles, Lin (2019) also found that social grooming styles differ significantly in terms of social capital and well-being. Social butterflies had high bridging social capital and were least lonely but also had the least bonding social capital. Image managers were the social winners, with high bonding and bridging social capital and well-being. Trend followers had high bridging social capital but reported low well-being. Lurkers reported the lowest social capital and well-being. Maintainers had similar social outcomes as lurkers and only slightly better life satisfaction and social connectedness. These results indicated that strategic social grooming is key to gaining the best social outcomes, contrary to the implicit assumption of a linear association between greater social media use and social outcomes in the existing literature.
To study longitudinal user behavior, transition patterns reveal the various means by which individuals change between these social grooming styles over time. On the basis of various indicators over time, the latent classes identified in each wave of data can form various patterns to show how users transition within these styles, which can be persistent (no change) or transition to other styles. These transitions or trajectories can illustrate how users behave over time and provide a fine-grained picture for researchers to understand user behavior. For example, in the context of health research, using four health behavior indicators, specifically, smoking, binge drinking, obesity, and sedentary status, Daw, Margolis & Wright (2017) identified seven transition patterns, such as “consistently healthy,” “healthy but increasingly obese,” and “active, smokers and drinkers” across four waves of data collection. Similarly, the transition pattern approach to social grooming styles allows us to further identify whether individuals maintain (i.e., consistent social butterflies) or change their social grooming styles over time (e.g., T1 lurkers to T2 social butterflies) and how these patterns differ from each other regarding their social outcomes.
Transition patterns can better reflect the essence and change of so-called “active” or “passive” social media use from a long-term perspective. The five social grooming styles from Lin’s (2019) model reflect various levels of the continuum of status from active to passive using a nuanced approach. For example, social butterflies, image managers, and trend followers are all active user styles and their grooming styles are different. Lin (2019) argues that being strategic (i.e., image managers who cherry-pick the topics to engage in social grooming) has the greatest social benefits among the social grooming styles identified. Transition patterns further capture the changes between these styles over time and provide a more complete lens through which to investigate social media use styles over time. For example, does social capital differ between consistent active patterns and consistent passive patterns? Does well-being differ between active-to-passive patterns and passive-to-active patterns? Adopting this approach provides a comprehensive means to explore these research questions in longitudinal research, offering theoretical advancement and novelty.
This study argues that as opposed to using a lagged factor in T1 to assess the association between T1 use and T2 social outcomes, transition patterns reflect the style considering both T1 and T2 social grooming styles, allowing us to examine how social grooming behavior “changes over time” influences social outcomes. Therefore, this study adopts the transition pattern approach to understand longitudinal associations.
RQ2: What are the social grooming transition patterns among Facebook users from 2017 to 2019?
RQ3: How are social grooming transition patterns associated with bonding and bridging social capital?
RQ4: How are social grooming transition patterns associated with well-being?
Method
Sample
Among 1,350 respondents who were 18 years or older who used Facebook from August to November 2017 (N = 2,138), 710 (52.59% retention rate) participated in the follow-up survey from July to October 2019 (N = 710 + 2000 cross-sectional sample) and thus served as the sample for this longitudinal study. Both surveys are from the Taiwan Communication Survey (TCS), which includes an annual survey with a face-to-face, computer-assisted personal interview (CAPI) method. A three-stage stratified proportional-to-size (PPS) approach was employed to deliver a nationally representative sample (see the TCS website). The first stage was to choose the legislative area (seven layers) followed by the smallest statistical area sampling (first stage, 380 units), house number sampling (second stage), and household selection (third stage, which determined the age that represents the population proportion). Among the 710 participants in the panel data, the average age was 44.04 years (SD = 11.97, range: 20–78) and 45% were male, with users spending an average of 796.17 (SD = 851.40)t1 and 762.75 (SD = 876.58)t2 minutes per week on Facebook. Regarding their social media time in general and other specific social media platforms, Table 2 lists the minutes and numbers of participants using the media. The participants continued using Facebook from 2017 and 2019, and they increasingly used Instagram.
Social Media Use Time (in minutes) and Frequency of Specific Platforms across 2017 and 2019
| Wave | SNS time | FB | IG | Plurk | |||
|---|---|---|---|---|---|---|---|
Panel data (use FB in both waves) (the analyzed sample in this study, N = 710) | |||||||
| 1 (2017) | M = 796.2 | 710 | 23 | 25 | 124 | 42 | 4 |
| 2 (2019) | M = 762.7 | 710 | 52 | 52 | 222 | 48 | 7 |
Panel data from both waves (N = 1,272) | |||||||
| 1 (2017) | M = 624 | 768 | 25 | 29 | 129 | 48 | 5 |
| 2 (2019) | M = 547.4 | 826 | 60 | 58 | 238 | 53 | 8 |
Measurements
All measurements in 2019 were completely the same as those in 2017 (Lin, 2019). Regarding social grooming behavior, the same five questions (Lin, 2019) about the frequency of each social grooming behavior featured in Table 3 with a four-point scale represented by 1 (never), 2 (very few times), 3 (sometimes), and 4 (often) were employed. Bonding social capital (α = .86, Mt1 = 3.93, SDt1 = .71; Mt2 = 3.95, SDt2 = .68) and bridging social capital (α = .84, Mt1 = 3.66, SDt1 = .71; Mt2 = 3.78, SDt2 = .69) at T1 and T2 both had good reliability. Both scales consisted of three statements with response items 1 (strongly disagree), 2 (disagree), 3 (average), 4 (agree), and 5 (strongly agree).
Description of Five Social Grooming Behaviors in Latent Transition Models (N = 710)
| Indicators of latent status | T1 | T2 | ||
|---|---|---|---|---|
| Frequency (%) | Frequency (%) | |||
Emotional self-disclosure (“How often do you share your emotions on your Facebook wall?”) | ||||
| Low | 555 | 78.17 | 549 | 77.32 |
| high | 155 | 21.83 | 161 | 22.68 |
Informational self-disclosure (“How often do you share daily general events on your Facebook wall (such as where you are, what you are doing, eating, watching, or listening to)?”) | ||||
| Low | 426 | 60.00 | 454 | 63.94 |
| High | 284 | 40.00 | 256 | 36.06 |
Controversial topics (“How often do you discuss controversial issues on your Facebook wall [such as same-sex marriage, nuclear power]?”) | ||||
| Low | 633 | 89.15 | 639 | 90.00 |
| High | 77 | 10.85 | 71 | 10.00 |
Trending topics (“How often do you discuss current noncontroversial and trending topics [such as online quizzes, popular games, or interesting news]?)” | ||||
| Low | 563 | 79.30 | 579 | 81.55 |
| High | 147 | 20.70 | 131 | 18.45 |
Relationship-maintenance (“How often do you respond to other people’s posts on Facebook [including like clicks, emojis, or comments)?)” | ||||
| Low | 200 | 28.17 | 186 | 26.20 |
| High | 510 | 71.83 | 524 | 73.80 |
Well-being was measured using composite indicators including social connectedness (Mt1 = 3.26, SDt1 = .83; Mt2 = 3.43, SDt2 = .82, “You feel that you are closer to your friends through interactions with friends on Facebook, including only reading posts or viewing photos,” Köbler et al., 2010); life satisfaction (Mt1 = 3.61, SDt1 = .77; Mt2 = 3.67, SDt2 = .74, “Generally, are you satisfied with your life?,” Diener et al., 1985); social life satisfaction (Mt1 = 3.65, SDt1 = .71; Mt2 = 3.73, SDt2 = .70, “Generally, are you satisfied with your social life?,” Lin, Peng, Kim, Kim, & LaRose, 2012); happiness (Mt1 = 3.74, SDt1 = .69; Mt2 = 3.75, SDt2 = .71, “Generally, are you happy with your current life?”, Keyes, 2009); and loneliness (Mt1 = 2.23, SDt1 = .75; Mt2 = 2.25, SDt2 = .74, “Generally, do you feel lonely in your current life?,” Russell, 1996). All items were rated on five-point scales ranging from 1 (strongly disagree, completely unsatisfied, very unhappy, not at all lonely) to 5 (strongly agree, completely satisfied, very happy, very lonely).
We recorded the participants’ sex, age, marital status and education as their demographic information. The participants indicated their sex, birth year, marital status (recoded as single, married and other, including divorced, separated, living together but not married and deceased) and education levels.
Analysis
To study longitudinal user behavior, transition pattern research using latent transition analysis (LTA) is preferred in the social, behavioral and health literature (Daw et al., 2017). LTA is a longitudinal extension of LCA. In LTA, individuals may change membership in latent statuses over time. Thus, when modeling social grooming style over time as a categorical latent variable, multiple aspects of Facebook use behavior are assessed across two occasions and can be used to jointly indicate an individual’s behavior status over time. Therefore, LTA can be applied to identify and describe classes of individuals with distinct characteristics of social grooming style over time. At each time point, an individual’s behavior status can be identified and transition probabilities from T1 to T2 reflect a parsimonious summary of change in social grooming style over time. That is, LTA provides information about which social grooming style at T1 corresponds to the highest likelihood of transitioning to latent status at T2. Finally, whether individuals with different transition patterns of social grooming style between two time points experience or enjoy different social lifestyles, including social capital and well-being, can be further demonstrated. The details are summarized in the Methodological Appendix.
We first employed LTA to identify the distinct transition patterns of social grooming styles over time. We conducted several latent transition models with different numbers of statuses to determine which model would be more appropriate for the transition patterns of social grooming styles over time based on the G2, AIC, and BIC criteria for assessing model fit (Collins & Lanza, 2010). We then predicted the latent transition pattern for each individual according to the identified LTA with all observed variables of social grooming behaviors in a two-wave survey. Finally, we used fixed-effects models (Allison, 2009) with predicted transition patterns as the independent variables to investigate how an individual’s social capital and well-being are associated with these distinct transition patterns.
Results
We first explored how users engage in five social grooming behaviors following Lin (2019) and Knight and Brinton (2017). The original 4-point response scale was recoded as a two-category variable with 1 (never) and 2 (very few times) recoded as 1 (low usage) and 3 (sometimes) and 4 (often) recoded as 2 (high usage). The dichotomization greatly reduced the error and stabilized the estimation of conditional probability patterns using LCA. In addition, the dichotomization preserved high versus low use, which is consistent with the theoretical argument in the literature (Knight & Brinton, 2017).
RQ1 explores changes in social grooming style over time. LTA was conducted for the 710 panel participants at T1 and T2. Based on theory and prior studies, five latent statuses at each time of two waves were identified (Table 4). The proportions of these five classes at T1 and T2 were similar. The five classes are social butterflies (T1: 8.96%, T2: 6.23%); image managers (T1: 12.81%; T2: 14.76%); trend followers (T1: 11.1%; T2: 13.4%); relationship maintainers (T1: 30.82%; T2: 27.32%); and lurkers (T1: 36.31%; T2: 38.29%). Table 5 presents the conditional probability of each behavioral indicator with a high response given a corresponding social grooming style. Note that the conditional probabilities are constrained the same at T1 and T2.
RQ2 explores the transition pattern from T1 to T2. LTA was employed with five social grooming styles for the two waves of data. LTA determined how a user changes (or does not change) their social grooming style over time. Table 6 shows the model statistics of all potential ideal latent statuses. The results indicated that the five-latent-status model has the best model fit and corresponds with our theoretical argument: the model has the lowest AIC, G2, and G2 (Nagelkerke et al., 2016).
Latent Transition Model with Five Statuses of Social Grooming Behaviors for Facebook Users
| Status | 1 | 2 | 3 | 4 | 5 |
|---|---|---|---|---|---|
| Social butterfly | Image manager | Trend follower | Relationship maintainer | Lurker | |
| T1 | 0.0896 | 0.1281 | 0.1110 | 0.3082 | 0.3631 |
| T2 | 0.0623 | 0.1476 | 0.1340 | 0.2732 | 0.3829 |
| Status | 1 | 2 | 3 | 4 | 5 |
|---|---|---|---|---|---|
| Social butterfly | Image manager | Trend follower | Relationship maintainer | Lurker | |
| T1 | 0.0896 | 0.1281 | 0.1110 | 0.3082 | 0.3631 |
| T2 | 0.0623 | 0.1476 | 0.1340 | 0.2732 | 0.3829 |
Probability of Response to Indicators of Social Grooming Behavior
| Observed variable of social grooming style | Latent status (T1 and T2) | ||||
|---|---|---|---|---|---|
| 1 | 2 | 3 | 4 | 5 | |
| Social butterfly | Image manage | Relationship maintainer | Trend follower | Lurker | |
| Emotional self-disclosure | 0.9764 | 0.7353 | 0.0066 | 0.3473 | 0.0067 |
| Informational self-disclosure | 1.0000 | 0.8599 | 0.3880 | 0.4802 | 0.0379 |
| Controversial topics | 0.6492 | 0.0000 | 0.0000 | 0.4008 | 0.0156 |
| Trending topics | 0.9168 | 0.1293 | 0.1489 | 0.5307 | 0.0000 |
| Relationship maintenance | 0.9785 | 0.8094 | 0.9014 | 0.9230 | 0.4482 |
Diagnostic Statistics for LTA of Social Grooming Behavior
| Number of latent statuses | OG-LIKELIHOOD | df | G2 | AIC | BIC |
|---|---|---|---|---|---|
| Two latent statuses | −3245.86 | 1,010 | 648.14 | 674.14 | 733.49 |
| Three latent statuses | −3181.52 | 1,000 | 519.45 | 565.45 | 670.45 |
| Four latent statuses | −3149.58 | 988 | 455.58 | 525.58 | 685.36 |
| Five latent statuses | −3125.62 | 974 | 407.65 | 505.65 | 729.35 |
The transition probabilities of the social grooming style from T1 to T2 are presented in Table 7 and Figure 1. The diagonal from top left to bottom right indicates users who maintained their social grooming style over time (persistent social butterflies, persistent image managers, persistent relationship maintainers, persistent trend followers, and persistent lurkers). The reported proportions indicate the probability of a user experiencing a social grooming style transition from T1 to T2. For example, 0.4156 in column 1 and row 1 (termed group 11, g11) indicates that 41.56% of social butterflies at T1 remained social butterflies at T2. Among the social butterflies at T1 (row 1), 41.56% remained social butterflies at T2; however, 21.32% transitioned to image managers, 22.99% shifted to relationship maintainers, 14.12% became lurkers, and 0% became trend followers. Among the image managers, 44.06% remained the same at T2, 15.58% became more active as social butterflies, 21.23% became trend followers, 13.92% became relationship maintainers, and 5.21% became lurkers. Among the trend followers, approximately half (48.09%) remained the same and 43.75% became inactive (lurkers). Among the maintainers, 70.61% remained the same; however, some became more active 1.67% social butterflies, and 2.48% trend followers), whereas very few became lurkers (4.81%). Finally, 82.67% of the lurkers at T1 remained lurkers at T2 and very few became more active (2.5% image managers, 12.61% trend followers, and 2.22% maintainers).
RQ3 explores the association between the above social grooming style transition patterns and bonding and bridging social capital. To determine how the transition pattern relates to changes in bonding and bridging social capital, T2 bonding and bridging social capital were considered outcome variables. Two lagged regression analyses were performed with persistent image managers (g22) as the reference group compared with the rest of the 12 groups (only groups with 10 or more participants were considered). We set persistent image managers (g22) as the reference group because in a concurrent study (Lin, 2019), image managers reported the greatest social outcomes among the groups identified. In the model, T1 social capital and T1 well-being (life satisfaction, social life satisfaction, happiness, loneliness, and social connectedness) were the covariates. We included the demographic variables and all T1 social capital as well as well-being as the control variables because these indicators of social outcomes should influence T2 social outcomes together. The complete results can be found on the OSF link in Appendix. The results showed that, after controlling T1 social capital and well-being, social grooming style transition pattern did not have influence on bonding social capital at T2, (the stats remained the same). Male participants reported lower bonding social capital (t = −3.1, p < .001) than female participants.
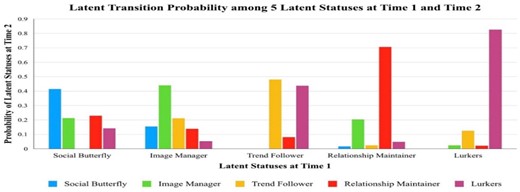
Latent transition probability among five latent statuses at T1 and T2.
Transition Probabilities between Latent Statuses at T1 and Latent Statuses at T2
| T2 (columns) | 1 (Social butterfly) | 2 (Image manager) | 3 (Trend follower) | 4 (Relationship maintainer) | 5 (Lurker) |
|---|---|---|---|---|---|
| T1 (row) | |||||
| 1 (Social butterfly) | 0.4156 | 0.2132 | 0.0000 | 0.2299 | 0.1412 |
| 2 (Image manager) | 0.1558 | 0.4406 | 0.2123 | 0.1392 | 0.0521 |
| 3 (Trend follower) | 0.0000 | 0.2042 | 0.4809 | 0.0816 | 0.4375 |
| 4 (Relationship maintainer) | 0.0167 | 0.0000 | 0.0248 | 0.7061 | 0.0481 |
| 5 (Lurkers) | 0.0000 | 0.0250 | 0.1261 | 0.0222 | 0.8267 |
Note. The level of darkness of the colors indicates the degree of the proportion: the higher the proportion, the darker the color.
Regarding bridging social capital at T2, the social grooming style transition pattern was significant: F(24, 645) = 6.64, p < .0001, R2 = .20. Persistent lurkers (g55) had significantly lower T2 bridging social capital than persistent image managers (g22), β = −.24 (.24 units of bridging social capital lower than g22), SE = .12, t = −2.09, p = .037. Other transition groups did not differ from persistent image managers (g22) regarding T2 bridging social capital. Age had a negative association with bridging social capital, β = −.01, SE = .002. t = −2.79, p < .001. Education was a positive covariate, β = .04, SE = .01. t = 3.73, p = .002. When the reference group was changed from g22 to g11 (i.e., persistent social butterflies), persistent lurkers (g55) also reported significantly lower bridging social capital: β = −.28, SE = .14. t = −1.98, p = .048.
RQ4 explores how the social grooming transition group was associated with well-being over time. A series of lagged regression analyses was performed with T2 well-being as the dependent variable and T1 well-being and social capital as covariates, and 12 groups were compared with persistent image managers (g22) as the reference group.
The social grooming transition pattern was significantly associated with social connectedness: F(24, 645) = 6.45, p < .0001, R2 = .19. Both persistent relationship maintainers (g44), β = −.35, SE = .15, t = −2.38, p = .02, and persistent lurkers (g55), β = −.65, SE = .14, t = −4.58, p < .001, had significantly lower perceived social connectedness than persistent image managers. Three other groups also had significantly lower perceived social connectedness than persistent image managers, including g14 (from social butterflies to relationship maintainers, with no additional posts on Facebook), β = −.57, SE = .21, t = −2.75, p = .006; g21 (from image managers to social butterflies, more active); β = −.50, SE = .23, t = −2.16, p = .037; g35 (from trend followers to lurkers); β = −.47, SE = .19, t = −2.46, p = .01. Age is a positive covariate, β = .008, SE = .003, t = 2.56, p = .01.
Regarding T2 life satisfaction, the model is significant: F(24, 645) = 8.65, p < .001, R2 = .22. Persistent trend followers (g33) had significantly higher life satisfaction than persistent image managers (g22), β = .35, SE = .18, t = 1.99, p = .046. Age, β = .01, SE = .003, t = 3.73, p < .001, and education, β = .003, SE = .01, t = 2.73, p = .006, were both significant covariates. Regarding T2 social life satisfaction, the model was significant: F(24, 645) = 11.22, p < .001, R2 = .29. The transition group of g14 (T1 social butterfly to T2 relationship maintainer) reported significantly lower social life satisfaction than persistent image managers, β = −.32, SE = .16, t = −1.99, p = .047. Male participants reported significantly lower social life satisfaction than females, β = −.13, SE = .04, t = −2.73, p = .001. Age, β = .005, SE = .003, t = 2.06, p = .003, and education, β = .02, SE = .01, t = 2.02, p = .044, were positive covariates.
Regarding T2 happiness, the model was significant: F(24, 645) = 2.79, p < .0001, R2 = .25. However, none of the transition styles had significant differences in T2 happiness compared with the reference group (e.g., persistent image managers). Married participants reported greater happiness than single participants, β = .16, SE = .065, t = 2.43, p = .015.
Finally, the model of T2 loneliness was significant: F(24, 645) = 5.87, p < .001, R2 = .18. However, none of the transition pattern groups had significant differences in T2 loneliness compared with persistent image managers. Married participants reported less loneliness than single participants, β = −.22, SE = .07, t = −3.1, p = .002. Education was a negative covariate, β = −.03, SE = .01, t = −2.56, p = .01.
We also analyzed the demographic information from each transition group to facilitate our understanding of the demographic composition of each group (Table 8). For example, in g11 (N = 27), 19% were male, the mean age was 40.56, and 59% were married.
Means and Standard Deviations of Demographic Data for Each Transition Group
| Group 11 | Group 22 | Group 33 | Group 44 | Group 55 | |
|---|---|---|---|---|---|
| (N = 27) | (N = 34) | (N = 25) | (N = 145) | (N = 263) | |
| Sex (male = 1) | .19 (.40) | .35 (.49) | .56 (.51) | .24 (.50) | .49 (.50) |
| Age | 40.56 (8.59) | 43.29 (10.89) | 42.04 (10.49) | 43.68 (11.82) | 45.44 (12.67) |
| Education | 14.48 (2.14) | 13.47 (2.5) | 15.12 (2.32) | 14.36 (2.42) | 14.09 (2.55) |
| Married | .59 (.50) | .74 (.45) | .6 (.5) | .61 (.49) | .62 (.49) |
| Other | 0 | .03 (.17) | .04 (.2) | .05 (.22) | .07 (.25) |
| Group 12 (N = 11) | Group 14 (N = 24) | Group 21 (N = 16) | Group 24 (N = 10) | Group 23 (N = 16) | |
| Sex (male = 1) | .09 (.30) | .63 (.49) | .38 (.5) | .3 (.48) | .44 (.51) |
| Age | 39.73 (9.22) | 37.71 (6.64) | 41 (11.55) | 43.9 (13.78) | 45.69 (13.55) |
| Education | 13.82 (1.89) | 14.13 (2.21) | 15.25 (2.05) | 14.1 (2.23) | 13.5 (1.86) |
| Married | .82 (.40) | .67 (.48) | .56 (.51) | .6 (.52) | .69 (.48) |
| Other | 0 | .13 (.34) | .06 (.25) | .1 (.32) | .06 (.25) |
| Group 42 (N = 50) | Group 45 (N = 8) | Group 35 (N = 30) | Group 53 (N = 25) | Group 54 (N = 9) | |
| Sex (male = 1) | .34 (.48) | .75 (.46) | .6 (.50) | .48 (.51) | .22 (.44) |
| Age | 47.04 (11.48) | 42 (6.19) | 46.43 (14.49) | 41.4 (8.84) | 42 (15.29) |
| Education | 13.67 (2.27) | 14 (2.39) | 14.37 (2.85) | 14.8 (1.83) | 13.75 (1.98) |
| Married | .66 (.48) | .63 (.52) | .6 (.50) | .52 (.51). | 0.67 (.5) |
| Other | .04 (.20) | .13 (.35) | .03 (.18) | .04 (.02 | 0 |
Note. Group 11 indicates T1 social butterflies to T2 social butterflies. 1, social butterfly; 2, image manager; 3, trend follower; 4, relationship maintainer; 5, lurker. The reference group of marital status is single and others include divorced, separated, living together, and deceased. For G11, the proportion of single is 1−.59 − 0 = .41.
Exploration of T2 cross-sectional association
In addition to the longitudinal transition pattern approach, we also explored how the T2 social grooming style is associated with T2 social capital and well-being, providing concurrent results. A series of general linear models was employed to explore the mean difference between the effects of the T2 social grooming style on social capital and well-being with demographic variables as covariates. (Detailed outcomes are presented in the OSF link in the Appendix). Table 9 presents the adjusted means and adjusted standard deviations of different social outcomes with respect to social grooming style controlling for covariates. The model of the effect of T2 social grooming style on bonding social capital was significant: F(9, 692) = 4.06, p = .015. Lurkers reported significantly lower T2 bonding social capital than image managers, p < .05. The male participants reported lower bonding social capital than the female participants, B = −.22, SE = .05, p < .001. Regarding bridging social capital, social grooming style did not differ with respect to these social outcomes. Older participants indicated a lower bridging of social capital, B = −.01, SE= .002, p < .001.
Concurrent Analysis: T2 Adjusted Means and Adjusted Standard Deviations of Social Capital and Well-Being by T2 Social Grooming Styles controlling for effects of covariates
| Social butterfly | Image manager | Trend follower | Maintainer | Lurker | |
|---|---|---|---|---|---|
| N | 45 | 100 | 66 | 188 | 311 |
| Bonding capital | 3.99 (.67)ab | 4.09 (.60)ac | 4.01 (.68)ab | 4.00 (.59)ab | 3.85 (.74)bd |
| Bridging capital | 3.96 (.66) | 3.87 (.67) | 3.89 (.61) | 3.80 (.67) | 3.67 (.71) |
| Social connectedness | 3.71 (.76)ae | 3.76 (.73)be | 3.68 (.77)ae | 3.48 (.80)ac | 3.19 (.81)d |
| Life satisfaction | 3.71 (.82) | 3.72 (.67) | 3.71 (.80) | 3.69 (.75) | 3.63 (.74) |
| Social life satisfaction | 3.73 (.69)ab | 3.84 (.61)ab | 3.76 (.77)ab | 3.81 (.66)ac | 3.63 (.72)bd |
| Happiness | 3.80 (.79) | 3.81 (.68) | 3.74 (.69) | 3.79 (.73) | 3.70 (.71) |
| Loneliness | 2.38 (.81) | 2.24 (.68) | 2.24 (.68) | 2.18 (.76) | 2.29 (.75) |
Note. Means that have no superscript in common are significantly different from each other.
Regarding well-being, the results showed that the model of T2 social grooming style and social connectedness was significant: F(9, 692) = 8.79, p < .001. Image managers reported significantly greater social connectedness than trend followers, relationship maintainers, and lurkers, p < .05. Social butterflies and trend followers also reported greater social connectedness than lurkers, p < .05. Age had a positive association with social connectedness, indicating that older participants reported higher perceptions of social connectedness through SNSs, B = −.01, SE = .003, p < .001. Regarding T2 social life satisfaction, F(4, 705) = 2.75, p < .027, the results indicated that relationship maintainers reported significantly greater social life satisfaction than lurkers. Regarding T2 life satisfaction, happiness, and loneliness, the T2 social grooming style was not associated with any differences. However, the results of these analyses also indicate that the male participants reported significantly lower life satisfaction (B = −.13, SE = .06, p = .02), lower social life satisfaction (B = −.20, SE = .05, p < .001), and greater loneliness (B = .16, SE = .06, p < .001) than the female participants.
Discussion
The role of communication technology use in the formation of individuals’ social capital and their well-being has received ongoing scholarly attention. This study employed nationally representative, three-year panel data to provide both longitudinal and concurrent approaches to understand this phenomenon. In addition, following scholars’ suggestions to adopt the “user style” framework (Brandtzæg, 2012; Lin, 2019), this study employed the social grooming style framework (Lin, 2019) and was the first to employ latent transition pattern analysis (i.e., a longitudinal version of LCA) to understand how various latent user styles from two waves of data, forming a latent transition pattern, are associated with individuals’ social capital and well-being. While the existing longitudinal research has analyzed social media use (using time or general user style) based on wave 1 user type or lagged variables, we argue that individuals may change their user membership in terms of latent status over time. Therefore, using the latent transition pattern, that is, a parsimonious summary of the change in social grooming style over time is key to understanding how these various patterns are longitudinally associated with social capital and well-being.
This study sheds light on the importance of communication style (i.e., social grooming style) in forming social capital. Previous theoretical approaches consider structural positions in the social network (Freeman, 1978) or relational perspective (e.g., strong versus weak ties; Granovetter, 1973) as seminal factors of social capital. Specifically, the strength of ties, defined as a “combination of the amount of time, the emotional intensity, the intimacy, and the reciprocal services” (Granovetter, 1973, p. 1361), has become the decisive factor in accruing different types of social capital. In addition to tie strength, a social grooming style (i.e., communication style) should be considered in the social capital literature and theory. The present study suggests that social grooming style and longitudinal social grooming pattern are important frameworks to identify variances in how individuals interact with others on social media and in the formation of social capital. Social capital formation and exchange occur differently based on various social grooming patterns, and being strategically social delivers the best results. We offer theoretical insights into social capital formation from social grooming use via social media.
The longitudinal latent transition style identified from this study indicated that social media users adopt various communication styles over time. Researchers need to consider this transition style to reflect the more abundant variances among usage in social media research. The results indicated that most individuals maintained their social grooming style from 2017 to 2019, with almost half of social butterflies, image managers, and trend followers and almost 80% of relationship maintainers and lurkers in 2017 maintaining the same style. Among the individuals who changed their social grooming style, most became less active (becoming maintainers or lurkers), and few became more active (transitioning to image managers or social butterflies). These results indicated that most Facebook users in Taiwan became reluctant (to a certain degree) to publicly create content but preferred to merely comment on or passively view other people’s posts. It might be that users utilize various channels on Facebook to socially interact with others privately, such as via Facebook messenger (Burke & Kraut, 2016) or private groups, as opposed to creating posts on their Facebook walls. Privacy concerns may be another reason due to several instances of data leaks and scandals, and more research is needed to probe this issue.
Another trend is that users who became more active on Facebook adopted a strategic social grooming style (i.e., image managers) rather than a talk-about-everything style (i.e., social butterflies). Lin (2019) indicated that image managers engage in high self-disclosure (especially informational type) and relationship-maintaining behavior and avoid the discussion of public topics, including controversial and trending topics. The transition to becoming strategically more active may reflect how users address context collapse on Facebook (Vitak, 2012), where a user must carefully select topics to meet the lowest common denominator to self-present during social interactions with others (Hogan, 2010).
The third trend is that the more inactive the user style in 2017, the greater the proportion of users who maintained their user style from 2017 to 2019. The diagonal line becomes darker from the top left to the bottom right in Table 7, which indicates that the shifting of user styles is strongest among those who are more socially active, whereas passive and inactive users mostly maintain their styles. Indeed, it is not unusual for those who actively socially interact with others and create content on Facebook to become more inactive over time. By contrast, it is rare for less active users to suddenly start discussing controversial issues and disclosing emotional self-information. The rationale and underlying mechanisms are beyond the scope of this study; however, this indicates that active social media users have more shifting options, whereas inactive and passive users remain the same.
This study also sought to understand the association between these transition patterns and social benefits. Regarding social capital, we found that the transition pattern did not influence bonding social capital; however, variation was observed for bridging social capital. The results indicated that persistent image managers and social butterflies were more closely associated with greater bridging social capital than persistent lurkers. Our results were also consistent with the findings of Brandtzæg (2012), which showed that socializers reported greater social capital benefits. We further demonstrated that social capital changes occur when users adopt active social grooming styles and are most socially rewarded when communicating strategically. This result provides longitudinal evidence for the hypothesis in the prior literature that Facebook is particularly useful for accruing bridging social capital (Ellison et al., 2007) and transforming latent ties into weak ties (Haythornthwaite, 2002).
This study also suggested the potential boundary condition for a long-term strategic social grooming style on boding social capital. The difference in social outcomes for social butterflies and image managers from Lin’s (2019) cross-sectional data was related to the differences in bonding social capital, in which social butterflies reported significantly lower bonding social capital than image managers. However, in the longitudinal data, persistent social butterflies and persistent image managers did not differ regarding their bonding social capital in 2019. Two directions can be discussed. First, the longitudinal use pattern reflected that the accumulation of bonding social capital over time may be limited on Facebook, which can be supported by the lack of difference between these two active user patterns. Second, as suggested by multiplexity theory (Haythornthwaite, 2001), people with strong ties interact with each other using various channels to communicate. Therefore, for bonding social capital, Facebook is only one of the channels that complements other communication types, such as face-to-face, phone, and instant messenger communication. We showed that over time, the role of social grooming style on Facebook in terms of bonding social capital is limited.
Strategic social grooming benefits not only social capital formation but also well-being. Social connectedness showed greater variance among transition groups. Persistent maintainers and lurkers both reported lower social connectedness than image managers. Shifting from a more active to an inactive social grooming style over time is associated with lower social connectedness than that reported by image managers. The most interesting transition group was g21 (from T1 image managers to T2 social butterflies), as this group also reported lower social connectedness than persistent image managers. Transitioning to a user style that involves discussing everything did not make individuals “feel closer to their friends through interactions with friends on Facebook.” Although the concurrent results indicated no difference between these T2 groups, long-term strategic use (e.g., persistent image manager) was associated with the greatest social connectedness in the longitudinal approach. In addition, persistent image managers (g22) reported greater social life satisfaction than the transition group of T1 social butterflies to T2 relationship maintainers (g14). This finding supports the underlying assumption that the persistently strategic social use of Facebook is associated with greater well-being. More research is needed.
One highlight of this research is that transition patterns did not differ in terms of happiness and loneliness, which are two important indicators of well-being. Taking the five indicators of well-being together, the results from this study were very different from those of prior research. For example, whereas some researchers (Brandtzæg, 2012; Teppers et al., 2014; Shakya & Christakis, 2017) have reported that Facebook use and some user styles were associated with lower well-being and greater loneliness, this study showed that long-term transition patterns were not associated with loneliness. This study is more in line with Utz and Breuer (2017), who found that the degree of Facebook use was positively associated with social support but not life satisfaction and was the only social outcome. This study further showed that a more active social grooming style transition pattern was associated with a greater positive dimension of well-being, including social connectedness and life satisfaction.
We report both longitudinal data and cross-sectional results from 2019. The well-being results were mostly consistent over time and show that well-being is usually affected by other factors, and both approaches offer consistent results. However, the social capital results differed between the longitudinal transition pattern approach and the concurrent results. Bonding social capital differed between image managers and lurkers, whereas bridging social capital did not, for the 2019 data. In contrast, from the panel data, bonding social capital was not different; bridging social capital was different in terms of these transition patterns. While the two approaches offered different directions of social capital outcomes, we suggest that the cross-sectional data provide insight into immediate, one-time social benefits such as bonding social capital, whereas the longitudinal approach offers a lens through which to understand long-term social benefits such as bridging social capital. Both approaches allow us to understand the overall picture from different perspectives.
In Lin’s (2019) cross-sectional study, strategic social grooming is associated with the greatest social benefits. In the current longitudinal transition pattern approach, adopting a persistently strategic social grooming style over time is also associated with the greatest social benefit. Therefore, in the long term, the active social grooming groups do receive more social benefits; however, being strategically active (i.e., image managers) results in the greatest social benefit. Simply put, we are rewarded for carefully and consistently curating our social media personas over time.
There are some limitations to consider when interpreting the results. In these panel data, 710 of the original 1,350 respondents in 2017 served as the sample. Nevertheless, there is often a trade-off in longitudinal panel data. In addition, we did not include other communication types or offline interactions in this paper to focus on how long-term latent transition patterns are associated with user social outcomes. The complexity of the latent transition pattern offers considerable insight into Facebook use and social benefits. Furthermore, since this study employed national surveys, most of the concepts were measured in single-item questions. Future research should probe this issue using full scales for well-being and social capital to obtain more insights. This study also relied heavily on self-report data and future research could analyze profile content to complement the current measures for social grooming styles. Although there were variances in the social outcomes of the transition groups, the differences were limited. It may be that the variance in the long term is somewhat small compared with concurrent results. The interpretation requires caution.
This study contributes to the literature by offering the first longitudinal data analysis using LTA considering five social grooming styles in 2017 and 2019. This unique analysis offers rich insight in terms of individuals’ social capital and well-being and various transition patterns, complementing other longitudinal research on the more general categorization of Facebook use and its social implications. The transition patterns showed significant results and offered insights into long-term strategic social grooming styles and their social benefits. The study showed that, over time, the active remain active and have options to shift, whereas the inactive largely remain inactive with respect to Facebook social grooming styles. Although persistent social butterflies gained considerable positive social benefits, persistent image managers (i.e., being strategical) were rewarded with the most social benefits over time. These patterns provide important theoretical insights into the communication perspective on forming social capital and complement the existing structural and relational perspective of social capital. Additionally, LCA and LTA are promising approaches to studying complicated SNS user behavior and social implications.
In conclusion, audiences have integrated social media into their daily lives, and we are dependent on social media for social interactions and accruing bridging social capital. The longitudinal approach (i.e., LTA of five social grooming styles) supported the social grooming style framework (Lin, 2019). The framework is helpful in identifying variances of social interaction approaches, which also expands our understanding of different social styles. Social media use cannot be understood merely in terms of usage time, frequency, or general usage style; rather, it must be considered in terms of nuanced social grooming styles. Antecedents of these social grooming styles/patterns, perceived costs and social benefits, as well as privacy concerns should be further probed in future research
The authors thank the survey team and the primary investigators, Dr. ChingChing Chang and Dr. Chen-Chao Tao, of the TCS. They also thank the editor Dr. Rich Ling, the associate editor Dr. Nicole Ellison, and three anonymous reviewers for their excellent and thought-provoking suggestions and comments.
Funding
This study was supported by the Ministry of Science and Technology under grants MOST #105-2420-H-004-035-SS3 and # MOST 109-2423-H-004-004-SS4.
Conflict of interest: The authors declare that there is no conflict of interest.
Methodological Appendix
LTA is a longitudinal extension of LCA. LCA is an analog statistical method of factor analysis, which is utilized for variable reduction and to construct the latent abstract concept (Clogg, 1980, 1981; Clogg & Goodman, 1984, 1985; Goodman, 1974; Lazarsfeld & Henry, 1968). Whereas factor analysis is appropriate for observed continuous variables and assumed continuous latent factors, LCA is suited for observed discrete variables and assumed categorical latent factors (i.e., a latent class variable).
LCA has been intensively utilized to characterize the multiple dimensions of behavior or the multiple measurement items of an attitude or behavior such that individuals in each latent class share a common attitude or behavior such as sex-role attitude (Yamaguchi, 2000), substance use behavior (Lanza, Patrick, & Maggs, 2010), and adolescent delinquency or depression (Collins & Lanza, 2010). Importantly, LCA has also been extended to the analysis of panel data, whereas transitions over time in latent class membership are estimated and emphasized in a model and referred to as LTA (Daw et al., 2017; Hickendorff et al., 2018; Lanza, Flaherty, & Collins, 2003; Lanza & Collins, 2008; Li, Cohen, Bottge, & Templin, 2016).
In LCA, latent classes represent a stable set of characteristics or states of behavior or attitude with the proportions of latent classes and conditional probabilities that describe the relationship between observed items or indicators and latent factors. However, in LTA, individuals may change latent membership in latent classes over time. Therefore, researchers often use “latent statuses” to refer to latent subgroups instead of using “latent classes” to indicate the fact that the latent status of individual membership is not assumed to be stable over time.
In general, three sets of parameters are estimated in LTA. First, latent status membership probabilities are estimated at each time. For example, in modeling social grooming styles over time as a categorical latent factor, these probabilities represent the proportion of individuals expected to belong to each status of social grooming style at each time period. Second, transition probabilities in matrix form reflect the probability of transitioning from a particular latent status at time t to another latent status at time t + 1. Thus, these probabilities present the amount of change over time among latent statuses. Accordingly, a model of social grooming style over time should include a transition matrix representing the transition probabilities between any social grooming style at T1 and any style at T2. Thus, the probabilities in the diagonal elements of the transition matrix represent the probabilities that individuals will retain the same social grooming style over time, whereas the probabilities of all nondiagonal elements of the transition matrix show the transitional probabilities between one type of social grooming style at T1 and the other type at T2. Third, estimating a set of item-response probabilities corresponding to the observed variables of the latent factor (such as social grooming style) at each time period and latent status membership is similar to the interpretation of factor loadings linking observed indicators to a latent factor in factor analysis.
A more comprehensive discussion of LCA and LTA, including empirical demonstrations, can be found in Collins and Lanza (2010); Lanza and Collins (2008); Lanza et al. (2003); Lanza, Collins, Lemmon, and Schafer (2007); Lanza, Dziak, Huang, Wagner, and Collins (2015); Lanza et al. (2003, 2007, 2010, 2015).
In Table B1, we tested whether the social grooming styles in T1 and T2 were independent from each other and the results showed that the styles in T1 and T2 were significantly related. We found a large proportion of immobility in each latent status from T1 to T2, particularly for relationship maintainer and lurker statuses. However, social butterflies, image management, and relationship maintainers have a greater likelihood of changing their social grooming styles over time.
The analysis output has been uploaded to OSF via https://reurl.cc/ogEm7q
Transition Frequencies between Latent Status at T1 and Latent Status at T2
| status_t2 | |||||||
|---|---|---|---|---|---|---|---|
| 1 | 2 | 3 | 4 | 5 | Total | ||
| status_t1 | 1 | 27 | 11 | 0 | 24 | 7 | 69 |
| 4.37 | 9.72 | 6.41 | 18.27 | 30.22 | |||
| 2 | 16 | 34 | 16 | 10 | 3 | 79 | |
| 5.01 | 11.13 | 7.34 | 20.92 | 34.60 | |||
| 3 | 0 | 0 | 25 | 0 | 30 | 55 | |
| 3.49 | 7.75 | 5.11 | 14.56 | 24.09 | |||
| 4 | 2 | 50 | 0 | 145 | 8 | 205 | |
| 12.99 | 28.87 | 19.06 | 54.28 | 89.80 | |||
| 5 | 0 | 5 | 25 | 9 | 263 | 302 | |
| 19.14 | 42.54 | 28.07 | 79.97 | 132.28 | |||
| Total | 45 | 100 | 66 | 188 | 311 | 710 | |
Note: 1 represents social butterfly, 2 represents image manager, 3 represents trend follower, 4 represents relationship maintainer, and 5 represents lurker. The italicized number is the expected frequency of each cell under the independence model.
Chi-square test: χ2 = 878.5006, df = 16, p-value <.0001.
Fisher exact test: p-value = <.0001.
References
Diener, E. D., Emmons, R. A., Larsen, R. J., & Griffin, S. (1985). The satisfaction with life scale. Journal of Personality Assessment, 49(1), 71–75.
Köbler, F., Riedl, C., Vetter, C., Leimeister, J. M., & Krcmar, H. (2010, July). Social connectedness on Facebook: An explorative study on status message usage. In Proceedings of 16th Americas conference on information systems.
Lin, J. H., Peng, W., Kim, M., Kim, S. Y., & LaRose, R. (2012). Social networking and adjustments among international students. New Media & Society, 14(3), 421–440.
