


Abstract
Mobile access to the Internet is changing the way people consume information, yet we know little about the effects of this shift on news consumption. Consuming news is key to democratic citizenship, but is attention to news the same in a mobile environment? We argue that attention to news on mobile devices such as tablets and smartphones is not the same as attention to news for those on computers. Our research uses eye tracking in two lab experiments to capture the effects of mobile device use on news attention. We also conduct a large-scale study of web traffic data to provide further evidence that news attention is significantly different across computers and mobile devices.
Digital news consumption continues to dramatically shift to tablets and smartphones. In 2015, 99 of 110 major news websites had more tablet and smartphone visitors than desktop visitors (Lu & Holcomb, 2016). This pattern is not surprising given precipitous increases in mobile device ownership in the United States. A majority (77%) of Americans report owning a smartphone (Horrigan & Duggan, 2015). Among smartphone owners, 94% report carrying them frequently, rarely turning them off (82%), and using them several times a day (59%) or constantly (27%) (Rainie & Zickhur, 2016). Tablet ownership has increased from just 3% in 2010 to 51% in 2016 (Horrigan & Duggan, 2015).
We are interested in how the use of mobile devices for news consumption shapes attention to content. Our study is motivated by the aforementioned trends, which suggest that mobile devices are overtaking desktop computers as the primary means by which digital news is consumed (Mitchell, Gottfried, Barthel, & Shearer, 2016; Newman, Fletcher, Kalogeropoulos, Levy, & Nielsen, 2017), as well as the mounting evidence suggesting the limitations of mobile platforms for news consumption (Kim & Sundar, 2014, 2015; Molyneux, 2017; Napoli & Obar, 2014).
Drawing on this scholarship (e.g., Molyneux, 2017) and industry reports (e.g., Horrigan & Duggan, 2015; Nielsen, 2015), we define “mobile devices” as wireless, handheld tablets and smartphones such as iPads and iPhones.1 Reflecting our primary interest in the critical comparison between these two types of mobile devices and their desktop counterparts, we present three studies (two lab-based and one tracking digital news audience behavior) in which we test the hypothesis that tablets and smartphones attenuate attention to news by directly comparing attention to news content on computers, tablets, and smartphones.2
We advance theory by blending insights from research on human–computer interaction and news consumption, and situating our arguments and evidence within one of the oldest traditions in social science: rational calculations about costs and benefits. In so doing, we offer a more complete and theoretically informed explanation for informational challenges on mobile devices. We advance methodology in this area of study by employing two novel lab experiments (Study 1 and Study 2) using an industry-quality eye tracking suite for robust operational measures of attention and cognitive effort. We find that on average, people spend less time consuming news on mobile devices relative to computers. We replicate our lab findings using a large scale proprietary data set on desktop, tablet, and smartphone web traffic.
Our approach to measuring attention in the lab is an important step in the study of news consumption across devices. Overcoming widely-known limitations of self-report media use (Vraga, Bode, & Troller-Renfree, 2016), we utilize eye tracking measures to capture the visual attention stream, separating top-down, effortful visual processing from non-focussed attention. Eye tracking is widely used in psychology and the media industry as the gold standard in measuring attention (Bode, Vraga, & Troller-Renfree, 2017). Specifically, we operationalize attention to news stories by measuring the time participants spend with their eyes fixated, or engaged in focussed visual attention, on the body of the news story. We also measure visual attention to linked content because it is a precursor to clicking behavior, and click-through rates are a widely-used metric for audience engagement with digital media. We operationalize attention to news links in three ways: (a) duration of fixation on links embedded in news story, (b) number of fixations on embedded news links, and (c) a dichotomous measure of whether participants fixate on links at all. Our lab studies reveal that, on average, people spend less time on news story content, and are less likely to notice links when they are on tablets and smartphones relative to computers.
The final prong of our methodological approach (Study 3) lends confidence to the external validity of this work by replicating our findings with web traffic data from comScore. These analyses support what we demonstrate in the lab: people spend much more time on news sites when they are on computers than when they are on tablets and smartphones. Important nuances among different types of mobile news consumers are also revealed. News app users—ostensibly more interested in news—spend more time on news than those who arrive to news sites through mobile browsers, yet they still spend significantly less time than computer users.
News and mobile technology
News and political information-seeking are important for civic life (Campbell & Kwak, 2010; Shah, Cho, Eveland, & Kwak, 2005). For generations, traditional news media have informed the public, and enriched democratic citizenship (Graber & Dunaway, 2017). Recent advances in communication technology have opened additional avenues through which those interested in news and information can be more engaged in civic life (Shah et al., 2005). Naturally, scholars and practitioners are interested in the democratic and economic consequences of changes in the information technology landscape. A robust developing literature on the political and civic implications of Internet proliferation, for example, suggests higher levels of political engagement among those using the Internet for news, exchanging information, and exploring interests (Kwak, Skoric, Williams, & Poor, 2004; Shah et al., 2005). The next important frontier of technological change with democratic consequences is mobile; researchers are speculating about the effects of mobile device use on a host of political and social outcomes, both positive and negative.
Information constraints on mobile devices
The emerging literature on Internet Communication Technologies (ICT) and mobile technology in developing settings (Brown, Campbell, & Ling, 2011; Donner & Walton, 2013; Gitau, Marsden, & Donner, 2010) finds several avenues through which mobile devices can improve digital inclusion and learning, economic development, and quality of life. However, this and other work (Donner & Walton, 2013) also tells a cautionary tale, highlighting information-seeking obstacles on mobile devices.
Functionality and corresponding costs shape the frequency and types of information-seeking people engage in on a mobile device (Donner & Walton, 2013). Tasks requiring “resource-intensive goals,” (Donner & Walton, 2013, p. 5) are more difficult and thus, costlier in a mobile environment. These include research for school or work; seeking health information; job searches; information about finances; learning new things; discussing and participating in politics, all of which are more likely to be conducted on a computer instead of a mobile device (Donner & Walton, 2013). User-experience studies also document low functionality of searching on mobile devices; queries take longer to enter and produce fewer results (Kamvar & Baluja, 2006). As these costs become more familiar through user experiences, they shape user habits and impressions of device efficiency for complex tasks.
Despite a growing body of research on mobile user experiences (Chae & Kim, 2004; Detenber & Reeves, 1996; Kamvar & Baluja, 2006; Kim & Sundar, 2014, 2015; Kim, Sundar, & Park, 2011; Lombard, 1995), we do not yet have a full understanding of how mobile devices affect attention to news specifically.
Information-seeking costs by mode and access
A rich literature on civic and political participation understands the likelihood of engaging in participatory behaviors to be constrained by costs and benefits (Downs, 1957; Riker & Ordeshook, 1968; Zaller, 1992). Information-seeking by any means is defined by this work as a costly endeavor. Research on user experiences suggests we can think about the effects of mobile device use in terms of how it affects information-seeking costs and benefits for user audiences.
Users of computers and mobile devices make decisions about what platform to use with their uses and aims in mind. Connection type and quality, network congestion, costs incurred with data usage, the ability to save, store, and share documents all influence the use of mobile or traditional computing platforms (Brown et al., 2011; Donner & Walton, 2013). Such differences make certain tasks and activities costlier on mobile devices relative to computers (Ghose, Goldfarb, & Han, 2012). Studies comparing the functionality of personal computers (PC) versus tablets and smartphones show that mobile devices are limited in ways that have implications for news attention. PC access to the Internet is often described as deeper and more complex than mobile use, which is extractive, skimming, or superficial (Humphreys, Von Pape, & Karnowski, 2013; Napoli & Obar, 2014). For example, PC users exhibit more habitual searching across more categories relative to mobile users (Cui & Roto, 2008), use fewer and less complex search terms (Napoli & Obar, 2014), and rely more on the first few returned search results (Ghose et al., 2012). These behaviors demonstrate limits to information-seeking on mobile devices. Rather than requiring an explicit calculation each time the device is used, perceptions of costs and benefits shape use and attitudes towards the optimal use of mobile devices.
Perhaps most telling is the growing body of work investigating screen size (Kim & Sundar, 2014, 2015). Screen size structures the utility and functionality of mobile devices. Larger screens enable additional presentation modes for media content, while smaller screens require different content configurations (Kim et al., 2011). Different screen sizes also produce variable psychological effects on user perceptions, across both cognitive and affective domains (Detenber & Reeves, 1996; Lombard, 1995). Larger screens are generally associated with positive user experiences measured by rates of “enjoyment, arousal, presence, immersion, and realism” (Kim & Sundar, 2015, p. 45; also see Detenber & Reeves, 1996; Kim & Sundar, 2013; Lombard, 1995). Sundar (2008) argues the differences are attributable to a “being-there” heuristic enhanced by larger screens, and a more realistic experience. Larger screens have more capacity to transport to a virtual reality. These conditions also mean that information is easier to process on larger screens, which encourage heuristic processing. Smaller screens encourage systematic processing, requiring more cognitive effort (Kim & Sundar, 2015).
If larger screens facilitate information processing, it should be no surprise that screen size influences media attention and consumption. Screen size is positively correlated with ease of reading, clarity and organization of information, and negatively correlated with reading time (Molyneux, 2015). Users tend to learn less information from video content on a small screen (Maniar, Bennett, Hand, & Allan, 2008), and report that it is more difficult to access higher volumes of information when using mobile screens (Chae & Kim, 2004; Napoli & Obar, 2014). The costs imposed by smaller screens are particularly relevant because size differences will persist regardless of improvements in wireless connection speeds and computing power for mobile devices. Differences in screen size will always shape information-seeking in consequential ways, though those effects may become marginal as phones and tablets continue to proliferate in an array of sizes. Nevertheless, we can expect many smartphones models to remain small enough to carry in pockets, suggesting size-related constraints will continue to be relevant.
The cost of information-seeking is often viewed as a deterrent to civic engagement. The time and attention required by political participation exerts a cognitive tax and incentivizes “rational ignorance.” In this calculus, information costs are considered against the benefits of becoming informed. Ostensibly, the same calculations apply in the digital information environment. As the perceived costs of information-seeking on mobile devices increase, the likelihood that users are willing to expend precious attention on news decreases. When modes of content delivery make information-seeking and attention more effortful,such as the need to scroll or find specific information, the costs may outweigh the benefits for all but the most dedicated democratic citizens (Zaller, 1992). The implications should be reflected in the way people consume news on mobile devices. We offer the following:
Hypothesis 1, News Attention Duration: Time reading news is shorter on mobile than computers.
Hypothesis 2, Attention to Links: Attention to links is shorter on mobile devices than computers.
Hypothesis 2a: Duration of fixations on links is shorter on mobile devices than computers.
Hypothesis 2b: Number of fixations on links is fewer on mobile devices than computers.
Hypothesis 2c: Probability of noticing links is lower on mobile devices relative to computers.
Methods and data
In Studies 1 and 2 we report findings from two lab experiments using student samples, which we validate with a non-student sample in Study 3, using comScore data tracking Internet behaviors on computers, tablets, and smartphones. Study 1, fielded from mid-March to mid-April, 2015, provides the initial test of the News Attention Duration Hypothesis and the Attention to Links Hypotheses. Study 2, fielded during the last two weeks of February 2016, replicates these tests. Additional details on experimental procedures can be found in the Appendix. Our use of student samples provides a conservative test of our hypotheses: college students are more likely to have familiarity with mobile devices, so we can expect that any differences that result will be more pronounced among non-college participants. Still, to offset limitations in external validity and student samples, in Study 3 we report findings from passively-tracked web traffic data on more than 100,000 Internet users. These data are notable for both their breadth and depth, and allow for a useful check against low external validity typical of lab studies and offer an alternative to less reliable self-reports (Boase, 2016).
In Study 1 we use as-if random assignment to sort participants into one of three conditions: desktop, tablet, or smartphone. In Study 2 we randomly assign device by participant, and randomly assign participants to treatment by date and hour to one of two conditions: desktop or tablet. In Study 2 we drop the smartphone condition to maximize the number of observations in each treatment and because we find no significant difference between smartphone and tablet (see Table A3). To maximize treatment equivalency in both studies, the appearance and format of content on all devices is the same.3 Participants complete a pretest measuring demographics and political interest, and are then asked to read a news story on their assigned device.4
Eye tracking procedures
Eye tracking is the basis of our outcome measures. Eye tracking captures what content participants are attending to and for how long. It is a well-tested measure of visual attention and cognitive processing (Duchowski, 2007; Vraga et al., 2016). In the computer condition, eye movement is recorded at 120 Hz using a Tobii T120 built-in eye tracker on a 17” monitor with a screen resolution of 1,280 × 1,024. For the mobile device conditions, eye movement is recorded at 60 Hz using a Tobii X260 external eye tracker attached to a mobile device. The T120 relies on a binocular, automatic tracking optimization technique to ensure accuracy and precision of measurement. A combination of projectors and sensors capture the position and gaze direction of a user’s eyes using near-infrared light, unaffected by ambient light conditions. This setup allows for freedom of head movement for the comfort of participants while the large display monitor, covertly integrated into an otherwise normal looking desktop, allowing for detailed stimuli. We rely primarily on fixation measures, which filter out blinks and pass-through eye movements to indicate thoughtful, focussed visual attention. These measures are recorded for pre-defined portions of the stimulus as areas of interest (AOI).5 Eye tracking offers several benefits over self-report measures of attention (Vraga et al., 2016).6
Before each trial, participants are informed the researchers are interested in news consumption, and then take a short pretest on a separate desktop computer using Qualtrics. Participants are then moved to either the eye tracking desktop or the mobile device docking station and instructed in a 9-point calibration procedure to ensure their eye movements are measured precisely. Participants are informed that next they will see a news article that they should read at their leisure, at which point the stimulus appears within the browser and their eye movements are recorded. There is no time limit on the eye tracking procedure; when finished, participants moved back to the original desktop computer to finish the posttest. See Appendix for variables, measures, descriptive statistics, and stimulus details.
Study 1
Participants for Study 1 (N = 115) are students recruited from a large southern university’s Media Lab during March and April 2015. All participants are over 18 years of age, and they earn course credit as compensation for their time. The average age of the participants is 20.2 years. Of the 115 participants, 87 are women and 28 are men, 88 are white; 34 are freshmen, 28 are sophomores, 26 are juniors, 25 are seniors and 2 are othe; 33 are Democrats, 62 are Republicans and 20 identify as Independents. We use data from all respondents.
Measures
To test our first hypothesis (H1), we use “Time Fixated on News Content,” which indicates the total amount of time participants spent fixating on the body of the news story (six paragraphs). Time spent on each paragraph is highly correlated, allowing us to create a dependent variable ranging from 0 to 85.72 seconds (Cronbach’s α = .89, M = 28.44, SD = 23.54). To test our second set of hypotheses (H2a–c), we use three outcome variables which capture attention to linked content, a standard measure of engagement in the industry (Nielsen, 2015). For H2a we use “Duration of Fixations on News Link,” which measures the summed duration of all fixations on the “Related Story” link, ranging from 0 to 4.65 seconds (M = .56, SD = .83). For H2b we use “Counts of Looks at Link,” a sum of the number of times the participant fixated on the link (Range: 0–17, M = 2.37, SD = 3.36). For H2c we use “Noticed Link,” an indicator for whether participants looked at the link at all,7 where 1 represents “noticed” (61%) and 0 represents “did not notice” (39%). We model these outcomes as a function of two dichotomous indicators for “Tablet” and “Smartphone.” Computer is the baseline.
Results
We estimate the effects of mobile devices on user attention to news and linked content by regressing treatment indicators on four outcome variables. The results presented in Table 1, visualized in Figure 1, reveal significant and negative coefficients for “Tablet” and “Smartphone”, supporting H1. Tablet and smartphone users spend significantly less time reading news content relative to computer users.8
Models Predicting Attention to News and Links (Study 1)
| Time Reading News Content (logged) | Number of Fixations on Link (logged) | Time Fixated on Link (logged) | Noticed Link (0/1) | |
|---|---|---|---|---|
| (Model 1) | (Model 2) | (Model 3) | (Model 4) | |
| Tablet | −1.55 (0.23)*** | −.71 (.19)*** | −.33 (.09)** | −1.89 (.57)** |
| Smartphone | −1.14 (.21)*** | −.53 (.18)** | −.20 (.09)* | −1.49 (.55)** |
| Constant | 3.79 (.15)*** | 1.23 (.13)*** | .51 (.06)*** | 1.64 (.45)*** |
| N | 109 | 109 | 109 | 108 |
| F | 26.26*** | 7.84*** | 6.13** | – |
| R2 | .33 | .13 | .10 | – |
| Wald χ2 | – | – | – | 13.85** |
| Pseudo R2 | – | – | – | .10 |
Note: Entries are OLS or Logit coefficients with standard errors in parentheses. The comparison group for device use is computer. *p < .05, **p < .01, ***p < .001, two-tailed tests.
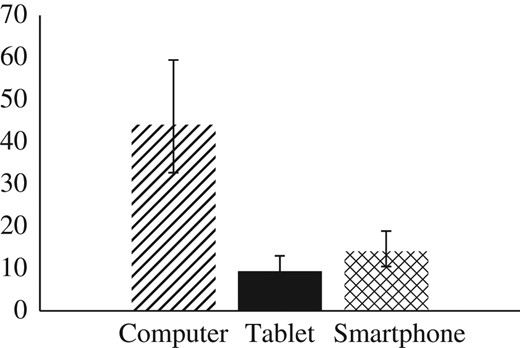
Predicted time spent reading news content (in seconds) with 95% confidence interval, by device (Study 1).
The Attention to Links results, presented in the remaining columns of Table 1 and visualized in Figure 2, also reveal significant and negative coefficients for “Tablet” and “Smartphone” across outcomes. Tablet and smartphone users spend significantly less time fixating on news links and are less likely to notice links relative to computer users, supporting (H2a–c). The results support the Attention Duration hypothesis (H1) and Attention to Links hypotheses (H2a–c).
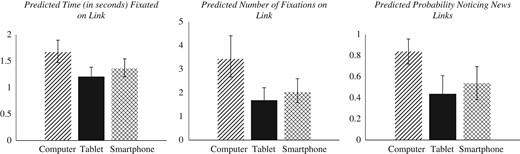
Predicted attention to news links with 95% confidence interval, by device (Study 1).
Study 2
For brevity, we note only where Study 2 differs from Study 1 and relegate measurement details to the Appendix. Participants for Study 2 (N = 56) are students recruited from a large southern university’s Media Effects Lab during February 2016. The average participant age is 20.4 years, 50 are women, and 38 are white; 17 are Democrats, 23 are Republicans, 15 are Independents, and one participant did not respond. The experiment is set up like Study 1.9 We use the same four outcomes to capture participants’ attention to news and links.
Results
There is one critical difference between Study 1 and Study 2: in Study 2 we drop the smartphone condition. First, given time and lab constraints, dropping a condition allows us to maximize the number of observations in each condition. Second, concerns about treatment equivalency between smartphone and computer displays of textual data mandate a preference for retaining the Tablet condition. The larger tablet screen is more equivalent in terms of material on a desktop. For this reason, tablets provide the more conservative comparison. Third, Study 1 demonstrated no significant difference between tablets and smartphones (see Table A3). Otherwise, the measures and models presented below are the same as in Study 1. The results for Study 2 are displayed in Table 2, and yield additional support for the Links hypotheses (H2a–c), but not for the Duration hypothesis (H1). Specifically, “Tablet” is not a significant predictor for fixation duration (see column 1), while the significant and negative coefficient for “Tablet” in columns 2 and 3 of Table 2 indicate tablet users are less likely to look at news links. When they do, they spend less time looking at news links relative to computer users. Tablet users are significantly (43%) less likely to notice the links in the news stimulus relative to computer users (Figure 3).
Models Predicting Attention to News and Links (Study 2)
| Time Reading News Content | Number of Fixations on Link (logged) | Time Fixated on Link (logged) | Noticed Link (0/1) | |
|---|---|---|---|---|
| (Model 1) | (Model 2) | (Model 3) | (Model 4) | |
| Tablet | −.49 (9.14) | −1.20 (.27)*** | −.66 (.16)*** | −3.15 (1.09)** |
| Constant | 66.59 (6.46) *** | 2.25 (.19)*** | 1.16 (.12)*** | 3.30 (1.02)** |
| N | 56 | 56 | 56 | 56 |
| F | .00 | 20.24*** | 16.54*** | – |
| R2 | .0001 | .27 | .23 | – |
| Wald χ2 | – | – | – | 15.68*** |
| Pseudo R2 | – | – | – | .25 |
Note: Entries are OLS or Logit coefficients with standard errors in parentheses. The comparison group for device use is computer. *p < .05, **p < .01, ***p < .001, two-tailed tests.
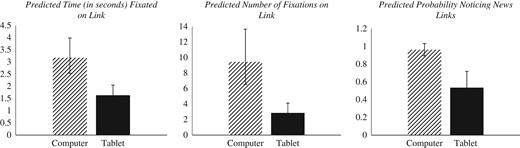
Predicted attention to news links with 95% confidence interval, by device (Study 2).
Study 3
In Study 3 we rely on data provided by comScore, a U.S. firm that passively tracks website traffic. The firm reports tracking more than a million domains and has more than a quarter of a million users. These data provide per visitor and per visit data on audience traffic to news and entertainment websites, broken down by smartphones, tablets, and computers, as well as by browser and app based access. These data allow for a validity check on Studies 1 and 2.
Digital news outlets comprise the unit of analysis,10 while the units of observation are points of access to the outlets’ content (N = 1,052), which is based on measures of outlets’ site traffic from visitors using computers, tablets, and smartphones. Each outlet can have traffic from three to five different possible points of access. For example, there are five observations, or points of access associated with cnn.com: cnn.com-computer-browser, cnn.com-tablet-browser, cnn.com-tablet-app, and cnn.com-smartphone-browser, and cnn.com smartphone-app. The points of access are nested within outlets, mandating that we cluster our standard errors at the news outlet level.11
Measures
We use two outcome variables to capture attention duration with the comScore data. First, “Average Minutes Per Visitor” measures the average number of minutes spent on the news site during the month of March 2016, per individual visitor (comScore, 2013; 2016). Second, “Average Minutes Per Visit,” indicates the average number of minutes spent on the news site per visit for the same time period. Due to the skewness of each, we use logged values. We model these outcomes as a function of two main predictors, dichotomous indicators for “Tablet” or “Smartphone,” with “Computer” serving as the baseline. In the models predicting “Average Minutes Per Visitor,” we also include a variable for “App,” which captures site access sites via news app (coded as 1) or web browser (coded as 0). See Appendix for summary information.12
Results
Table 3 presents three regression models. Two predict average minutes per visitor spent on sites, one predicts average minutes spent on sites per visit. The first column presents the full model on minutes per visitor controlling for app versus browser access; the second model is for browser users only.13 Again, we see a significant and negative coefficient for “Tablet” and “Smartphone,” supporting our Attention Duration hypothesis (H1): relative to computer users, tablet and smartphone users spend significantly less time on news sites on a per visitor basis, which is consistent across specifications. Interestingly, the results from the full model suggest that, even when controlling for app access, users spend less time attending to news on tablets or smartphones. While the number of app users is too small to estimate a full model, the descriptive data reveal that smartphone app users spend an average of 7.56 minutes on news sites compared to 2.15 minutes via browser. The effect size for “App” was moderate (η2 = .52).
Average Minutes per Visitor and Visit Spent on News Sites/Apps (Study 3)
| Minutes Per Visitor Browser and App Users | Minutes Per Visitor Browser Users Only | Minutes Per Visit Browser Users Only | |
|---|---|---|---|
| Tablet | −.183 (.03)*** | −.178 (.03)*** | .02 (.02) |
| Smartphone | −.618 (.03)*** | −.623 (.03)*** | −.17 (.02)*** |
| App | 2.62 (.11)*** | – | – |
| Constant | 2.11 (.04)*** | 2.11(.04)*** | 1.15 (.02)*** |
| N | 986 | 915 | 915 |
| F | 336.12*** | 237.55*** | 151.97*** |
| R2 | .5328 | .1551 | .0906 |
Note: OLS coefficients with standard errors (clustered on news outlets) in parentheses. The comparison group for tablets and smartphones is computers. Dependent variable is logged. Missing values reflect points of access that did not meet comScore’s minimum reporting standards for March 2016. *p < .05, **p < .01, ***p < .001, two-tailed.
The third model in Table 3 displays the results from a regression model predicting average minutes per site visit, which provide partial support for H1 (also see Figure 4). A significant and negative coefficient for “Smartphone” indicates users spend significantly less time on news sites, relative to computer users. The indicator for “Tablet” is not statistically significant. These analyses mostly support the Attention Duration hypothesis results from Study 1: device matters for individuals’ attention to news, and this relationship is consistent by manner of access. The comScore data enable a real-world manipulation check, illustrating web use patterns by device. Mobile devices constrain time spent on news sites on a per visit and per visitor basis.
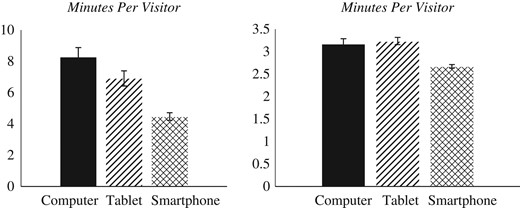
Predicted average minutes per visitor and visit, by device (Study 3).
Note: Predicted values are generated for users accessing news sites via browsers, see Table 3.
Discussion and conclusions
Our findings have important implications for democracy and the news industry. If quality information ensures a robust citizenry, the proliferation of mobile devices may do more than bridge lingering digital divides based on binary conceptions of access (Boyera, 2007; Napoli & Obar, 2014). Our study suggest that the story of mobile access is nuanced. For some, mobile access provides the only opportunity for exposure to digital news, for others, expanded opportunities (Napoli & Obar, 2014). But exposure does not equate with attention (Chaffee & Schleuder, 1986; Lang, 2000). Attention—an important precursor for recall, learning, and the ability to discern fact from fiction—is curbed on mobile devices. Even as mobile access proliferates, for the mobile dependent, the depth of attention to news is shrinking.
We conduct two lab experiments and one observational study. Our theoretical contribution is to situate the shift to mobile in the broader theoretical framework of information-seeking costs. We develop and test hypotheses about whether the mobile setting curbs attention to news, and argue it does this by making information-seeking costly on these devices. We find that attention is attenuated on mobile devices, and this pattern is replicated in the real world. Our findings provide a necessary addendum to the statement that having mobile access to the Internet is better than not having access at all—there are important differences in the affordances of high speed Internet on a traditional computer and access on a mobile device (Mossberger, Tolbert, & Franko, 2013; Napoli & Obar, 2014). Of course, the kinds of audiences left without optimal access for digital citizenship will vary over time as connections and data capabilities on mobile devices continue to improve. But, in the U.S. case, the policy debate over tiers of access and speed is not over—nor is the question of affordability. Indeed, the Federal Communications Commission (FCC) recently released a study in which it suggests mobile access is a suitable replacement for high speed Internet access (Brodkin, 2017). Access to broadband services is variable and cost sensitive, and our work suggests that attention to news may be a casualty of mobile reliance. Even as laptops shrink and smartphone screens grow, mobility will always necessitate smaller screens and—without a change in FCC position—connectivity speed differences may also continue.
Interesting patterns of news attention among app users warrant discussion. While smartphone and tablet users spent significantly less time on news regardless of whether in app or browser, when we dig into the data we find that attention to news is high in apps relative to mobile browsers. However, the data show a breadth vs. depth tradeoff. Although news app users spend more time attending to content, the proportion of app users is only a fraction of the audience reached by web browsers. Mobile browser users’ presence on news sites is fleeting, but audience reach is greatest through this mode of access. The manner of access associated with more attention has the lowest reach, and that of broadest reach seems to discourage attention.
We also find differences across studies that point to the need for further research. First, although we find consistent attentional difference between smartphones and computers, our findings for tablet consumption are less straightforward. In Study 2 we find no significant differences in time spent fixated on the news story on tablets vs. computers. In Study 3 we find that tablet users spend less time on news sites when measured on a per visitor basis, but not when measured on a per visit basis. What explains these differences? Presently, we can only speculate but given the literature on screens size it seems likely that in Study 2 the image was enough to reduce some attentional differences identified using our text-only stimulus in Study 1. Although this requires testing, it suggests a welcome possibility for journalists, who may be able to design their content in ways to minimize attention differences to news stories delivered on tablets. On the other hand, screen size effects suggest that regardless of technological change, some differences between mobile and computers will persist.
In Study 3, the differences we observe are likely a result of how the average person uses these devices. Smartphones are more likely to be used day-to-day, compared to tablets (Rainie & Zickhur, 2016), resulting in differing patterns of news behavior (Horrigan & Duggan, 2015). Tablets are also much more likely to be used at home than on mobile networks, making “the dynamics of tablet use more in line with traditional PC-based access than handheld device-based access” (Napoli & Obar, 2014: 324). Thus, we might expect fewer distinctions between tablet and computer users than between smartphone and computer users. It is also important to note: (a) the number of tablet users is fewer than smartphone users, and (b) smartphones are much more likely to be the devices on which people with mobile-only Internet access rely (Horrigan & Duggan, 2015). The attentional deficits we identify for smartphones may be most critical because they apply to more people and to groups most likely to be mobile dependent.
People believe their mobile devices make life easier, going so far as to say they couldn’t live without their smartphones (Rainie & Perrin, 2017). However, as others have argued and as our results highlight, access and exposure are distinct from attention (Chaffee & Schleuder, 1986). These differences between perceptions of attention and actual attention to information are why it is so important that we unpack the complicated relationship between user, device, and information characteristics. The results we present here should give the news industry pause: readers on mobile devices may spend less time on their sites and be less focussed on their content (Molyneux, 2017). Our results also point to the need to go beyond user-experience testing to include social scientific outcomes. The rush to monetize mobile news delivery may exacerbate the costs of information processing on mobile devices. Building economic value into mobile news may inadvertently decrease its democratic value.
Acknowledgments
This project was funded in part by the Texas A&M University Department of Communication and College of Liberal Arts and the Manship School of Mass Communication at Louisiana State University. We would like to thank the following individuals for helpful conversations and feedback at various stages of this project: Vin Arceneaux, Leticia Bode, Amber Boydstun, Scott Campbell, Kirby Goidel, Jennifer Jerit, Martin Johnson, Mark Peffley, David Peterson, Stuart Soroka, Jamie Settle, Talia Stroud, Emily Sydnor, Chris Weber, and Chris Wlezien. We are also grateful to participants in the Political Communication Lecture Series, Department of Communication Studies, University of Texas at Austin, November 7, 2016, participants at the Experimental Approaches to Studying Democratic Politics Conference, Princeton University, Princeton, New Jersey May 5–6, 2016, the Social Psychology Colloquia, Department of Psychology, Texas A&M University, March 25, 2017, participants at the St. Louis Area Methods Meeting, University of Missouri, April 22, 2017, and the Political Behavior and Political Institutions Research Group, Political Science, Texas A&M University, May 9, 2017.
Notes
We alternate between “tablets” and “smartphones,” and the umbrella term “mobile devices.”
Testing differences between tablets and smartphones allows us to model variation across mobile devices.
Weighing perfect treatment equivalency against realistic content display, we erred on the side of treatment equivalency with a text-based story, with font that looked mobile optimized.
We use internal and external eye tracking units. The only alternative is to have participants wear headgear, more obtrusive and less generalizable. To ensure the accuracy of the external eye tracker we employ a perspective calibration tool which takes into account the position of the stimulus relative to the user. The active display area is configured to ensure reliability.
AOIs ensure focus on meaningful visual attention indicated by fixations. Recording all eye movements every few milliseconds yields volumes of data. Tobii uses a mathematical filtering process to ensure fixations are identified consistently, indicating visual processing.
But see Molyneux (2017) who finds attention deficits on mobile with self-report measures.
Note that this news link is not live to ensure no interference.
Randomization ensures these effects are due to individual-level factors. As a check, we estimate the same models in Studies 1 and 2, controlling for speed; the results hold.
Study 2 incorporated a “News, Entertainment” manipulation, which failed. Results with “News/Entertainment” manipulation are available on request; the substantive findings hold.
ComScore collects web traffic data used in numerous studies (Nelson & Webster, 2016). We use two panels: Media Metrix, which tracks desktop traffic, and Mobile Metrix, which tracks traffic from tablets and smartphone via browsers and apps. Desktop tracking occurs through background software for the same users over-time, about one million participants, recording visits to URLs. The mobile panel is approximately 20,000 adults.
Analyses include news sites, coded “News” if they provide more news than entertainment; “Entertainment” if it provides more entertainment; “Both” if it provides roughly equal amounts; and “N/A” if not a media outlet. A random sample (N = 300) was independently coded for ICR (Kappa = .90, agreement = 95.4%).
Due to comScore’s minimum reporting requirement, some sites did not get enough visits to be included. We drop outlets who fail to show up in both the Media and Mobile Metrix panels.
There is not sufficient N to estimate separate models for app users only.
References
comScore Media Metrix Description of Methodology.
Appendix
Study 1 Stimulus
Using information from a real news reports, a former news reporter crafted the story. The article was resembled a straight news piece. We also included a hyperlinked article in the footer using the heading “Related Stories,” to detect whether or not a participant noticed a link to the article. The link was not live. Screenshots of stimulus on each device in Figure A1 below. Stimulus was presented on a 27-inch monitor in the computer condition, on an iPad 2 with a 9.5 × 7.31-inch screen in the tablet condition, and on an iPhone 6s with a 4.7 × 5.5-inch screen in the smartphone condition.
Study 2 Stimulus
Stimulus was based on a news article about presidential candidate Donald Trump’s appearance as host on Saturday Night Live. Drawing on an actual news article we interchanged the words “heckle” (entertainment condition) and “protest” (news condition) to describe a group’s interference, as a subtle content type manipulation. Since the manipulation failed, analyses are combined (see footnote 5). Stories included two links and an image of Trump. The link was not live, unbeknownst to participants. Stimulus was presented on a 27-inch monitor in the computer condition, and on an iPad 2 with a 9.5 × 7.31-inch screen in the tablet condition.
Variables, Measurements, and Descriptive Statistics (Study 1 and 2)
| Treatments | Measurement | Study 1 | Study 2 |
|---|---|---|---|
| Device Use | Device participants used. |
|
|
| News Type | Type of news story. | – |
|
| Time Reading News Content | Time participants spent on reading the news story; measured in seconds. |
|
|
| Duration of Link Fixations | The duration of all fixations on link(s); in seconds. |
|
|
| Counts of Link Fixations | The number of times the participant fixates on links. |
|
|
| Noticing Link(s) | Dummy for whether participants fixated on links. |
|
|
Model Details, Variables, Measurements, and Descriptive Statistics (Study 3)
| Variables | Measurement | Descriptive Statistics | Source |
|---|---|---|---|
| Device Use | The device of access. |
| comScore |
| News | Whether the website is news or entertainment. |
| Three coders |
| App | Access via application or browser. |
| comScore |
| Average Minutes Per Visitor | Avg. minutes spent on the website, per visitor. |
| comScore |
| Average Minutes Per Visit | The average minutes on the website, per visit. |
| comScore |
ANOVA Models Predicting Attention to News and Links (Study 1)
| Outcome Variables | All Conditions | Pairwise Comparisons | ||
|---|---|---|---|---|
| Tablet vs. Computer | Smartphone vs. Computer | Smartphone vs. Tablet | ||
| Time Reading | F(2,106) = 26.26*** | diff = −1.55*** | diff = −1.14*** | diff = 0.40 |
| No. Looks (link) | F(2,106) = 7.84*** | diff = −0.71*** | diff = −0.53** | diff = 0.18 |
| Time on Link | F(2,106) = 6.13** | diff = −0.33** | diff = −0.20 | diff = 0.12 |
Note: All dependent variables were logged for skewness. ***p < 0.001, **p < 0.01.
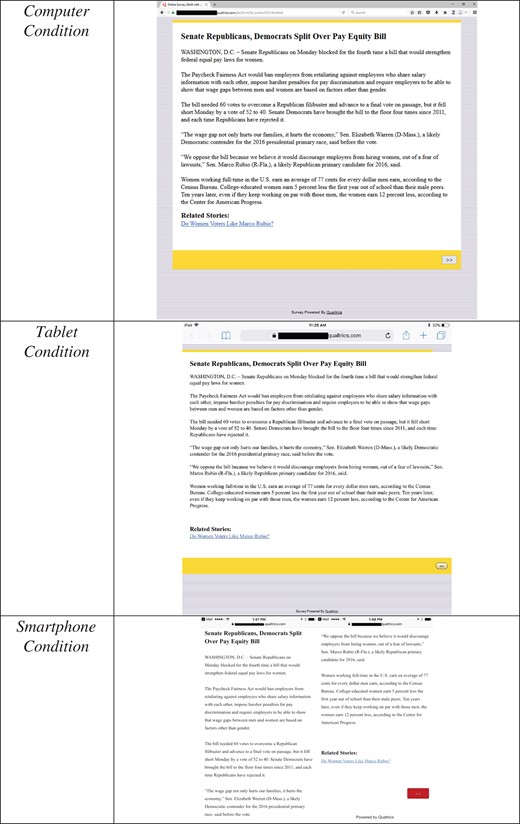
Screen shots by condition, Study 1.
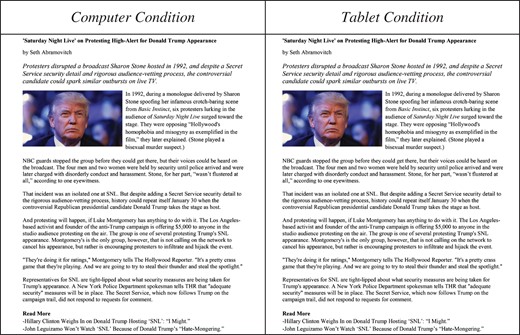
Screen shots by condition, Study 2.
Author notes
Accepted by S. Shyam Sundar
Study 1 and Study 2 were conducted in the LSU Manship School of Communication Media Effects Lab (MEL). Study 2 was funded by the Darlene & Thomas O Ryder Professorship in the Manship School of Mass Communication and LSU, which is held by Searles.
