


Abstract
How lymph node metastasis (LNM)-associated mortality risk is affected by BRAF V600E in papillary thyroid cancer (PTC) remains undefined.
To study whether BRAF V600E affected LNM-associated mortality in PTC.
We retrospectively analyzed the effect of LNM on PTC-specific mortality with respect to BRAF status in 2638 patients (2015 females and 623 males) from 11 centers in 6 countries, with median age of 46 [interquartile range (IQR) 35-58] years and median follow-up time of 58 (IQR 26-107) months.
Overall, LNM showed a modest mortality risk in wild-type BRAF patients but a strong one in BRAF V600E patients. In conventional PTC (CPTC), LNM showed no increased mortality risk in wild-type BRAF patients but a robustly increased one in BRAF V600E patients; mortality rates were 2/659 (0.3%) vs 4/321 (1.2%) in non-LNM vs LNM patients (P = 0.094) with wild-type BRAF, corresponding to a hazard ratio (HR) (95% CI) of 4.37 (0.80-23.89), which remained insignificant at 3.32 (0.52-21.14) after multivariate adjustment. In BRAF V600E CPTC, morality rates were 7/515 (1.4%) vs 28/363 (7.7%) in non-LNM vs LNM patients (P < 0.001), corresponding to an HR of 4.90 (2.12-11.29) or, after multivariate adjustment, 5.76 (2.19-15.11). Adjusted mortality HR of coexisting LNM and BRAF V600E vs absence of both was 27.39 (5.15-145.80), with Kaplan-Meier analyses showing a similar synergism.
LNM-associated mortality risk is sharply differentiated by the BRAF status in PTC; in CPTC, LNM showed no increased mortality risk with wild-type BRAF but a robust one with BRAF mutation. These results have strong clinical relevance.
Introduction
Papillary thyroid cancer (PTC) is common, accounting for 90% of all thyroid malignancies with a rapidly rising incidence in recent decades (1,2). PTC can be classified into several histological variants, among which the most common is conventional PTC (CPTC), accounting for 70% to 75% of all PTCs (1,3). Thus, management of CPTC accounts for the bulk of the clinical practice of thyroid cancer medicine. The mortality risk of PTC is low in general but high in a subgroup of patients, making accurate mortality risk assessment critical for individualized patient treatments (4). This is currently achieved primarily through assessing clinicopathological risk factors, among which cervical lymph node metastasis (LNM) is a prominent one. Occurring in about 50% to 60% of patients, LNM is generally treated as a risk factor for poor prognosis of PTC (5-8). In fact, LNM is included as one of the most important risk variables in virtually all mortality risk staging systems for thyroid cancer, including, for example, the systems of MACIS (metastases, age, completeness of resection, invasion, and size) (9), the American Joint Commission of Cancer (10,11), the American and European Thyroid Associations (4,12,13), and a few others (14,15). Yet, study results on LNM-related mortality risk in PTC vary, with some demonstrating a great significance (5,16) but others showing none (17-20). Thus, it seems that LNM may not be equal in mortality risk in PTC in all patients, but it is currently not possible to efficiently differentiate LNM-related mortality risk in PTC solely based on clinical grounds. Consequently, overtreatment of PTC is common when LNM is present, inevitably increasing the risk of treatment-associated complications (6,8).
BRAF V600E is a prominent oncogene in PTC, occurring in about 45% of cases on average (21). This mutation has been shown to be associated with poor clinicopathological outcomes of PTC, including LNM, disease recurrence, and patient mortality (22-24). BRAF V600E, through overactivating the mitogen-activated protein kinase (MAPK) pathway, promotes oncogenesis and aggressiveness of PTC (25). We tested here our hypothesis that BRAF V600E might play an important role in LNM-related mortality risk in PTC, thus differentiating LNM in wild-type BRAF PTC and BRAF-mutant PTC into 2 fundamentally different categories of mortality risk.
Patients and Methods
Patients
This study included a total of 2638 patients with PTC (2015 females and 623 males) from 11 centers in 6 countries, with median age of 46 [interquartile range (IQR) 35-58] years at diagnosis and median follow-up time of 58 (IQR 26-107) months as previously documented (Table 1) (26). All patients received total or near-total thyroidectomy. Therapeutic neck lymph node dissection and, sometimes, prophylactic central neck dissection (pCND) were performed as clinically indicated. Diagnoses of PTC were pathologically established using the World Health Organization criteria as previously described (23,24,26). Radioiodine-131 treatments, thyroid-stimulating hormone suppression, and other postsurgical managements were pursued following standard clinical practice. Recurrence of PTC referred to recurrent/persistent disease based on standard biochemical (thyroglobulin) and structural (cytologic, histologic, and radiographic) criteria (12,13). Disease-specific mortality was defined as patient death caused by PTC. Clinical follow-up time referred to the time period from the initial thyroidectomy to PTC-specific death of the patient (for mortality analyses), to the discovery of the disease presence (for recurrence analyses), or to the most recent clinical visit for patients who had no disease recurrence.
Summary of centers, countries and subjects included in the present study
| Medical center or country | No. of subjects | Age at diagnosis, median (IQR), years | Male sex, n (%) |
|---|---|---|---|
| Medical centers | |||
| 1. Johns Hopkins Hospital (USA) | 1051 | 46 (36-57) | 287 (27.3) |
| 2. University of Pisa (Italy) | 189 | 38 (28-51) | 47 (24.9) |
| 3. University of Perugia (Italy) | 117 | 49 (37-59) | 32 (27.4) |
| 4. University of Milan (Italy) | 265 | 45 (36-58) | 63 (23.8) |
| 5. Maria Sklodowska-Curie Memorial Cancer Centre and Institute of Oncology (Poland) | 253 | 47 (35-59) | 30 (11.9) |
| 6. Griffith University (Australia) | 76 | 40 (34-56) | 20 (26.3) |
| 7. University of Padua (Italy) | 135 | 48 (39-57) | 32 (23.7) |
| 8. University of Pittsburgh (USA) | 169 | 52 (38-63) | 42 (24.9) |
| 9. Hospital La Paz Health Research Institute, Madrid (Spain) | 66 | 42 (32-54) | 11 (16.7) |
| 10. University of Sydney (Australia) | 95 | 44 (34-59) | 20 (21.1) |
| 11. Institute of Endocrinology, Prague (Czech Republic) | 222 | 47 (31-60) | 39 (17.6) |
| Countries | |||
| United States | 1220 | 47 (37-58) | 329 (27.0) |
| Italy | 706 | 45 (34-56) | 174 (24.6) |
| Poland | 253 | 47 (35-59) | 30 (11.9) |
| Australia | 171 | 43 (34-57) | 40 (23.4) |
| Spain | 66 | 42 (32-54) | 11 (16.7) |
| Czech Republic | 222 | 47 (31-60) | 39 (17.6) |
| Overall | 2638 | 46 (35-58) | 623 (23.6) |
Abbreviation: IQR, interquartile range.
Study Design
This multicenter study was conducted retrospectively with data obtained from medical records with approval by the institutional review board at each participating center. Where required, informed patient consent for the use of PTC specimens and clinicopathological information was obtained as described previously (23,24,26). BRAF V600E mutation was examined by Sanger’s sequencing of exon 15 of the BRAF gene on genomic DNA isolated from primary PTC tumors (23,24,26). BRAF mutation status was retrospectively examined for the research and did not affect the clinical treatment selection. Pooled data were used to analyze the relationship between LNM and clinicopathological outcomes with respect to the BRAF status.
Statistical Analyses
Categorical variables were compared using the Pearson chi-square test and the Fisher’s exact test was used for case number ≤5. Comparison of median and IQR of continuous variables in nonparametric independent samples was performed using Wilcoxon-Mann-Whitney test. Kaplan-Meier (K-M) analysis was used to estimate the survival probability and log-rank test was used to compare the differences between K-M curves of patients in various genetic and clinical groups. Multivariate adjustment was achieved using Cox regression and Cox proportional hazards analyses, with calculation of hazard ratios (HRs) and 95% CI. All P-values were 2-sided, with a value < 0.05 being treated as significant. The study used the Statistical Package for Social Science (SPSS) version 22.0 (IBM SPSS, Inc, New York, USA) for the previously discussed statistical analyses.
Results
Confirmation of the Overall Role of LNM in the Aggressiveness and Mortality of PTC
Given previous inconsistent reports on the role of cervical LNM in clinical outcomes of PTC, we took advantage of this large multicenter cohort of PTC to further investigate the role of LNM. The overall analysis of our patients confirmed that LNM was significantly associated with aggressive clinicopathological presentations of PTC, including larger tumor size, extrathyroidal extension, distant metastasis, and advanced tumor stages III/IV as well as BRAF V600E mutation; this was seen both on the analysis of the entire cohort of the PTC and on the analysis of CPTC alone (Table 2). Also confirming some previous reports, we found LNM to be significantly associated with PTC recurrence and patient mortality, being 108/1717 (6.3%) vs 313/896 (34.9%) and 11/1717 (0.6%) vs 47/896 (5.2%) in patients without LNM (non-LNM patients) vs patients with LNM (LNM patients), respectively, on the analysis of the entire cohort and 74/1182 (6.3%) vs 244/690 (35.4%) and 9/1182 (0.8%) vs 32/690 (4.6%) in non-LNM vs LNM patients, respectively, on the analysis of CPTC.
Demographics and relationship between LNM and clinicopathological characteristics of PTC
| Total | Non-LNMa | LNMa | ||
|---|---|---|---|---|
| n (%) | n (%) | n (%) | P-value | |
| All PTC | ||||
| n (%) a | 2638 | 1717/2613 (65.7) | 896/2613 (34.3) | |
| Sex (male) | 623/2638 (23.6) | 353/1717 (20.6) | 264/896 (29.5) | <0.001 |
| Age at diagnosis, na | 2638 | 1717 | 896 | |
| Median (IQR), years | 46 (35-58) | 48 (37-58) | 41 (31-55) | <0.001 |
| Age ≥45 yearsa | 1408/2638 (53.4) | 988/1717 (57.5) | 401/896 (44.8) | <0.001 |
| Tumor size, na | 2601 | 1699 | 878 | |
| Median (IQR), cm | 1.5 (1.0-2.5) | 1.5 (1.0-2.4) | 2.0 (1.2-3.0) | <0.001 |
| Tumor size >1.0 cma | 1820/2601 (70.0) | 1114/1699 (65.6 ) | 704/878 (80.2) | <0.001 |
| Multifocalitya | 1000/2624 (38.1) | 557/1710 (32.6) | 430/889 (48.4) | <0.001 |
| Extrathyroidal extensiona | 668/2634 (25.4) | 265/1716 (15.4) | 401/894 (44.9) | <0.001 |
| Tumor stage III/IVa | 614/2618 (23.5) | 226/1704 (13.3) | 385/890 (43.3) | <0.001 |
| Distant metastasisa | 118/2615 (4.5) | 27/1699 (1.6) | 90/892 (10.1) | <0.001 |
| BRAF mutationa | 1094/2618(41.8) | 651/1707(38.1) | 437/886(49.3) | <0.001 |
| I-131 treatmentb | 1984/2559 (77.5) | 1172/1662 (70.5) | 807/872(92.5) | <0.001 |
| Follow-up timea (R), n | 2638 | 1717 | 896 | |
| Median (IQR), months | 51 (23-96) | 57 (25-107) | 40 (19-83) | <0.001 |
| Tumor recurrencea | 423/2638 (16.0) | 108/1717 (6.3) | 313/896(34.9) | <0.001 |
| Follow-up timea (M), n | 2638 | 1717 | 896 | |
| Median (IQR), months | 58 (26-107) | 61 (26-110) | 52 (26-98) | 0.041 |
| Mortalitya | 58/2638 (2.2) | 11/1717 (0.6) | 47/896(5.2) | <0.001 |
| CPTC | ||||
| n (%)a | 1893 | 1182/1872 (63.1) | 690 /1872(36.9) | |
| Age at diagnosis,a n | 1893 | 1182 | 690 | |
| Median (IQR), years | 46 (35-57) | 48 (38-59) | 40.5 (31-54) | <0.001 |
| Age ≥45 yearsa | 1002/1893 (52.9) | 682/1182 (57.7) | 304/690 (44.1) | <0.001 |
| Tumor size,a n | 1873 | 1174/1853(63.4) | 679/1853(36.6) | |
| Median (IQR), cm | 1.5 (1.0-2.4) | 1.3(0.8-2.0) | 2.0 (1.2-3.0) | <0.001 |
| Tumor size >1.0 cma | 1241/1873 (66.3) | 704/1174 (60.0) | 536/679 (78.9) | <0.001 |
| Multifocalitya | 731/1888 (38.7) | 394/1180 (33.4 ) | 328/687 (47.7) | <0.001 |
| Extrathyroidal extensiona | 504/1890 (26.7) | 200/1181(16.9) | 302/689 (43.8) | <0.001 |
| Tumor stage III/IVa | 445/1881 (23.7) | 154/1175(13.1) | 288/685 (42.0) | <0.001 |
| Distant metastasisa | 74/1885 (3.9) | 18/1176 (1.5) | 55/688(8.0) | <0.001 |
| BRAF mutationa | 883/1879 (47.0) | 515/1174 (43.9) | 363/684 (53.1) | <0.001 |
| I-131 treatmentb | 1418/1851 (76.6) | 792/1157 (68.5) | 621/673(92.3) | <0.001 |
| Follow-up timea (R), n | 1893 | 1182 | 690 | |
| Median (IQR), months | 52 (24-99) | 58 (26-109) | 44 (19-85) | <0.001 |
| Tumor recurrencea | 320/1893 (16.9) | 74/1182 (6.3) | 244/690 (35.4) | <0.001 |
| Follow-up timea (M), n | 1893 | 1182 | 690 | |
| Median (IQR), months | 60 (27-110) | 63 (27-114) | 56 (27-107) | 0.203 |
| Mortalitya | 41/1893 (2.2) | 9/1182 (0.8) | 32/690 (4.6) | <0.001 |
Abbreviations: CPTC, conventional papillary thyroid cancer; I-131, iodine-131; LNM, lymph node metastasis; M, mortality; PTC, papillary thyroid cancer; R, recurrence.
aThese data were from medical centers 1-11, with total of 2638 patients with PTC, including 1893 CPTC. Sex (male), age at diagnosis, follow-up time for tumor recurrence (R), and follow-up time for mortality (M) missed 0 case. Tumor size, multifocality, extrathyroidal extension, lymph node metastasis, tumor stage III/IV, distant metastasis, and BRAF mutation missed 37 and 20, 14 and 5, 4 and 3, 25 and 21, 20 and 12, 23 and 8, and 20 and 14 cases in all PTC patients and CPTC patients, respectively.
bI-131 treatment data were from medical centers 1-5 and 7-11, with total of 2562 patients, including 1853 CPTC cases, missing 3 and 2 cases in all PTC patients and CPTC patients, respectively.
Differentiation of LNM-related Clinicopathological Aggressiveness of PTC by the BRAF V600E Status
When the cohort was divided into wild-type BRAF and BRAF V600E groups, there was a significant association between LNM and aggressive clinicopathological outcomes of PTC in both groups, but, in general, the event rates were higher in the BRAF-mutant group (Table 3). Of particular clinical relevance, on the overall analysis of the entire cohort of PTC, disease recurrence rates were 43/1056 (4.1%) vs 139/449 (31.0%) (P<0.001) in non-LNM vs LNM patients, respectively, in the wild-type BRAF group and 65/651 (10.0%) vs 173/437 (39.6%) (P < 0.001) in non-LNM vs LNM patients, respectively, in the BRAF-mutant group. On the analysis of only CPTC, disease recurrence rates were 26/659 (3.9%) vs 95/321 (29.6%) (P < 0.001) in non-LNM vs LNM patients, respectively, in the wild-type BRAF group and 48/515 (9.3%) vs148/363 (40.8%) (P < 0.001) in non-LNM vs LNM patients, respectively, in the BRAF-mutant group. Mortality rates on the analysis of all PTC were 3/1056 (0.3%) vs 13/449 (2.9%) (P < 0.001) in non-LNM vs LNM patients, respectively, in the wild-type BRAF group and 8/651 (1.2%) vs 34/437 (7.8%) (P < 0.001) in non-LNM vs LNM patients, respectively, in the BRAF-mutant group. Mortality rates on the analysis of CPTC were 2/659 (0.3%) vs 4/321 (1.2%) (P = 0.094) in non-LNM vs LNM patients, respectively, in the wild-type BRAF group; and 7/515 (1.4%) vs 28/363 (7.7%) (P < 0.001) in non-LNM vs LNM patients, respectively, in the BRAF-mutant group. The LNM-related mortality rate was robustly higher in BRAF-mutant than wild-type BRAF patients [28/363 (7.7%) vs 4/321 (1.2%), P < 0.001].
Relationship between LNM and clinicopathological characteristics of PTC with respect to the BRAF status
| Characteristics | Wild-type BRAF | BRAF V600E mutation | ||||
|---|---|---|---|---|---|---|
| Non-LNM | LNM | Non-LNM | LNM | |||
| n (%) | n (%) | P-value | n (%) | n (%) | P-value | |
| All PTCa | ||||||
| n (%) | 1056/1505 (70.2) | 449/1505 (29.8) | 651/1088 (59.8) | 437/1088 (40.2) | ||
| Age at diagnosis, n | 1056 | 449 | 651 | 437 | ||
| Median (IQR), years | 47 (37-57) | 38 (27-51) | <0.001 | 49 (38-60) | 46 (35-58) | 0.006 |
| Age ≥45 years | 584/1056 (55.3) | 163/449 (36.3) | <0.001 | 395/651 (60.7) | 235/437 (53.8) | 0.024 |
| Tumor size, n | 1044 | 437 | 645 | 431 | ||
| Median (IQR), cm | 1.4 (0.8-2.4) | 2.0 (1.2-3.0) | <0.001 | 1.5 (1.0-2.5) | 2.0 (1.2-3.0) | <0.001 |
| Tumor size >1.0 cm | 631/1044 (60.4) | 342/437 (78.3) | <0.001 | 477/645 (74.0) | 358/431 (83.1) | <0.001 |
| Multifocality | 335/1050 (31.9) | 207/443 (46.7) | <0.001 | 217/650 (33.4) | 217/436 (49.8) | <0.001 |
| Extrathyroidal extension | 102/1055 (9.7) | 171/448 (38.2) | <0.001 | 161/651 (24.7) | 225/436 (51.6) | <0.001 |
| Tumorstage III/IV | 96/1049 (9.2) | 159/444 (35.8) | <0.001 | 128/645 (19.8) | 223/436 (51.1) | <0.001 |
| Distant metastasis | 17/1044 (1.6) | 47/445 (10.6) | <0.001 | 10/645 (1.6) | 43/437 (9.8) | <0.001 |
| I-131 treatmentb | 658/1027 (64.1) | 405/435 (93.1) | <0.001 | 503/625 (80.5) | 392/427 (91.8) | <0.001 |
| Follow-up time (R), n | 1056 | 449 | 651 | 437 | ||
| Median (IQR), months | 64 (27-120) | 46 (21-90) | <0.001 | 48 (22-92) | 33 (16-67) | <0.001 |
| Tumor recurrence | 43/1056 (4.1) | 139/449 (31.0) | <0.001 | 65/651 (10.0) | 173/437 (39.6) | <0.001 |
| Follow-up time (M), n | 1056 | 449 | 651 | 437 | ||
| Median (IQR), mo | 65 (29-121) | 53 (27-103) | 0.021 | 52 (24-96) | 49 (25-96) | 0.905 |
| Mortality | 3/1056 (0.3) | 13/449 (2.9) | <0.001 | 8/651 (1.2) | 34/437 (7.8) | <0.001 |
| CPTCa | ||||||
| n (%) | 659/980 (67.2) | 321/980 (32.8) | 515/878 (58.7) | 363/878 (41.3) | ||
| Age at diagnosis, n | 659 | 321 | 515 | 363 | ||
| Median (IQR), years | 47 (38-57) | 38 (27-49) | <0.001 | 48 (37-60) | 45 (34-57) | 0.007 |
| Age ≥45 years | 372/659 (56.4) | 115/321 (35.8) | <0.001 | 302/515 (58.6) | 187/363 (51.5) | 0.036 |
| Tumor size, n | 655 | 316 | 511 | 357 | ||
| Median (IQR), cm | 1.0 (0.6-2.0) | 1.8 (1.1-3.0) | <0.001 | 1.5 (1.0-2.2) | 2.0 (1.2-3.0) | <0.001 |
| Tumor size >1.0 cm | 326/655 (49.8) | 239/316 (75.6) | <0.001 | 374/511 (73.2) | 296/357 (82.9) | 0.001 |
| Multifocality | 219/658 (33.3) | 143/319 (44.8) | <0.001 | 171/514 (33.3) | 180/362 (49.7) | <0.001 |
| Extrathyroidal extension | 74/658 (11.2) | 120/321 (37.4) | <0.001 | 124/515 (24.1) | 179/362 (49.4) | <0.001 |
| Tumor stage III/IV | 56/656 (8.5) | 110/317 (34.7) | <0.001 | 96/511 (18.8) | 176/362 (48.6) | <0.001 |
| Distant metastasis | 10/656 (1.5) | 21/319 (6.6) | <0.001 | 8/512 (1.6) | 34/363 (9.4) | <0.001 |
| I-131 treatmentb | 386/650 (59.4) | 289/313 (92.3) | <0.001 | 397/499 (79.6) | 326/354 (92.1) | <0.001 |
| Follow-up time (R), n | 659 | 321 | 515 | 363 | ||
| Median (IQR), months | 66 (34-127) | 48 (22-95) | <0.001 | 48 (23-94) | 36 (16-72) | <0.001 |
| Tumor recurrence | 26/659 (3.9) | 95/321 (29.6) | <0.001 | 48/515 (9.3) | 148/363 (40.8) | <0.001 |
| Follow-up time (M), n | 659 | 321 | 515 | 363 | ||
| Median (IQR), months | 70 (36-129) | 58 (28-116) | 0.038 | 52 (24-97) | 54 (27-102) | 0.393 |
| Mortality | 2/659 (0.3) | 4/321 (1.2) | 0.094c | 7/515 (1.4) | 28/363 (7.7) | <0.001 |
Abbreviations: CPTC, conventional papillary thyroid cancer; I-131, iodine-131; IQR, interquartile range; LNM, Lymph node metastasis; PTC, papillary thyroid cancer.
aThese data were from medical centers 1-11, with total of 2638 patients with PTC, including 1893 CPTC. Sex (male), age at diagnosis, follow-up time for tumor recurrence (R), and follow-up time for mortality (M) missed 0 case. Tumor size, multifocality, extrathyroidal extension, lymph node metastasis, tumor stage III/IV, distant metastasis, and BRAF mutation missed 37 and 20, 14 and 5, 4 and 3, 25 and 21, 20 and 12, 23 and 8, and 20 and 14 cases in all PTC patients and CPTC patients, respectively.
bI-131 treatment data were from medical centers 1-5 and 7-11, with total of 2562 patients, including 1853 CPTC cases, missing 3 and 2 cases in all PTC patients and CPTC patients, respectively.
cFisher’s exact test.
We also analyzed HRs of LNM-related risks (Table 4). On the overall analysis of patients regardless of the BRAF status, significant HRs of LNM for disease recurrence and patient mortality were obtained both on the analyses of the entire cohort of PTC and on CPTC alone, which all remained significant (all Ps < 0.001) after multivariate adjustment for patient sex (male), age at diagnosis, tumor size, multifocality, extrathyroidal extension, and iodine-131 treatment. When dividing the patients into wild-type BRAF and BRAF-mutant groups, HRs of LNM for disease recurrence risk were highly significant and remained significant after multivariate adjustment both in the wild-type BRAF and BRAF-mutant patients and both on the analysis of the entire PTC and on the analysis of CPTC (all Ps < 0.001). The LNM-related mortality risk, however, was strikingly different. In wild-type BRAF patients, it was modestly increased on the analysis of the entire cohort of PTC, but it was insignificant on the analysis of CPTC (P = 0.089), which became even more insignificant (P = 0.203) after multivariate adjustment. In contrast, in BRAF-mutant patients, LNM-related mortality risk was significant both on the analysis of total PTC and on the analysis of CPTC, with HRs being 5.85 (2.69-12.69) and 4.90 (2.12-11.29), respectively, which remained significant at 5.66 (2.38-13.45) and 5.76 (2.19-15.11), respectively, after multivariate adjustment (Table 4).
Hazard ratios of LNM vs non-LNM in risk of recurrence and mortality of ptc with respect to the BRAF status
| Entire cohort | Wild-type BRAF | BRAF V600E | ||||||||||
|---|---|---|---|---|---|---|---|---|---|---|---|---|
| Tumor type and event | HR (95% CI) | P-value | Adjusted HRa (95% CI) | P-value | HR (95% CI) | P-value | Adjusted HRa (95% CI) | P-value | HR (95% CI) | P-value | Adjusted HRa (95% CI) | P-value |
| All PTC | ||||||||||||
| Tumor recurrence | 6.63 (5.32-8.26) | <0.001 | 5.02 (3.93-6.41) | <0.001 | 8.94 (6.33-12.64) | <0.001 | 6.05 (4.11-8.90) | <0.001 | 4.75 (3.57-6.32) | <0.001 | 4.00 (2.93-5.46) | <0.001 |
| Mortality | 8.35 (4.32-16.14) | <0.001 | 6.78 (3.17-14.48) | <0.001 | 10.61 (3.02-37.25) | <0.001 | 6.75 (1.65-27.65) | .008 | 5.85 (2.69-12.69) | <0.001 | 5.66 (2.38-13.45) | <0.001 |
| CPTC | ||||||||||||
| Tumor recurrence | 6.71 (5.17-8.73) | <0.001 | 4.79 (3.59-6.38) | <0.001 | 8.87 (5.71-13.79) | <0.001 | 5.14 (3.19-8.28) | <0.001 | 5.15 (3.72-7.14) | <0.001 | 4.20 (2.95-5.98) | <0.001 |
| Mortality | 6.10 (2.90-12.82) | <0.001 | 5.59 (2.34-13.33) | <0.001 | 4.37 (0.80-23.89) | 0.089 | 3.32 (0.52-21.14) | .203 | 4.90 (2.12-11.29) | <0.001 | 5.76 (2.19-15.11) | <0.001 |
Abbreviations: CPTC, conventional papillary thyroid cancer; HR, hazard ratio; LNM, lymph node metastasis; PTC, papillary thyroid cancer.
aAdjusted for sex (male), patient age at diagnosis, tumor size, multifocality, extrathyroidal extension, and iodine-131 treatment.
No increased Mortality Risk of LNM Alone but Robustly Synergized Risk of LNM by BRAF V600E in CPTC
When dividing the patients into 4 groups according to the status of LNM and genotype of BRAF as summarized in Table 5, in the analysis of the entire cohort of PTC, compared with the mortality rate [3/1056 (0.3%)] of the group negative both for LNM and BRAF V600E, the mortality rates were higher in patients only with LNM, slightly higher in patients only with BRAF V600E, and robustly higher in patients with both LNM and BRAF V600E, being 13/449 (2.9%) (P < 0.001), 8/651 (1.2%) (P = 0.026), and 34/437 (7.78%) (P < 0.001), respectively. These corresponded to significant HRs, which, after multivariate adjustment, were 6.75 (1.65-27.65) (P = 0.008), 1.15 (0.25-5.37) (P = 0.862), and 25.78 (6.70-99.18) (P < 0.001), respectively. Thus, LNM alone showed a modest mortality risk, BRAF V600E alone showed no mortality risk, and coexisting LNM and BRAF V600E showed a synergistically robust mortality risk after multivariate adjustment.
Mortality risks in various settings of LNM and BRAF status in PTC
| Tumor type and groups | Mortality, n (%) | P value | Unadjusted HR (95% CI) | P-value | Adjusted HRa (95% CI) | P-value |
|---|---|---|---|---|---|---|
| All PTC | ||||||
| Wild-type BRAF and LNM (−) | 3/1056 (0.3) | Reference | Reference | Reference | ||
| Wild-type BRAF and LNM (+) | 13/449 (2.9) | <0.001b | 10.61 (3.02-37.25) | <0.001 | 6.75 (1.65-27.65) | 0.008 |
| BRAF V600E and LNM (−) | 8/651 (1.2) | 0.026a,b | 4.93 (1.31-18.64) | 0.019 | 1.15 (0.25-5.37) | 0.862 |
| BRAF V600E and LNM (+) | 34/437 (7.78) | <0.001b | 31.95 (9.78-104.34) | <0.001 | 25.78 (6.70-99.18) | <0.001 |
| CPTC | ||||||
| Wild-type BRAF and LNM (−) | 2/659 (0.3) | Reference | Reference | Reference | ||
| Wild-type BRAF and LNM (+) | 4/321 (1.2) | 0.094a,b | 4.37 (0.80-23.89) | 0.089 | 3.32 (0.52-21.14) | 0.203 |
| BRAF V600E and LNM (−) | 7/515 (1.4) | 0.048a,b | 5.41 (1.12-26.14) | 0.036 | 0.57 (0.07-4.48) | 0.589 |
| BRAF V600E and LNM (+) | 28/363 (7.7) | <0.001a | 30.30 (7.19-127.69) | <0.001 | 27.39 (5.15-145.80) | <0.001 |
Abbreviations: CPTC, conventional papillary thyroid cancer; HR, hazard ratio; LNM, lymph node metastasis; PTC, papillary thyroid cancer.
aAdjusted for sex (male), patient age at diagnosis, tumor size, multifocality, extrathyroidal extension, and iodine-131 treatment.
bCompared to the mortality in the group of wild-type BRAF and LNM (−).
cFisher’s exact test.
On the analysis of CPTC, compared with the mortality rate [2/659 (0.3%)] of the group negative both for LNM and BRAF V600E, the mortality rate was not different in patients with LNM alone, being 4/321 (1.2%) (P = 0.094), slightly higher in patients only with BRAF V600E, being 7/515 (1.4%) (P = 0.048), and robustly higher in patients with both LNM and BRAF V600E, being 28/363 (7.7%) (P < 0.001). These corresponded to HRs of 4.37 (0.80-23.89) (P = 0.089), 5.41 (1.12-26.14) (P = 0.036), and 30.30 (7.19-127.69) (P < 0.001), which, after multivariate adjustment, became 3.32 (0.52-21.14) (P = 0.203), 0.57 (0.07-4.48) (P = 0.589), and 27.39 (5.15-145.80) (P < 0.001), respectively. Here, neither LNM alone nor BRAF V600E alone, after multivariate adjustment, showed increased mortality risk while coexisting LNM and BRAF V600E synergistically displayed a robustly increased mortality risk.
We also performed K-M analysis of survival curves to further address the relationship between LNM and BRAF V600E in affecting the mortality in PTC. As shown in Figure 1, the survival curve of patients with LNM alone dropped slightly on the analysis of the entire cohort of PTC (Fig. 1A) and did not drop on the analysis of CPTC (Fig. 1B). In both analyses, the survival curves stayed flat in patients negative both for LNM and BRAF V600E, dropped modestly with BRAF V600E alone, and dropped sharply with coexisting LNM and BRAF V600E, displaying a mortality risk of LNM robustly synergized by BRAF V600E.
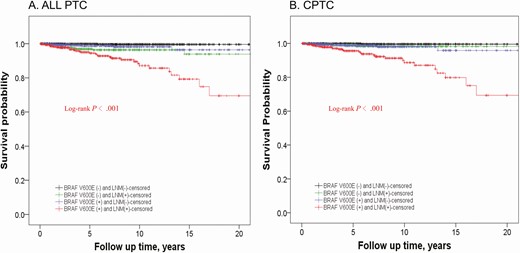
Kaplan-Meier analyses of patient survival probability associated with LNM and the impact of the BRAF status on it in PTC. Shown are censored survival curves. The analyses were performed on the entire cohort of PTC (A) and on CPTC alone (B). In each panel, patients were divided into 4 groups: patients without BRAF V600E mutation and LNM (BRAF V600E− and LNM−, black line); patients without BRAF mutation but with LNM (BRAF V600E− and LNM+, green line); patients with BRAF mutation but without LNM (BRAF V600E+ and LNM−, blue line); and patients with both BRAF mutation and LNM (BRAF V600E+ and LNM+, red line). Abbreviations: CPTC, conventional papillary thyroid cancer; LNM, lymph node metastasis; PTC, papillary thyroid cancer.
Discussion
Cervical LNM, widely treated as a high mortality risk in PTC, is included as a major component virtually in all mortality risk-staging systems for thyroid cancer (9-15); it is an indispensable factor in today’s clinical risk assessment of PTC (4). In these staging systems, LNM is usually included simply as presence or absence without further risk differentiation. It remains unanswered, however, whether LNM is simply a universal mortality risk that can be clinically measured only by its presence or absence in PTC. This is unclear particularly given the previous inconsistent reports on the LNM-related mortality risk in PTC, complicating the clinical decision-making on the management of LNM in PTC (5,16-20).
The present study confirmed some previous reports on LNM-related mortality in PTC on the overall analysis of all patients and demonstrated a synergism between LNM and BRAF V600E in aggravating mortality in PTC. A particularly striking finding was that LNM in CPTC showed no increased mortality risk with wild-type BRAF but a robust one with BRAF V600E. This is contrary to the long-held belief that LNM is a major independent mortality risk in PTC in general. This may also provide an explanation for the previous inconsistent reports on LNM-related mortality in PTC: depending on the rate of BRAF V600E and the composition of CPTC variant in study cohorts, results may vary.
It is interesting that the role of BRAF V600E in driving LNM-related mortality is particularly evident in CPTC. This is consistent with the fact that as a histologically homogeneous PTC variant that is driven primarily by the MAPK pathway, CPTC can be particularly influenced by BRAF V600E in its oncogenesis (25). In fact, previous studies showed that the general role of BRAF V600E in patient mortality and disease recurrence was indeed more clear in CPTC (23,24,26). One study showed that BRAF V600E was associated with LNM only in CPTC, but not in other PTC variants, such as follicular variant of PTC (27). In the latter, MAPK pathway is not dominant in driving the oncogenesis, and BRAF V600E is not common (25). There were also other variants of PTC contained in the entire cohort whose behaviors are driven by other molecular mechanisms (not BRAF). Therefore, the effect of BRAF mutation was not as evident in the analysis of the entire cohort as in the analysis of CPTC alone. It thus makes sense to see that LNM-related mortality risk is governed by BRAF V600E particularly in CPTC while on the analysis of the entire cohort of PTC, which contained variants other than CPTC, LNM showed a slightly different pattern of risk with respect to the BRAF status.
There is an excellent concordance in the BRAF V600E status between the primary PTC and associated metastatic lymph nodes (28-31). It was reported that extranodal extension of LNM was associated with increased disease aggressiveness and patient mortality of PTC (32), and, interestingly, combined positivity for BRAF V600E in PTC and extranodal LNM had an additive effect on patient mortality (33). These data are consistent with the important role of BRAF V600E in LNM-related mortality risk in PTC found in the present study. It is well known that LNM is extremely common in pediatric patients with PTC, but the mortality is much lower in this population than that in adult population (7,34,35). Correspondingly, it is also known that BRAF V600E in PTC is much less prevalent in pediatric patients than adult patients (21,36). These are consistent with the finding in the present study that LNM in the absence of BRAF V600E has only a modest or no mortality risk in PTC, particularly CPTC.
The present study showed that LNM in PTC was always associated with increased recurrence regardless of the BRAF status and whether the analysis was performed on the entire cohort of PTC or CPTC alone. This suggests that even in wild-type BRAF PTC, the presence of LNM at the initial thyroid surgery predicts an increased disease recurrence. However, such disease recurrence in wild-type BRAF PTC represents a relatively indolent clinical course with limited or no mortality, particularly in CPTC, in contrast to LNM-associated disease recurrence in BRAF-mutant PTC that represents a high-mortality risk.
The findings in the present study will likely have a wide clinical impact given the fact that most thyroid cancers encountered are CPTC and half of the cases are negative for BRAF V600E on average. By sharply differentiating the LNM-related mortality risk, BRAF status may help better risk-stratify and more accurately manage an extremely large number of patients. Specifically, knowledge of the BRAF status in addition to LNM may be helpful in such clinical decision making: LNM alone in wild-type BRAF PTC, particularly CPTC, may just need relatively conservative treatments, while in BRAF-mutant patients it may need enhanced treatments. An example is pCND, which represents a common clinical decision dilemma because it reduces regional recurrence of PTC but increases risk of surgical complications, such as dysphonia and hypoparathyroidism (37). Given the present study, pCND may be reserved mainly for patients with BRAF-mutant PTC in appropriate clinical settings. Because even in wild-type BRAF patients recurrence of PTC was common, it was previously recommended that BRAF V600E status should not impact the decision to perform pCND (8). This recommendation, however, was made then without knowing that the LNM-related mortality risk is not uniform in all patients but is sharply differentiated by the BRAF V600E status as now demonstrated in the present study. Another clinical scenario in which clinicians are often faced with treatment decision dilemma is to decide whether to conservatively follow or operate on a recurrent LNM. Given the lack of major effect of LNM on mortality in wild-type BRAF patients, recurrent LNM, particularly in CPTC, may be comfortably conservatively monitored in many clinical settings without the need to hasten the effort for early surgical interventions. This BRAF status-guided management of LNM may potentially affect also the way that radioiodine-131 treatments, thyroid-stimulating hormone suppression, and other postsurgical managements are currently pursued. These speculations will need to be confirmed in future studies or clinical practice.
One limitation of the present study was the lack of information on other genetic alterations, particularly the TERT promoter mutation, which is another important oncogenic driver of thyroid cancer (38,39). However, the TERT promoter mutation usually concurs with BRAF V600E, and the genetic duet of the two mutations is associated with aggressiveness of PTC while TERT promoter mutation alone virtually had no adverse effect (40,41). Other oncogenically aggressive genetic alterations are very rare in differentiated PTC (25). Thus, wild-type BRAF PTC, particularly CPTC, can be expected to virtually harbor no aggressive genetic alterations. Another limitation is that not all patients had neck dissection, and therefore non-LNM patients in the present study might have hidden LNM. However, this issue, if present, randomly and fairly applied to both wild-type BRAF and BRAF V600E patients because the BRAF status was not used to guide the treatment in this study. The fact that in all groups LNM patients had increased recurrence compared with non-LNM patients, regardless of the BRAF status, suggests that hidden LNM itself alone in the non-LNM patients was not a major mortality risk factor. Also, the present study was performed on overall LNM from all locations in the neck without regional specification. Even so, LNM-associated mortality risk was minimal in the absence of BRAF mutation in CPTC, suggesting that the location of LNM has minimal, if any, impact on LNM-related mortality and it is the BRAF mutation status that primarily determines LNM-related mortality. This, however, requires future studies to specifically define the role of LNM location.
In summary, this large multicenter study demonstrates that LNM-related mortality risk in PTC is not equal in all patients; it is governed by BRAF V600E and sharply differentiated by the BRAF status. This is particularly true with CPTC, in which LNM has no increased mortality risk in wild-type BRAF patients but has a robustly increased one in BRAF-mutant patients. This is against the long-held belief that LNM in PTC is a general mortality risk. This study provides important clinical implications for BRAF status-based precise risk stratification of LNM and tailored management of PTC, particularly CPTC.
Acknowledgments
Financial Support: This work was supported partly by the following funding at the individual participating centers: Polish National Center of Research and Development MILESTONE Project—molecular diagnostics and imaging in individualized therapy for breast, thyroid and prostate cancer, grant No. STRATEGMED2/267398/4/NCBR/2015 (Poland, AC, BJ); Grants No. PID2019-105303RB-I00 (AEI from MICINN), GCB14142311CRES (AECC Foundation), and B2017/BMD-3724 TIRONET2-CM (Spain; PS and GR-E); Grant No. AZV 16-32665A and MH CZ-DRO (Institute of Endocrinology-EU, 00023761) (Czech Republic; BB, VS); NIH/National Institute on Aging Grant No. 5R03AG042334-02 (LY); and grants from the Qingdao Science and Technology Project for People’s Livelihood No.13-1-3-58-nsh (China; FW) and the Innovative Platform Project of Qingdao No.12-1-2-15-jch (China; YW). The funding organizations had no role in the design and conduct of the study; the collection, management, analysis, and interpretation of the data; or the preparation, review, or approval of the manuscript. The content of this article is solely the responsibility of the authors and does not necessarily reflect the official views of the funding entities of the individual participating centers.
Additional Information
Disclosures: MX receives royalties as co-holder of a licensed US patent related to BRAF V600E mutation in thyroid cancer. Other authors have no conflict of interest to disclose.
Data Availability
All data are available in the main text.
References
Author notes
These people are regarded as equal first authors.
