


Abstract
Growth of male genitalia represents an important marker of sexual development. Testicle size is the primary measure and little is known regards penile length changes during puberty.
This work aims to assess penis growth and testosterone levels in obese vs normal-weight children and adolescents, to evaluate a possible influence of obesity on genital development in boys, and to establish a new method for measuring penis length that allows comparison of normal-weight and overweight boys.
We assessed anthropometric and genital development in 1130 boys from birth to age 20 years. Testosterone levels were also measured. A new method for penile length measurement was employed to minimize errors when comparing obese and nonobese children. Penis length was measured with a gentle, painless, straight positioning on a centimetric ruler without stretching, which is doable from the first years of life until the end of adolescence.
Penis length and testosterone are strongly related in children during puberty. Penile length growth is significantly decreased (by about 10%) in obese boys when compared to normal-weight boys, with concomitantly reduced testosterone levels, across puberal phases.
Childhood obesity represents an important determinant of lower testosterone level and reduced penis development. A new method should be employed to improve penis measurement in normal-weight and overweight/obese boys. The possible significance of these observations for adult genital development and reproductive potential will require large longitudinal studies.
Impaired growth of male genitalia can be an important sign of impaired hormonal secretion and abnormal male sexual development in children.
Although testicle size is considered the main point of reference to identify the onset of puberty, this parameter alone does not provide adequate information on the degree of sexual development prior to puberty onset because it remains quite stable during childhood. On the other hand, there is a slow, steady increase in penis length (PL) from birth to adult age. Thus, measurement of PL could represent a simple and inexpensive method, in clinical practice, to confirm correct male development and to identify early developmental hormonal disorders.
Several studies have evaluated normal PL. In most of them, measurements were taken in infants or preschoolers only and few studies examined penile growth from birth to the end of puberty. In these studies there was a wide variability in penile growth and PL.
Concerning those performed in the first years of life, the average length of the penis appears to be slightly but significantly smaller in Chinese as compared to White and East Indian infants (1). However, an accurate comparison with other studies seems to contradict the fact that ethnic differences might be the cause of different PL (2-4).
This variability could also be explained by the different stretching methods employed. The PL measurement in previous studies was performed with the original Schonfeld stretching technique, consisting of a stretched PL evaluation (5).
A complete extension of the penis shaft cannot be tolerated in the first years of life, and it is very difficult to obtain because of children’s continuous movements. Furthermore, in uncircumcised children, the correct grip of the penis can be compromised by the foreskin, preventing a true full traction, and also by phimosis. Also, the stretching could be operator dependent, and this represents another potential source of bias.
Finally, the variability of penile growth measurements could also be attributed to a different distribution of adipose tissue and body mass index (BMI) in the children and boys examined. Thus a different measurement method that reduces pubic fat interference should be employed. To our knowledge, there are no studies that have considered the potential impact of obesity on penile growth in childhood. The inverse relationship between adipose tissue and circulating testosterone levels in men is well known (6). Therefore, penile growth could be impaired in obese boys because of lower testosterone levels.
Few investigators have evaluated penis growth during development from childhood to puberty in overweight/obese children, and hormonal measurements were not taken in these studies.
Here we compared PL and testosterone levels in normal-weight and overweight/obese children from birth to age 20 years, in an attempt to understand a possible relationship between obesity, puberal development, and penile growth.
Materials and Methods
This cross-sectional study was performed on 1130 consecutive outpatients, from birth to age 20 years, who attended the Paediatric Andrology Clinic for general periodic examination, genital pain, varicocele, mobile testis, and scrotal cysts. Exclusion criteria were micropenis, puberty delay, hypospadias, genetic syndromes, growth and hormonal disorders like Klinefelter and Kallmann syndromes, and androgen insensitivity.
Clinical parameters such as age, height, weight, BMI, PL, and Tanner stage were collected. Laboratory tests included serum gonadotropins and testosterone sampled in the morning (testosterone assay: VITROS Competitive Immunodosage, Ortho-Clinical Diagnostics, Johnson and Johnson). Patients with abnormal gonadotropins levels were evaluated for endocrinological disorders and excluded from this study. We did not measure sex hormone–binding globulin and free testosterone because of the possible high variability secondary to nutritional status/obesity/early hepatic steatosis.
BMI was calculated with the formula weight in kilograms divided by height in meters squared. The weight status was determined according to World Health Organization (WHO) criteria for children younger than 2 years (obesity when BMI > 98th percentile; 2.0 SDS) and according to the US Centers for Disease Control and Prevention (CDC) criteria for children older than 2 years (obesity when BMI > 95th percentile; 1.65 SDS).
Underweight boys (< 2nd percentile according to the WHO, < 5th percentile according to the CDC) were excluded from the analysis.
Genital development and Tanner stage were evaluated by the same investigator to reduce interobserver bias, with the patients in the supine position and in a comfortable, temperature-stable room. In a significant number of unselected children (overweight n = 100; obese n = 100) of our sample it was possible to recover the testicular volume evaluated by ultrasound, inserted in the diagnostic when the device was available in the examination room. PL in the flaccid state was measured by employing a rigid centimetric ruler, from the pubic angle (0 cm, starting point of the measurement) to the top of the glans (X cm, final point of measurement), applying a gentle, painless, straight penis positioning perpendicular to the body without stretching (Fig. 1) All recorded length measurements were the average of 2 consecutive measurements. Pubic fat was compressed with one end of the ruler near the pubic bone. The foreskin of uncircumcised children was not considered in the measurement.
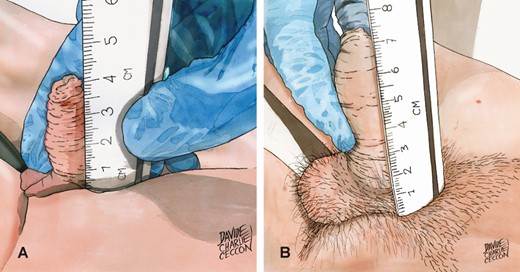
The new measurement method consists of gently placing the flaccid penis next to a rigid centimeter ruler held perpendicular to the body axis and strongly compressed on the pubic bone, without exerting any traction. The measurement is carried out up to the glans tip, excluding the foreskin perceived with the examiner’s fingers.
It is possible that the length measured with strong penile stretching is incorrect because it is responsible for wrong measurements mainly in obese children and boys, with further interference by the frequent presence of the foreskin, which creates difficulties in traction and changes the size of the penis in children. Repeated blinded measurements performed by different operators with the traditional Schonfeld stretched method and our new unstretched method have shown that the Schonfeld method in children appears to not reproduce well, especially if carried out by different operators of the same clinic. Measurements were performed in random order by 2 physicians during the same visit on 61 boys aged 4 to 19 years, with a BMI z score of 0.79 ± 0.14.
Interobserver agreement was good for resting PL measurements (mean difference 2.20 mm, with –8.2 mm and + 12.61 mm 95% limits of agreement, Fig. 2A) whereas greater variability was recorded for stretched PL measurements (mean difference 10.69 mm, with –8.33 mm and + 29.71 mm 95% limits of agreement, Fig. 2B). In fact, Passing and Bablok regression revealed negligible systematic and proportional differences between operators for resting measurements (–4.37 mm and 1.12 mm, respectively, Fig. 3A) and consistent systematic and proportional differences between operators for stretched penile measurements (–20.0 mm and 1.50 mm, respectively, Fig. 3B). Analysis of agreement between the 2 methods was carried out using the mean of results in a given patient and yielded consistent overestimation by stretched penile compared to resting penile measurement (mean difference 13.43 mm, with 1.01 mm and 25.84 mm 95% limits of agreement, Fig. 4A). Indeed, although the systematic difference appeared negligible (–1.8 mm), proportional bias indicated approximately 30% overestimation (Fig. 4B).
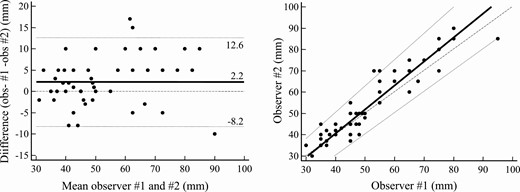
Interobserver analysis of resting penile measurement. A, Bland-Altman plot: mean (solid line), ±95% limits of agreement (dotted lines), and equality (dashed line) are shown. B, Passing and Bablok regression: mean (solid line), ±95% CI (dotted lines), and equality (dashed line) are shown. Individual measurements are shown as dots.
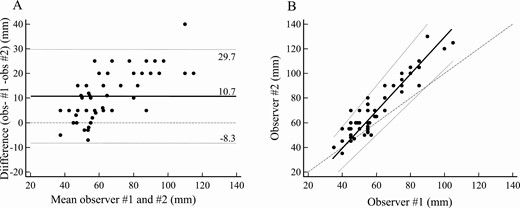
Interobserver analysis of stretched penile measurement. A, Bland-Altman plot: mean (solid line), ±95% limits of agreement (dotted lines), and equality (dashed line) are shown. B, Passing and Bablok regression: mean (solid line), ±95% CI (dotted lines), and equality (dashed line) are shown. Individual measurements are shown as dots.
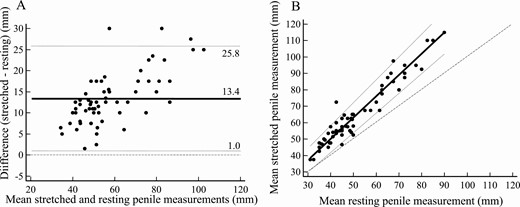
Comparison between stretched and resting penile measurements. A, Bland-Altman plot: mean (solid line), ±95% limits of agreement (dotted lines), and equality (dashed line) are shown. B, Passing and Bablok regression: mean (solid line), ±95% CI (dotted lines), and equality (dashed line) are shown. Mean of individual measurements are shown as dots.
Thus, to minimize these confounding factors, our gentle placement of the penis without extension seems to be suitable for all ages, from birth to the end of puberty, both in normal-weight and overweight/obese individuals. This new technique is important in the case of overweight and obese boys, in whom a strong penile extension can drag the peripubic fat and reduce the penile measurement.
Statistical Analysis
Unpaired t test and analysis of variance were employed for comparisons between variables; associations were tested by correlation analysis. Analyses were carried out by StatView Software (Abacus). Correlations were compared according to Statistics in Medicine (7). Agreement between measurements was assessed by Bland-Altman analysis (8) and method alignment was analyzed by Passing and Bablok regression (9), both procedures carried out using CBstat v.5.1. Data are expressed as mean + SEM or parameter with 95% confidence intervals (CI); statistical significance was set at P less than .05.
Results
The patient series included 833 normal-weight and 297 obese boys (Table 1). Age comparison at different puberal stages (P) revealed significant differences between obese and normal weight boys. Obese boys were older in P1 and significantly younger in P3 and P5 (Fig. 5). This suggests that puberty in obese young children in our study started later and evolved more rapidly at more advanced Tanner stages. In fact, testes volume was slightly smaller across pubertal stages in obese boys (Fig. 6). As compared to normal-weight boys, interestingly, testosterone levels were approximately 50% lower in obese compared to normal-weight boys at all puberal stages (Fig. 7). Correlation between age and testosterone levels during puberty was significantly weaker in obese compared to normal-weight boys (r = 0.59, 95% CI, 0.44-0.59 vs r = 0.73, 95% CI, 0.67-0.75, P < .05, Fig. 8). Likewise, testosterone normalized to testes volume was lower across all pubertal phases in obese vs normal-weight boys (Fig. 9).
Descriptive characteristics of the study population
| Normal weight | Obese | |
|---|---|---|
| Age | 9.60 ± 5.27 (0.05 to 19.5) | 10.31 ± 3.62 (0.25 to 18.25) |
| (y, mean ± SD, range) | ||
| BMI WHO | 0.11 ± 1.03 (–1.98 to 1.93) | 2.41 ± 0.37 (2.01 to 2.85) |
| (z score, mean ± SD, range) | ||
| BMI CDC | 0.39 ± 0.89 (–1.62 to 1.64) | 2.09 ± 0.35 (1.65 to 3.99) |
| (z score, mean ± SD, range) | ||
| Pubertal stage | No. of patients | No. of patients |
| P1 | 479 | 167 |
| P2 | 61 | 36 |
| P3 | 65 | 35 |
| P4 | 79 | 27 |
| P5 | 149 | 32 |
Abbreviations: BMI, body mass index; CDC, US Centers for Disease Control and Prevention; WHO, World Health Organization.

Mean age at puberal (P) stages for normal-weight (black bars) and obese (white bars) boys. Asterisk indicates P less than .05.
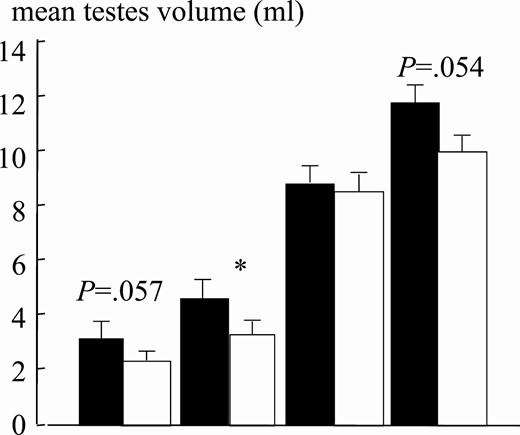
Mean testes volume at pubertal stages for normal-weight (black bars; n = 25 for each Tanner stage) and obese (white bars; n = 25 for each Tanner stage) boys. Asterisk indicates P less than .05.
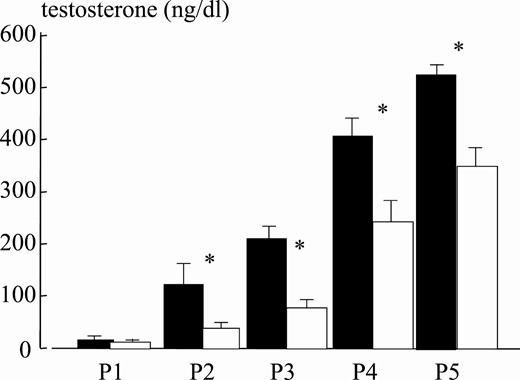
Mean testosterone levels at puberal stages for normal-weight (black bars) and obese (white bars) boys. Asterisk indicates P less than .05.
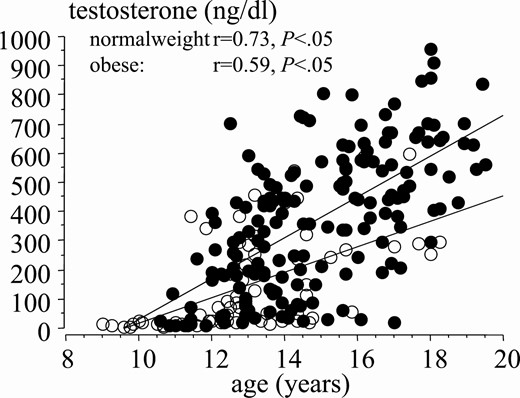
Correlation between testosterone levels and age during puberty in normal-weight (black dots) and obese (white dots) boys.
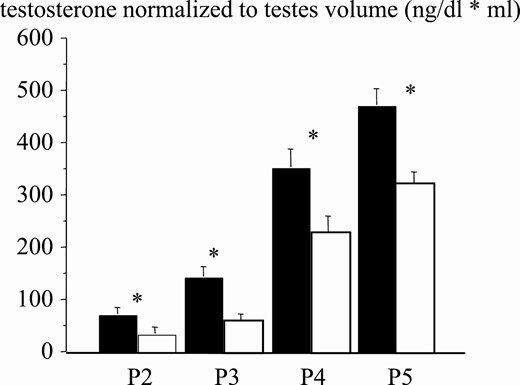
Testosterone normalized to testes volume at pubertal stages for normal-weight (black bars) and obese (white bars) boys. Asterisk indicates P less than .05.
As expected, testosterone negatively correlated with BMI during puberal development (r = –0.541, 95% CI, –0.57 to –0.44, P < .001; Fig. 10), and this also held true for each individual puberal phases (P2: r = –0.289, 95% CI, –0.34 to –0.01, P < .05; P3: r = –0.430, 95% CI, –0.49 to –0.21, P < .004; P4: r = –0.550, 95% CI, –0.61 to –0.31, P < .001; P5: r = –0.370, 95% CI, –0.42 to –0.17, P < .001, data not shown). Considering the critical role of testosterone in penile development, it is not surprising that PL in obese boys in the final puberal stages was shorter than their normal-weight counterparts. (Figs. 11 and 12) PL was shorter by approximately 11% in obese compared to normal-weight boys, with an average length decrease of 9.3 mm and 9.4 mm in P4 and P5, respectively (Table 2).
Comparison between normal-weight and obese boys across puberal stages
| P1 | P2 | P3 | P4 | P5 | ||||||
|---|---|---|---|---|---|---|---|---|---|---|
| Normal | Obese | Normal | Obese | Normal | Obese | Normal | Obese | Normal | Obese | |
| Age, y | 5.9 ± 0.17 | 8.2 ± 0.24a | 11.9 ± 0.18 | 11.3 ± 0.25 | 13.1 ± 0.17 | 12.4 ± 0.25a | 14.1 ± 0.13 | 13.7 ± 0.24 | 16.4 ± 0.12 | 15.1 ± 0.31a |
| Testosterone, ng/dL | 12.5 ± 2.11 | 10.7 ± 1.25 | 87.4 ± 19.3 | 38.2 ± 13.2a | 209.7 ± 25.14 | 74.2 ± 15.74a | 412.4 ± 34.14 | 242.7 ± 43.69a | 549.5 ± 19.73 | 346.5 ± 36.68a |
| Penis length, mm | 42.8 ± 0.39 | 43.4 ± 0.64 | 50.0 ± 1.29 | 49.4 ± 1.85 | 61.0 ± 2.22 | 55.9 ± 2.44 | 76.8 ± 1.98 | 67.5 ± 2.17a | 86.2 ± 1.31 | 76.8 ± 1.99a |
Abbreviation: P, pubertal stage.
aP less than .05 vs normal-weight counterparts.
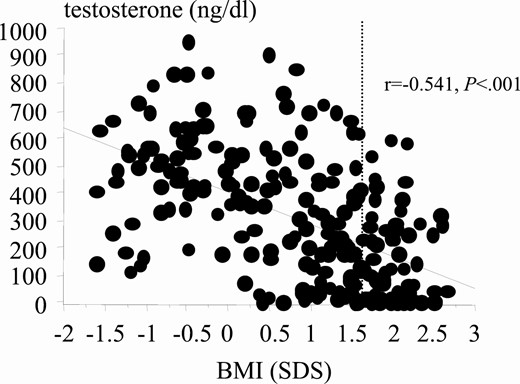
Correlation between testosterone levels and body mass index (BMI) during puberty. Dashed line indicates cutoff for obesity.
In the whole population, PL positively correlated with testosterone levels both in normal-weight (r = 0.747, 95% CI, 0.68-0.77, P < .001) and obese boys (r = 0.792, 95% CI, 0.72-0.82, P < .001; Fig. 13); no differences in the strength of correlation were observed (r = 0.747 vs r = 0.792, not significant [NS]). We also performed stepwise multiple regression analysis to determine the contribution of testosterone and obesity to PL. Interestingly, testosterone levels (F = 19.38, P < .001) but not BMI (F = 0.223, NS) nor the interaction between the testosterone and BMI (F = 0.211, NS) were significant predictors of PL, supporting the critical role played by testosterone in normal development penile growth.
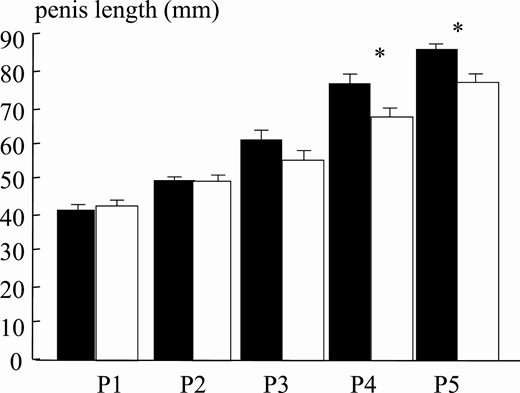
Mean penis length at puberal stages for normal-weight (black bars) and obese (white bars) boys. Asterisk indicates P less than .05.
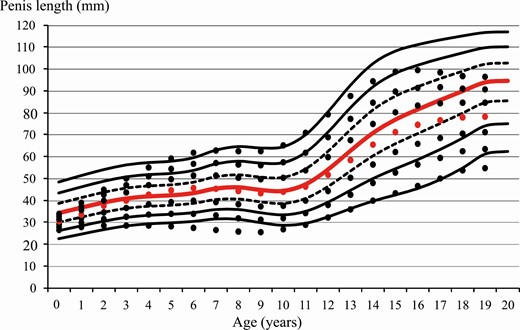
Penis length centiles over age normal-weight boys. Centiles for obese boys are shown as dots. Red line/dot corresponds to 50th percentile.
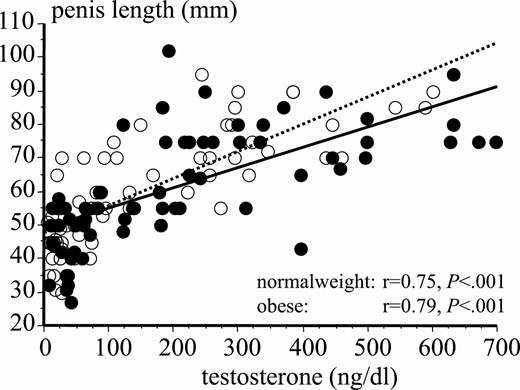
Correlation between testosterone levels and penis length during puberty in normal-weight (black dots) and obese (white dots) boys.
Discussion
An apparent genital developmental delay is often the stimulus for parents to bring the male child (normal-weight or overweight/obese) for a visit with the pediatric andrologist. Several requests for consultation are made early to pediatricians in overweight/obese children with a hidden penis, which is caused by suprapubic fat mass. Many patients seek advice after the onset of puberty, when the small size becomes noticeable (10).
In this phase, reduced penile growth is confounded by the wide variability of the puberal maturation stage (11-13).
Interestingly, if the diagnosis of reduced penile growth is made before the onset of puberty, pharmacological treatment is possible (14).
For a correct diagnosis of an underdeveloped penis, with a particular focus on overweight boys, a precise measurement performed in an identical manner between normal-weight and overweight individuals and by referring to growth curves considered normal is therefore mandatory.
Interestingly, a comparison of several studies on PL shows a very wide variability.
In the newborn, the diagnosis of micropenis is made if penis length is less than 2.5 SDs below normal, corresponding to a limit value of 27 mm in Cinaz et al, 25 mm in Custer and Rau, 29 mm in Akin and colleagues, and 22 mm in Kutlu (3, 4, 15, 16). According to these cutoffs, the normal value of PL at birth is quite variable. Therefore, measurements carried out in the first year of life are difficult to use in evaluating the normal growth of the genital system.
If we assume as normal values those recorded at the end of the first year of life, the studies report an average length of 44 mm in Cinaz and colleagues, 43 mm in Custer and Rau, 44 mm in Lee et al, 41 mm in Park et al, and 33 mm in Bhat (2-4, 17, 18). Thus the variability is around 10% to 20% in different studies.
The same can be observed afterward. From age 1 to 5 years, the length increased rapidly according to Cinaz et al (range, 44-63 mm; Δ 19 mm) and less rapidly in Lee (range, 44-58 mm; Δ 14 mm), while increasing more slowly until puberty in both (3, 10). Differently, in Park and Bhat, the increase proceeded slowly but constantly up to age 5 years (range, 41-52 mm and 33-44 mm, respectively; Δ 11 mm for both) and to the age of puberty (17, 18).
The comparison of studies involving boys followed up to age 18 years showed final measurements comparable at age 17 years both in Tomova et al and Wang and colleagues, with an average of 9.15 cm and 9.07 cm, respectively, despite different ethnicities (Europe or China), but very different from Gabrich et al (a Brazilian study that excluded obese boys), in which the final average PL at age 17 years was 14.3 cm (19-21).
Considering that in our center a large number of children and adolescents with a small penis were also overweight/obese, we developed a new penis measurement method to minimize the risks of error.
We also assessed puberal maturation, according to Tanner, together with hormonal measurement.
During puberty, testosterone levels rise rapidly until reaching adult values.
A profound variability in PL was detected at different stages of sexual development. Therefore, genital development should be evaluated individually according to the child’s current puberal stage, and circulating testosterone should be the main determinant of puberal maturation.
We find that testosterone is directly related to genital development and penile growth both in overweight and normal-weight boys. Interestingly, it has been previously demonstrated that in overweight/obese adult patients testosterone is reduced (22).
In the present study, testosterone levels in obese boys were always significantly lower, and all patients also had a small reduction in testis development, with normal gonadotropin levels. Also, testosterone levels normalized to testes volume were always significantly lower in obese, as compared to normal-weight, boys.
By using our new nonstretching method, avoiding the bias represented by pubic fat accumulation, we compared normal and overweight children and observed that PL was significantly reduced in overweight/obese boys at later stages of puberal development (Fig. 12). We can therefore hypothesize that reduced testosterone affected penis growth during all stages of puberal development. The present data could have been further strengthened by testosterone sampling during minipuberty, which for ethical reasons was not performed, and this is a limitation of this study.
Mogri et al previously found that total testosterone concentrations were 50% lower in adolescent obese boys, consistent with the present study (23).
Based on these results it would be important to understand if penile growth retardation begins early in childhood. In fact, in the period from the third to the fifth month of life, the child undergoes minipuberty, during which testosterone level reaches similar values to the adult for a considerable time (24). Thus, obesity could affect minipuberty, reducing testosterone and PL.
The penis development studies that excluded overweight children showed rapid increases in penile growth in the first 5 years of life and at puberty (3, 21).
Since they were not longitudinal studies, we can only speculate that, in overweight/obese boys, a reduced penis in the first year of life may harbinger a shorter penis at the end of development.
In an attempt to understand this point, an important contribution of our study was to have measured the length with a method suitable for infants and adolescents that avoided the bias represented by the accumulation of pubic fat.
Interestingly, using this new method, obese boys have a reduced lengthening of the penis as compared to normal-weight boys at all stages of puberal development (Fig. 12).
This behavior is consistent with the effect of testosterone on penis growth throughout development.
To put the present and other findings on penis growth in children in a broader perspective, it is known that childhood obesity/metabolic syndrome prevalence have increased dramatically over the last 20 years (25-26). A major driver of the development of type 2 diabetes even among youths is obesity (27-31).
Male hypogonadism is commonly seen in young patients with obesity and in young patients with type 2 diabetes (32, 33). Subnormal free testosterone concentrations were also found in male type 2 diabetes patients, in whom testosterone can be replaced with improvements in insulin resistance and inflammation (34, 35). Furthermore, hypogonadism by itself can worsen obesity (36).
It is noteworthy that testosterone treatment has been shown to improve several components of metabolic syndrome like weight, waist circumference, insulin sensitivity, and glycated hemoglobin A1c levels (37).
Preliminary data on a number of adolescents belonging to this series and followed in recent years suggest that an increase in testosterone levels is possible if weight reduction is achieved.
Abbreviations
- BMI
body mass index
- CDC
US Centers for Disease Control and Prevention
- CI
confidence intervals
- NS
not significant
- P
pubertal stage
- PL
penile length
- WHO
World Health Organization
Acknowledgments
Financial Support: The authors received no financial support for the research, authorship, and/or publication of this article.
Additional Information
Disclosures: The authors have nothing to disclose.
Data Availability
All data sets generated and analyzed during the present study are not publicly available but are available from the corresponding author on reasonable request.
