


Abstract
Myalgia is a common adverse effect of statin therapy, but the underlying mechanism is unknown. Statins may reduce levels of coenzyme Q10 (CoQ10), which is an essential electron carrier in the mitochondrial electron transport system, thereby impairing mitochondrial respiratory function, potentially leading to myalgia.
To investigate whether statin-induced myalgia is coupled to reduced intramuscular CoQ10 concentration and impaired mitochondrial respiratory function.
Patients receiving simvastatin (i.e., statin) therapy (n = 64) were recruited, of whom 25 experienced myalgia (myalgic group) and 39 had no symptoms of myalgia (NS group). Another 20 had untreated high blood cholesterol levels (control group). Blood and muscle samples were obtained. Intramuscular CoQ10 concentration was measured, and mitochondrial respiratory function and reactive oxygen species (ROS) production were measured. Citrate synthase (CS) activity was used as a biomarker of mitochondrial content in skeletal muscle.
Intramuscular CoQ10 concentration was comparable among groups. Mitochondrial complex II–linked respiration was reduced in the statin-myalgic and -NS groups compared with the control group. When mitochondrial respiration was normalized to CS activity, respiration rate was higher in the myalgic group compared with the NS and control groups. Maximal ROS production was similar among groups.
Statin therapy appeared to impair mitochondrial complex-II–linked respiration, but the mitochondrial capacity for complex I+II–linked respiration remained intact. Myalgia was not coupled to reduced intramuscular CoQ10 levels. Intrinsic mitochondrial respiratory capacity was increased with statin-induced myalgia but not accompanied by increased ROS production.
Statin therapy is generally considered safe and well tolerated. However, statin use has been associated with development of adverse effects, including skeletal muscle discomfort, pain, and cramps (myopathies) (1–5) and, in very rare cases, rhabdomyolysis (6). The most common adverse effect associated with statins is myalgia, which is a broad term for muscle pain with or without elevated plasma creatine kinase (CK) levels. CK is a common biomarker for muscle damage, but because it is not a valid biomarker for myalgia, the only method of confirming if myalgia is related to statin therapy is by investigating if the muscle symptoms disappear with treatment cessation and reappear when treatment is reinitiated—a method that is time consuming and not practical in a clinical setting.
Though statin-induced myalgia is well recognized as an adverse effect of statin therapy, the underlying mechanism is unclear. Inhibition of 3-hydroxy-3-methyl-glutaryl-coenzyme A by statins reduces flow through the mevalonate pathway, which results in reduced synthesis of cholesterol. Because coenzyme Q10 (CoQ10), like cholesterol, is an end product of the mevalonate pathway, it is likely that statin therapy reduces synthesis of CoQ10. In the early 1990s, a few case reports suggested an association between statin therapy, low muscle CoQ10 levels, and myalgia. One case report described a statin-myalgic patient whose symptoms of pain diminished after oral CoQ10 supplementation (7) and another study reported low plasma CoQ10 levels after statin (namely, lovastatin) treatment (7, 8). Low muscle CoQ10 levels were found in two sisters who suffered from muscle fatigue (9) and, in 1993, a case report described a statin treated patient who developed rhabdomyolysis that was reversed after oral CoQ10 supplementation. A muscle biopsy specimen from this patient revealed low muscle CoQ10 levels, ragged red muscle fibers, and pleomorphic mitochondria (10). Since then, CoQ10 was proposed to have a role in the pathogenesis of statin-induced myalgia, but this has not been confirmed in larger clinical trials (10).
Because CoQ10 is an essential electron carrier in the mitochondrial electron transport system, reduced CoQ10 levels may impair mitochondrial respiratory function. Mitochondria exist in a tightly regulated network that is highly plastic and involved in regulation of several metabolic and cellular processes. Impairment of mitochondrial functions, including oxidative phosphorylation, ATP production, ROS production, and apoptotic signaling, has been associated with chronic muscle pain (11, 12). A causal relationship between mitochondria and nociceptor activation is poorly established, but mitochondrial dysfunction has been determined to play a critical role in neuropathic and inflammatory pain (13). Moreover, though relatively unexplored, mitochondrial dysfunction has been associated with calcium imbalance, muscle cramps, and activation of sensory receptors in the cytoskeleton (11).
Statin therapy has been associated with impaired mitochondrial plasticity (14) and impairment of several mitochondrial functions, including, reduced mitochondrial biogenesis (15) and content (mitochondrial DNA) (16), increased mitochondrial ROS production, and reduced antioxidant capacity (15) and calcium buffering (17). Impaired calcium buffering has been associated with induction of apoptosis by activation of caspases, and statin use has been associated with reduced amount of the antiapoptosis protein B-cell lymphoma 2 (Bcl-2) (17). We conducted a large cross-sectional study to investigate if statin-induced myalgia is associated with impaired mitochondrial respiratory function and related to reduced muscle CoQ10 levels.
Methods
This study is part of the LIFESTAT (Living With Statins) study (18) (ClinicalTrials.gov Identifier: NCT02255682), approved by the local ethics committee in Frederiksberg, Copenhagen (protocol no.: H-2-2013-164). The study was completed in accordance with the Helsinki Declaration and all participants were informed of possible risks associated with participation before they signed a written consent form and enrolled in the study.
Recruitment
Men and women in primary prevention with simvastatin 40 mg/d were recruited by advertisements in local media, local pharmacies, and offices of local general practitioners. The recruitment process is illustrated in Fig. 1; it was started in the beginning of 2014 and ended in 2016. Inclusion criteria were age 40 to 70 years and body mass index 25 to 35 kg/m2. The control group was recruited using similar inclusion criteria but with total blood cholesterol and/or low-density lipoprotein (LDL) cholesterol levels of >6.0 mmol/L or >3.5 mmol/L, respectively; and receiving no current lipid-lowering treatment. Medical history and a resting ECG were obtained. Exclusion criteria for both groups were history of cardiac events, diabetes, thyroid diseases, current use of medication metabolized by cytochrome P450 3A4, and β-blockers. The participants in simvastatin treatment were allocated to myalgic or nonsymptomatic (NS) groups according to their own perception of myalgia. With a standardized question, all participants were asked to score the intensity of their myalgia on a 10-cm visual analog scale (VAS) (19, 20). During the screening interview, participants were asked to describe any muscle discomfort, pain, or cramps and if the symptoms of myalgia appeared to be in relation to statin therapy. On a separate day, participants received a questionnaire with detailed questions regarding duration of statin therapy and symptoms of myalgia.
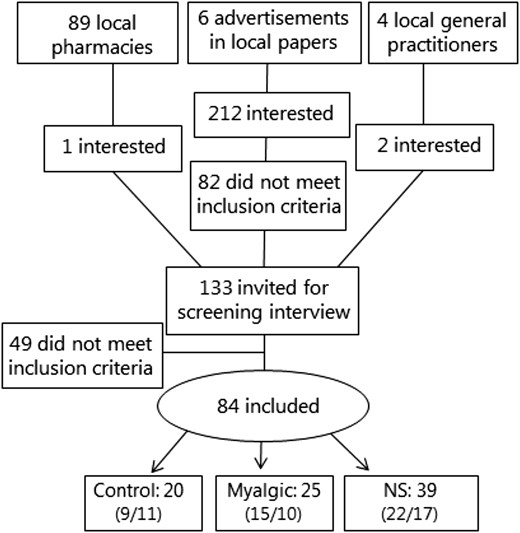
Flow diagram of the recruitment process. Numbers of men and women are given in parentheses in that order. Pharmacies handed out advertisements along with statin medications, and the general practitioners agreed to refer anyone interested and eligible for enrollment in the control group.
Protocol
All participants underwent 3 days of testing within 14 days. The test days were separated by at least 72 hours. On all test days, participants reported to the laboratory at 8:00 am after an overnight fast (from 10:00 pm), but water intake was allowed. On test day 1, body composition was measured with dual-energy X-ray absorptiometry (DXA) scan (Lunar iDXA Series; GE Medical Systems, Madison, WI), and blood pressure was measured using an automatic device while participants were supine (Omron M7; Omron Healthcare, Kyoto, Japan). The first measurement was discarded and an average of the following two was used. Maximal oxygen consumption (Vo2max) was determined on an ergometer bike using an online gas exchange system (Cosmed, Rome, Italy). On test day 2, the Vo2max test was repeated and the highest achieved Vo2max was used. On test day 3, blood samples were collected in heparin-coated vacutainers and plasma was stored at −80°C until analyzed. After blood sampling, biopsy specimens were obtained from the vastus lateralis muscle using the Bergstrom needle technique modified for suction (21) under local anesthesia (lidocaine 5%). Approximately 40 mg of the muscle tissue was placed in cooled biopsy-specimen preservation solution [Biops; 100 mM CaK2EGTA, 100 mM K2EGTA, 5.77 mM Na2ATP, 6.56 mM MgCl2 6H2O, 20 mM taurine, 15 mM Na2 phosphocreatine, 20 mM imidazole, 0.5 mM dithiothreitol, and 50 mM 2-(N-morpholino)ethanesulfonic acid] for measurements of mitochondrial respiration, and approximately 10 mg was placed in Buffer X (60 mM potassium salt 2-(N-morpholino)ethanesulfonic acid, 35 mM KCl, 7.23 mM K2EGTA, 2.77 mM CaK2EGTA, 20 mM imidazole, 0.5 mM dithiothreitol, 20 mM taurine, 5.7 mM Na2ATP, 15 mM Na2 phosphocreatine, 6.56 mM MgCl2·6H2O, and H2O) for measurement of hydrogen peroxide (H2O2) production.
Mitochondrial respiration and H2O2 production
Measurements of mitochondrial respiration and H2O2 production were done in saponin-permeabilized (50 µg/mL) muscle fibers in duplicate with hyperoxygenation, as previously described (22–24). The four protocols were as follows: Protocol 1 (mitochondrial respiration) used malate 2 mM, glutamate 10 mM, and pyruvate 5 mM, MgCl2 3 mM, ADP titration (0.05, 0.25, 1.00, and 5.00 mM), rotenone 0.5 µM, succinate 10 mM (complex II–linked respiration), and antimycin A 2.5 µM. Protocol 2 (mitochondrial respiration) used malate 2 mM, glutamate 10 mM, pyruvate 5 mM, ADP 5 mM, and MgCl2 3 mM (complex I–linked respiration), succinate 10 mM (complex I–linked respiration plus complex II–linked respiration), carbonyl cyanide-p-trifluoromethoxyphenylhydrazone titration (0.25 µM steps until respiration declined; electron transport system capacity). Protocol 3 (mitochondrial respiration) used blebbistatin 25 µM (25), malate 2 mM, ADP 5 mM, and MgCl2 3 mM, palmitoyl carnitine in two steps (50 µM and 100 µM) (electron-transferring flavoprotein). Protocol 4 (mitochondrial H2O2 production) used Amplex red (50 µM), superoxide dismutase (SOD; 90 U/mL), blebbistatin (25 µM), and horseradish peroxidase (12 U/mL), malate 2 mM, pyruvate 5 mM, succinate (1, 3, and 10 mM), MgCl2 3 mM, ADP 5 mM, and myxothiazol 5 µM (complex III inhibitor). Cytochrome C was added after ADP to establish integrity of the outer mitochondrial membrane.
CoQ10 concentration (plasma and intramuscular)
Intramuscular CoQ10 concentration was measured by HPLC-ultraviolet (Shimadzu, Kyoto, Japan), as described elsewhere (26). In brief, 40 to 50 mg of frozen muscle tissue was homogenized with butylated hydroxytouluene (1 mL of 0.5 mg/mL), then 2 mL of ethanol was added to the sample and vortex mixed for 30 seconds. Subsequently, 2 mL of hexane was added and then vortex mixed for several minutes. After centrifugation, the hexane phase was transferred to another vial. The hexane extraction was repeated and the extracts were evaporated and stored at −80°C. The samples were resuspended in 150 µL of the mobile phase (ratio of methanol to ethanol, 70:30) immediately before the HPLC analysis. Plasma CoQ10 concentration was measured by HPLC using a commercially available kit (Chromsystems Instruments & Chemicals, Munich, Germany). An internal standard was measured with all samples and a known calibrator was measured every day before and after running the actual samples.
Spectrophotometric analyses
Spectrophotometric analyses were performed to determine concentrations of the following: in plasma: glucose, lipids (total cholesterol, high-density lipoprotein cholesterol, LDL, triglycerides, alanine aminotransferase, aspartate aminotransferase, and CK; in muscle tissue: citrate synthase (CS) and β-hydroxy acyl-CoA dehydrogenase activity was analyzed as previously described (27).
Western blotting
Western blotting of catalase, manganese SOD (mnSOD), vascular endothelial growth factor, caspase-3, and Bcl-2 was performed. In brief, 15 µg of protein from each sample was loaded on 12% and 18% Criterion TGX Stain-Free polyacrylamide sodium dodecyl sulfate gels (Criterion; Bio-Rad, Copenhagen, Denmark) with a molecular weight marker (1 µL of Magicmark, XP Western Protein Standard; Thermo Fisher Scientific, Waltham, MA) and a rainbow marker (2 µL High-Range Rainbow molecular weight marker; Thermo Fisher Scientific). A calibrator sample was made of tissue from a healthy subject and loaded in three lanes on all gels. Protein was transferred to polyvinylidene fluoride membranes by Trans-Blot Turbo RTA Midi Transfer Packs (Trans-Blot Turbo Transfer System; Bio-Rad, Copenhagen, Denmark), and an ultraviolet picture of the membrane was taken for determination of protein content loaded. The polyvinylidene fluoride membranes were blocked with milk and incubated in primary antibody [anti-mnSOD (catalog no. 06-984; Millipore, Burlington, MA); anti-catalase (RnDSystems, Minneapolis, MN); anticaspase-3 (catalog no. 9662; Cell Signaling Technology, Danvers, MA); anti-Bcl-2 (catalog no. 4223; Cell Signaling Technology); and anti–vascular endothelial growth factor (catalog no. ab46154; Abcam, Cambridge, UK) overnight. Secondary antibodies were polyclonal goat anti-rabbit horseradish peroxidase conjugated (DAKO, Glostrup, Denmark). Intensity of each blot was normalized to total protein, which was measured by stain-free fluorescence before incubating with primary antibody. All samples were quantified relative to the average of the three calibrators loaded on each gel, to allow comparison of samples loaded on different gels.
Statistics
Statistical analysis was done with SigmaPlot 13 (Systat Software, San Jose, CA). One-way ANOVA was used to determine differences between groups without adjusting for sex. Two-way ANOVA for repeated measures was used to calculate group differences in mitochondrial respiration and ROS production. Holm Sidak was used as a post hoc test. If normality and equal variance tests failed, the data were transformed and reanalyzed. Pearson correlation analysis was performed to establish the presence of correlations. GraphPad Prism 7 (La Jolla, CA) was used to create graphs. Data are presented as mean ± SEM and statistical significance was set at P < 0.05. Power calculations were done before the study was initiated. Variation in mitochondrial functional measurements from previous studies from our laboratory was used in these calculations.
Results
Participants’ characteristics are presented in Table 1. No difference was observed in age, BMI, fat percentage, systolic or diastolic blood pressure, Vo2max, or levels of CK, alanine aminotransferase, aspartate aminotransferase, high-density lipoprotein cholesterol, triglycerides, glucose, or HbA1c among the three groups. Total cholesterol and LDL levels were higher in the control group compared with both simvastatin-treated groups. As expected, the VAS score was higher in the myalgic group compared with NS and control groups, and total cholesterol and LDL levels were higher in the control group compared with the myalgic and NS groups (Table 1).
Participants’ Characteristics
| Control | NS | Myalgic | |
|---|---|---|---|
| No. of participants (male/female) | 20 (9/11) | 39 (22/17) | 25 (15/10) |
| Age, y | 60 ± 2 | 63 ± 1 | 61 ± 1 |
| BMI, kg/m2 | 28 ± 1 | 28 ± 1 | 29 ± 1 |
| Lean body mass, kg | 53 ± 2 | 53 ± 2 | 56 ± 2 |
| Fat, % | 37 ± 2 | 35 ± 1 | 36 ± 2 |
| Vo2max, mL O2/min/kg) | 29 ± 1 | 28 ± 1 | 27 ± 1 |
| Systolic blood pressure, mm Hg | 132 ± 4 | 138 ± 2 | 134 ± 3 |
| Diastolic blood pressure, mm Hg | 84 ± 2 | 86 ± 1 | 82 ± 2 |
| Myalgiaa | 0 (0–2.3) | 0 (0–1) | 5 (2.3–7)b |
| Duration of statin therapy, no. of mo | |||
| 3–6 | — | 1 | 1 |
| 6–12 | — | 1 | 2 |
| >12 | — | 37 | 22 |
| Blood analysis | |||
| CK, U/L | 170 ± 52 | 110 ± 9 | 116 ± 15 |
| CoQ10 (µg/L) | 868 ± 63 | 846 ± 28 | 882 ± 15 |
| ALAT, U/L | 22 ± 2 | 27 ± 2 | 23 ± 1 |
| ASAT, U/L | 25 ± 2 | 30 ± 2 | 26 ± 1 |
| Total cholesterol, mmol/L | 5.9 ± 0.2b | 4.1 ± 0.1 | 4.3 ± 0.1 |
| HDL, mmol/L | 1.5 ± 0.1 | 1.5 ± 0.1 | 1.5 ± 0.1 |
| LDL, mmol/L | 4.2 ± 0.2b | 2.4 ± 0.1 | 2.5 ± 0.1 |
| Triglycerides, mmol/L | 1.5 ± 0.2 | 1.0 ± 0.1 | 1.4 ± 0.2 |
| Glucose, mmol/L | 6.0 ± 0.1 | 6.2 ± 0.1 | 6.3 ± 0.2 |
| HbA1c, % | 5.54 ± 0.06 | 5.52 ± 0.05 | 5.58 ± 0.05 |
Data are reported as mean ± SEM, except VAS data, which are reported as medians with 25%–75% confidence limits in parentheses.
Abbreviations: ALAT, alanine transaminase; ASAT, aspartate transaminase; HDL, high-density lipoprotein; HbA1c, glycosylated hemoglobin.
As measured by VAS (cm).
P < 0.001, different from the other two groups.
The intramuscular as well as plasma CoQ10 concentrations were comparable among groups (Table 1; Fig. 2). The mitochondrial complex II–linked respiration was lower in the myalgic and NS groups compared with the control participants (Fig. 3a), and cytochrome-c addition had no impact on mitochondrial respiration (data not shown). Activity of β-hydroxy acyl-CoA dehydrogenase and CS activity were comparable among groups (Fig. 3b). Intrinsic mitochondrial respiratory capacity (respiration rate normalized to CS activity as a biomarker for mitochondrial content) was higher in the myalgic group compared with NS and control participants (Fig. 3c), but not with lipid-stimulated respiration (electron-transferring flavoprotein). Maximal ROS production and maximal ROS production normalized to mitochondrial respiration rate (oxygen flux) were comparable among groups, though there was a tendency (P = 0.097) toward a lower maximal ROS production in the NS group compared with control group (Fig. 3d).
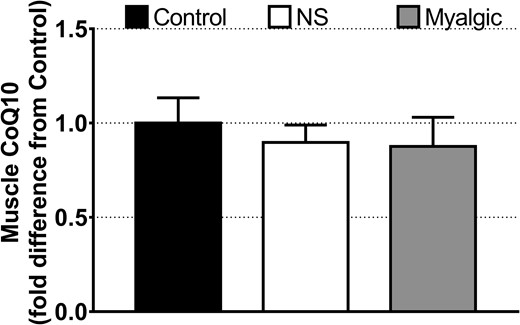
Intramuscular CoQ10 concentration expressed as fold difference from control. Data are reported as mean ± SEM. Error bars on the bar reporting control group data are SEM of fold difference from the group mean. Control group, n = 13; NS group, n = 25; myalgic group, n = 24.
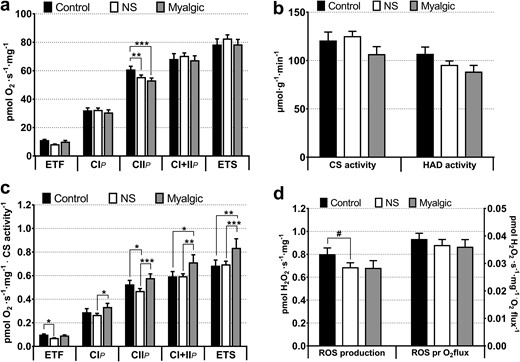
(a) Mitochondrial respiratory capacity in skeletal muscle. From protocols 1–3: control group, n = 17; NS group, n = 39; myalgic group, n = 23. ETF: control group, n = 17; NS group, n = 24; myalgic group, n = 9. (b) Activity of CS (marker of mitochondrial content) and β-hydroxy acyl-CoA dehydrogenase (marker of β-oxidation capacity). Control group, n = 14; NS group, n = 36; myalgic group, n = 21. (c) Mitochondrial intrinsic respiratory capacities (from protocols 1–3). Oxygen flux rates are normalized to mitochondrial content (CS activity). Control group, n = 14; NS group, n = 36; myalgic group, n = 20. (d) Maximal ROS production with oxygen flux through mitochondrial complex I and II (protocol 4). Control group, n = 15; NS group, n = 32; myalgic group, n = 12). CIP, complex I–linked respiration; CIIP, complex II–linked respiration; CI+IIP, complex I+II–linked respiration; ETF, electron-transferring flavoprotein (lipid oxidation with 50 µM palmitoyl carnitine). ETS, electron transport system capacity, maximal uncoupled respiration; HAD, β-hydroxy acyl-CoA dehydrogenase; ROS pr O2flux, maximal H2O2 production normalized to oxygen consumption (pmol O2/s/mg) at the same substrate combination.*P < 0.05; **P < 0.01; ***P < 0.001; #P < 0.1.
The statin myalgic group had a borderline (P = 0.056) higher abundance of catalase than the NS group, but there were no differences in mnSOD or in expression of proapoptotic protein caspase-3 or antiapoptotic Bcl-2 (Fig. 4).
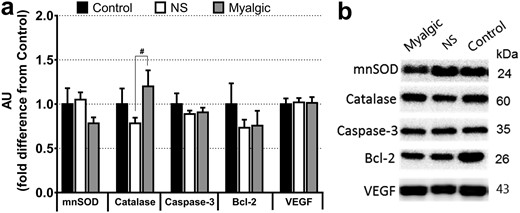
Protein abundance measured by western blotting. (a) Data are expressed as fold difference from the control group. Data are reported as mean ± SEM; error bars on the control group bar are the SEM of the group mean. AU, arbitrary units; VEGF, vascular endothelial growth factor. #P < 0.1. (b) Representative blots from one person per group. Control group, n = 13; NS group, n = 36, myalgic group, n = 19.
No correlation was found between CoQ10 in plasma and skeletal muscle (r = 0.0443; P = 0.744; correlation not shown).
Discussion
The main finding of the study is that statin therapy is associated with reduced mitochondrial complex II–linked respiration, and statin-induced myalgia is coupled to an increased intrinsic mitochondrial respiratory function, whereas intramuscular CoQ10 levels are unaltered. Statin-induced myalgia was not associated with impaired capacity for oxidative phosphorylation, ROS production, or apoptosis signaling.
Mitochondrial complex II–linked respiration was reduced in both statin-exposed groups compared with the unexposed controls. It has been reported that complex I– and II–linked respiration was reduced in statin-treated patients (28). However, in the current study, there were no differences in mitochondrial respiratory capacity when electrons were fed through complex I and complex II simultaneously. This suggests that statin therapy specifically affects complex II of the electron transport system, but that the mitochondria can compensate for this, possibly by increasing electron flow through complex I when both complexes are stimulated. Because mitochondria physiologically are stimulated by electron flow through both complex I and II, the clinical relevance of a reduced capacity of complex II is currently unknown. Because the complex II–linked respiration was comparable in the statin-myalgic and NS groups, our results suggest impaired complex II–linked respiration is not directly involved in the pathophysiology of statin-induced myalgia. Moreover, the comparable mitochondrial respiratory capacity and CS activity in the groups indicate that the muscular capacity for oxidative phosphorylation and ATP production are not reduced in statin-myalgic patients.
Interestingly, when individual respiratory capacities were normalized to corresponding CS activities (intrinsic mitochondrial respiratory capacity) there was a significant higher intrinsic capacity in the statin-myalgic group. To our knowledge, this has not been reported before. It has been reported that a training intervention decreases the intrinsic respiratory capacity of the mitochondria (29). Statins have been associated with impaired mitochondrial plasticity (14), and dysregulation of the mitochondrial network, resulting in enlarged individual mitochondria (30, 31). Moreover, the mevalonate pathway, which statins target, has a central role in regulation of the mitochondrial network morphology (30). Therefore, an increased intrinsic mitochondrial capacity could be a result of fewer enlarged mitochondria, as a consequence of disruption of the mitochondrial network, but additional studies are warranted to establish if a causal relationship exists.
The muscle CoQ10 levels were comparable among groups in the current study, indicating that CoQ10 is not associated with statin treatment and the development of myalgia. The few studies that have investigated the association between statins and muscle CoQ10 levels have yielded conflicting results (32–34). The comparable CoQ10 levels in the current study were unexpected because CoQ10 is synthesized downstream of 3-hydroxy-3-methyl-glutaryl-coenzyme A, which is inhibited by statins. It is, however, worth considering the possibility that the uptake of dietary CoQ10 has increased to compensate for a decreased endogenous synthesis. The similar CoQ10 levels fit well with the comparable ROS production and protein expression of antioxidants, which indicates that electron flow through the electron transport system is not impaired. The plasma CoQ10 levels were comparable among groups and did not correlate with muscle CoQ10 content, and the lack of correlation between plasma and muscle CoQ10 content is in line with findings of a previous study (33).
Reduced levels of the antiapoptosis protein Bcl-2 have been suggested to play a role in statin-induced myalgia (17), but such a role is not supported by our study findings. Moreover, we report comparable protein caspase-3 levels, which also suggests that statin-induced myalgia is not associated with mitochondrial-induced apoptosis signaling. It is possible, however, that activity of caspase-3 is increased despite similar protein levels.
Strengths and limitations
Two strengths of the current study are the number of participants investigated and that CoQ10 was measured in the skeletal muscle in combination with the different mitochondrial measurements (i.e., respiration and ROS production). Limitations of the study include, of course, the cross-sectional design and that we were not able to control if the simvastatin-treated patients in the two treated groups took their medication, and if medication compliance differed between the two treatment groups. The presence of myalgia was evaluated using the VAS scale, which is based on a subjective experience of pain and, therefore, is a limitation. To investigate if myalgia is related to statin therapy, statin treatment should be stopped to see if muscle symptoms disappear and reappear when treatment is started again.
In conclusion, the findings of this study suggest statin therapy is associated with reduced complex II–linked respiration, and statin-induced myalgia is associated with an increased mitochondrial intrinsic respiratory capacity that is not related to reduced muscle CoQ10 levels. Though it was beyond the scope of this paper to elucidate the mechanism behind the increased intrinsic mitochondrial respiratory capacity, we speculate it is a consequence of impaired plasticity of the mitochondrial network. Additional research is necessary to elucidate if the mitochondrial adaptations are causal or contributory to the development of statin-induced myalgia.
Abbreviations:
- Bcl-2
B-cell lymphoma 2
- BMI
body mass index
- CK
creatine kinase
- CoQ10
coenzyme Q10
- CS
citrate synthase
- H2O2
hydrogen peroxide
- LDL
low-density lipoprotein
- mnSOD
manganese superoxide dismutase
- NS
nonsymptomatic
- ROS
reactive oxygen species
- SOD
superoxide dismutase
- VAS
visual analog scale
- Vo2max
maximal oxygen consumption
Acknowledgments
We thank Regitze Kraunsøe, Jeppe Bach, and Christina Neigaard Hansen for their excellent technical assistance; Mimmi Marie Torp, Tine Juul Monberg, Ronni Sahl, Maria Dahl, Maria Hansen, Bo Kelly, Magnus Asping, and Lise Bluhme Mikkelsen for assisting with recruitment and testing of participants; and Elif Dik for assisting with dissection of muscle biopsy specimens. We acknowledge and thank the local pharmacies and local general practitioners who were willing to participate in recruitment of participants. We thank all the participants who volunteered.
Financial Support: This study was funded by the Nordea Foundation, the University of Copenhagen 2016 Center of Excellence grant (to F.D.), and The Danish Council for Independent Research (Grant 4092-00247A to S.L.).
Clinical Trial Information: ClinicalTrials.gov no. NCT02255682 (registered 2 October 2014).
Author Contributions: T.L.D., T.M., A.B.K., J.W.H., F.D., and S.L. contributed to the study design. T.L.D., T.M., A.B.K., K.M.C., and S.L. contributed to the data acquisition and analysis. T.L.D. and S.L. contributed in the data interpretation. All authors made critical revision and gave final approval of the version to be published. S.L. takes responsibility for all aspects of the reliability of the data presented.
Disclosure Summary: The authors have nothing to disclose.
