


Abstract
Risk scores for cardiovascular and mortality outcomes have not been commonly applied in Chinese populations.
To develop and externally validate a set of parsimonious risk scores [University of Hong Kong-Singapore (HKU-SG)] to predict the risk of mortality, cerebrovascular disease, and ischemic heart disease among Chinese people with type 2 diabetes and compare HKU-SG risk scores to other existing ones.
Retrospective population-based cohorts drawn from Hong Kong Hospital Authority health records from 2006 to 2014 for development and Singapore Ministry of Health records from 2008 to 2016 for validation. Separate five-year risk scores were derived using Cox proportional hazards models for each outcome.
Study participants were adults with type 2 diabetes aged 20 years or over, consisting of 678,750 participants from Hong Kong and 386,425 participants from Singapore.
Performance was evaluated by discrimination (Harrell C-index), and calibration plots comparing predicted against observed risks.
All models had fair external discrimination. Among the risk scores for the diabetes population, ethnic-specific risk scores (HKU-SG and Joint Asia Diabetes Evaluation) performed better than UK Prospective Diabetes Study and Risk Equations for Complications Of type 2 Diabetes models. External validation of the HKU-SG risk scores for mortality, cerebrovascular disease, and ischemic heart disease had corresponding C-indices of 0.778, 0.695, and 0.644. The HKU-SG models appeared well calibrated on visual plots, with predicted risks closely matching observed risks.
The HKU-SG risk scores were developed and externally validated in two large Chinese population-based cohorts. The parsimonious use of clinical predictors compared with previous risk scores could allow wider implementation of risk estimation in diverse Chinese settings.
Diabetes increases the risk of many diseases including cardiovascular disease, renal disease, and cancer and ultimately leads to premature mortality. Life expectancy of people with diabetes in China is estimated to be 8 to 10 years shorter than that of people without diabetes (1). Predicting the absolute risk of adverse outcomes can guide decision-making for individuals and populations. Risk prediction models can also be used to assess the cost effectiveness of different disease management options and the performance of treatment pathways, particularly when there are incomplete data on outcomes, or when the outcomes need to be extrapolated into the future (2).
The risk of mortality and cardiovascular outcomes of people with type 2 diabetes has been assessed by the UK Prospective Diabetes Study (UKPDS), the Joint Asia Diabetes Evaluation (JADE), and the Risk Equations for Complications Of type 2 Diabetes (RECODe) risk scores based on cohorts from 1977 to 1991, 1995 to 2005, and 2001 to 2009, respectively (3–8). Newer versions of the UKPDS models using data from the original cohorts have also been published (UKPDS 82: Outcomes Model 2) (9). However, improvements in medical care, lifestyles, and socioeconomic development in the intervening years may have influenced patient outcomes. The UKPDS and RECODe derivation data did not include Chinese participants. The older UKPDS scores (UKPDS 56 and 60) are known to inflate the observed risk among Chinese people with diabetes, whereas the newer version (UKPDS 82) and the RECODe scores have not yet been validated in Chinese populations (6, 7). The JADE score for Hong Kong Chinese was based on only 7000 participants with a low number of events. Both the JADE and RECODe scores require more sophisticated laboratory data such as the urinary albumin/creatinine ratio that can limit general deployment across different settings, especially in resource-poor conditions.
To address this gap for Chinese patients with diabetes, we sought to develop and internally validate a model (HKU risk score) on a large population-based cohort of Chinese patients with diabetes in Hong Kong, and to externally validate a more parsimonious model (HKU-SG risk score) in a large population-based Singapore cohort. We compared the performance of our newly developed algorithms with the existing UKPDS, RECODe, and JADE risk scores.
Methods
Setting
We used the Hong Kong Hospital Authority’s electronic health records (Clinical Management System) to identify all people with diabetes in the public health care system from 1 January 2006 to 31 December 2014. Data for Singapore were obtained from Ministry of Health administrative datasets covering 1 January 2008 to 31 December 2016. We identified 678,750 participants in the Hong Kong derivation cohort and 386,425 participants in the Singaporean validation cohort as aged 20 years or over with a confirmed diagnosis of type 2 diabetes. Detailed description of the data sources and case identification of type 2 diabetes can be found in an online repository (10).
Outcomes
Deaths were recorded by the relevant government immigration department cross-referenced by Hong Kong or Singapore identity card numbers. Participants were censored on the cohort end date of 31 December 2014 for Hong Kong and 31 December 2016 for Singapore. We used the following diagnosis codes in admission and attendance records to ascertain ischemic heart disease [International Classification of Disease, 9th revision (ICD-9) codes: 410-414 and International Classification of Primary Care codes: K74-K76] (3, 7), and cerebrovascular disease (ICD-9 codes: 430-434, 436, and International Classification of Primary Care code: K90) (4, 6). Thus, ischemic heart disease includes myocardial infarction, angina pectoris, coronary atherosclerosis, and aneurysms, whereas cerebrovascular disease includes intracranial hemorrhages (e.g., subarachnoid, intracerebral) and occlusion of cerebral arteries. For the derivation of ischemic heart disease and cerebrovascular disease models, we excluded participants with a previous episode of ischemic heart disease or cerebrovascular disease, respectively.
Predictors
For each participant, we determined the cohort entry date as the later of date of diabetes diagnosis or study start date (1 January 2006 for Hong Kong participants and 1 January 2008 for the Singapore participants, respectively). Candidate predictors were selected based on data availability, clinical relevance, and variables included in other risk models such as the UKPDS, JADE, and RECODe models (10). Clinical values were defined as the closest recorded value within two years of cohort entry date and are provided in on online repository (10). All other predictor variables were based on the latest recorded information at baseline. The duration of diabetes was defined as the time from diagnosis until cohort entry, so an individual has a duration of six years if diagnosed in the year 2000 and a duration of zero years if diagnosed in 2006 or later. Chronic kidney disease was defined by ICD-9 codes 585-587, including chronic kidney disease (585), renal failure (586), and renal sclerosis (587). We did not include time-varying covariates as the risk models are intended to be used for initial assessment at baseline. The distribution of missing values is detailed in an online repository (10). We applied multiple imputation to handle missing values in both the derivation and validation cohorts by imputing five datasets using the R rms package. The regression-based imputation model included the candidate predictors, an interaction term between age and duration of diabetes, the Nelson-Aalen estimator, and the event indicator.
Statistical models
We developed the HKU and HKU-SG risk scores using the full data of the Hong Kong cohort. To account for nonlinearity, we transformed the continuous variables using restricted cubic splines with four knots placed at the respective 5th, 35th, 65th, and 95th sample percentiles (11). We derived separate Cox proportional hazard models for predicting all-cause mortality, ischemic heart disease, and cerebrovascular disease at five years. For each outcome, we fitted a Cox proportional hazard model including all candidate predictors (full model), which was then approximated and blinded for the outcome into a more parsimonious model of the most predictive variables (HKU risk score). We assigned the full model a R2 value of 1.0 by design and then excluded candidate variables using a backward elimination algorithm (ordinary least squares model in which the estimated linear predictor from the full model was the outcome and all candidate variables were entered in exactly the same manner as in the full model) to achieve an arbitrary level of R2 > 0.95 for the HKU risk score (11). This method has been outlined by Harrell and applied in the development of other risk scores (12). We tested for interaction terms between age and duration of diabetes, age and sex, age and smoking, and sex and smoking, which did not improve model performance and were thus dropped from the final models. The final predictor variables included in the HKU risk scores are age, duration of diabetes, sex, smoking status, HbA1c, total and high-density lipoprotein-cholesterol, blood pressure, creatinine, Hb, white cell count, resting heart rate, preexisting conditions (cancer, congestive heart failure, diabetes complications), and medication for diabetes, hypertension, and statins (10). To allow for wider applicability of the risk score to different clinical settings with more limited data availability, we then developed the HKU-SG risk scores including all predictors common to both the Hong Kong and Singapore datasets: age, duration of diabetes, sex, smoking status, body mass index, systolic and diastolic blood pressure, HbA1c, low-density lipoprotein-cholesterol, preexisting conditions (atrial fibrillation and chronic kidney disease).
Internal and external validation
Discrimination was assessed by Harrell C-index (an extension of the receiver operating characteristic statistic to survival data ranging from 0 to 1, where higher values indicate better performance) (11). Each risk model was internally validated using 100 bootstrap samples (13, 14). We used the Singapore dataset to externally validate the HKU-SG models. We applied the UKPDS, RECODe, and JADE risk scores on the Hong Kong dataset to assess validity but were unable to validate on the Singaporean dataset because of lack of certain data variables. We assessed calibration by comparing the observed five-year event rates with the risk score predictions, and plotted the mean predicted five-year probability of events by percentile against the observed event rate. To test sensitivity to missing data, we repeated the validation using complete case analysis. We also analyzed a subset of Chinese ethnicity within the Singapore validation cohort.
All analyses were carried out using R version 3.4 (R Foundation for Statistical Computing) with the rms and Hmisc packages (11). The analyses followed the framework for derivation and validation of prediction models proposed by Harrell (11) and Royston and Altman (15) and reported in accordance with the Transparent Reporting of a Multivariable Prediction Model for Individual Prognosis or Diagnosis (TRIPOD) statement (16). The study was approved by the institutional review boards of all seven Hospital Authority clusters in Hong Kong.
Results
Baseline characteristics of the Hong Kong and Singapore study samples are shown in Table 1. The HKU and HKU-SG risk scores were developed from the Hong Kong cohort of 4,294,018 person-years for mortality, 3,868,798 person-years for cerebrovascular disease, and 3,741,576 for ischemic heart disease. During a mean follow-up of 6.3 years, 143,047 of 678,750 (21.1%) participants died. After excluding participants with previous history of cerebrovascular disease and ischemic heart disease, respectively, 43,215 of 623,294 (6.9%) participants developed cerebrovascular and 54,365 of 610,647 (8.9%) participants developed ischemic heart disease during follow-up. Mean follow-up time was similar for the Hong Kong derivation and Singapore validation cohort. A flow diagram outlining the cohort selection can be found in an online repository (10). Predictors included in the final HKU and HKU-SG 5-year risk scores are provided, with the hazard ratio of each variable, are provided in an online repository (10). To predict individual risk scores, the final models are presented as an interactive Web tool for ease of use (https://jquan.shinyapps.io/riskmodel). The full equations for the risk models can be found in an online repository (10).
Baseline Characteristics of Study Participants
| Mortality | Cerebrovascular Disease | Ischemic Heart Disease | ||||||||||
|---|---|---|---|---|---|---|---|---|---|---|---|---|
| Characteristics | Hong Kong | Singapore | Hong Kong | Singapore | Hong Kong | Singapore | ||||||
| N | 678,750 | 386,425 | 623,294 | 345,303 | 610,647 | 304,362 | ||||||
| No. of outcome events, n (%) | 143,047 | (21.1) | 58,906 | (15.2) | 43,215 | (6.9) | 24,177 | (7.0) | 54,365 | (8.9) | 35,391 | (11.6) |
| Follow-up time, y, mean (SD) | 6.3 | (3.3) | 6.1 | (2.9) | 6.2 | (3.3) | 6.0 | (2.9) | 6.1 | (3.3) | 5.7 | (3.0) |
| Total follow-up time, person-years | 4,294,018 | — | 2,363,508 | — | 3,868,798 | — | 2,055,127 | — | 3,741,576 | — | 1,747,518 | — |
| Age, y, mean (SD) | 63.6 | (13.6) | 60.8 | (13.1) | 62.8 | (13.5) | 59.9 | (12.9) | 62.8 | (13.5) | 59.2 | (12.9) |
| 20–49 | 104,502 | (15.4) | 73,333 | (19.0) | 102,485 | (16.4) | 70,868 | (20.5) | 101,713 | (16.7) | 67,248 | (22.1) |
| 50–59 | 163,753 | (24.1) | 106,255 | (27.5) | 157,705 | (25.3) | 98,941 | (28.7) | 154,714 | (25.3) | 88,942 | (29.2) |
| 60–69 | 166,114 | (24.5) | 106,658 | (27.6) | 154,747 | (24.8) | 94,938 | (27.5) | 150,638 | (24.7) | 82,626 | (27.1) |
| 70–79 | 157,229 | (23.2) | 69,032 | (17.9) | 138,008 | (22.1) | 57,415 | (16.6) | 134,069 | (22.0) | 46,951 | (15.4) |
| 80+ | 87,152 | (12.8) | 31,147 | (8.1) | 70,349 | (11.3) | 23,141 | (6.7) | 69,513 | (11.4) | 18,595 | (6.1) |
| Female, n (%) | 337,523 | (49.7) | 187,921 | (48.6) | 311,285 | (49.9) | 168,826 | (48.9) | 309,588 | (50.7) | 155,991 | (51.3) |
| Chinese ethnicity, n (%) | —a | —a | 245,791 | (63.6) | —a | —a | 218,175 | (63.2) | —a | —a | 198,123 | (65.1) |
| Duration of DM, y, mean (SD) | 3.8 | (6.3) | 1.4 | (2.3) | 3.6 | (6.2) | 1.3 | (2.2) | 3.6 | (6.1) | 1.1 | (2.0) |
| Current smoker, n (%) | 76,638 | (11.0) | 24,892 | (6.0) | 71,122 | (11.0) | 22,749 | (7.0) | 68,699 | (11.0) | 20,190 | (7.0) |
| Body mass index, kg/m2, mean (SD) | 25.8 | (4.2) | 26.8 | (5.0) | 25.8 | (4.3) | 26.9 | (5.1) | 25.8 | (4.3) | 26.8 | (5.1) |
| HbA1c, %, mean (SD) | 7.6 | (1.9) | 7.6 | (1.8) | 7.6 | (1.9) | 7.7 | (1.9) | 7.6 | (1.9) | 7.7 | (1.9) |
| Systolic blood pressure, mm Hg, mean (SD) | 138.5 | (19.8) | 132.6 | (16.8) | 138.4 | (19.6) | 132.3 | (16.7) | 138.6 | (19.6) | 132.5 | (16.6) |
| Diastolic blood pressure, mm Hg, mean (SD) | 76.3 | (11.5) | 75 | (12.0) | 76.5 | (11.5) | 75.1 | (11.9) | 76.7 | (11.5) | 75.4 | (11.7) |
| LDL-cholesterol, mmol/L, mean (SD) | 3.1 | (1.0) | 3.0 | (0.9) | 3.1 | (1.0) | 3.0 | (0.9) | 3.1 | (1.0) | 3.0 | (0.9) |
| Presence of pre-existing medical conditions, n (%) | ||||||||||||
| Atrial fibrillation | 26,572 | (3.9) | 15,395 | (4.0) | 19,133 | (3.1) | 10,537 | (3.1) | 18,016 | (3.0) | 5918 | (1.9) |
| Ischemic heart disease | 68,103 | (10.0) | 82,063 | (21.2) | 58,866 | (9.4) | 66,370 | (19.2) | — | — | — | — |
| Chronic kidney disease | 15,072 | (2.2) | 42,505 | (11.0) | 12,562 | (2.0) | 33,979 | (9.8) | 10,652 | (1.7) | 24,667 | (8.1) |
| Cerebrovascular accidents | 55,456 | (8.2) | 41,122 | (10.6) | — | — | — | — | 46,219 | (7.6) | 25,429 | (8.4) |
We did not have recorded information on ethnicity from the Hong Kong Hospital Authority. The Hong Kong resident population was estimated to be 93.6% of Chinese ethnicity in 2011 by the Census and Statistics Department (17).
All risk scores (new and existing) performed best in discrimination (C-index) with mortality outcomes followed by cerebrovascular disease and lowest with ischemic heart disease (Tables 2 and 3). In internal validation of 100 bootstrap samples, the C-index of the HKU models ranged from 0.845 for mortality, 0.727 for cerebrovascular disease, to 0.717 for ischemic heart disease. The corresponding HKU-SG models with fewer predictors had lower discriminatory performance with C-index scores of 0.805 for mortality, 0.722 for cerebrovascular disease and 0.700 for ischemic heart disease.
Internal and External Validation of HKU and HKU-SG Model: Model Performance Measured by Harrell C-Index
| Internal Validation Using Hong Kong Cohorta | External Validation Using Singapore Cohort | ||
|---|---|---|---|
| Imputation | Complete Cases | ||
| Mortality | |||
| HKU | 0.845 (0.845–0.846) | — | — |
| HKU-SG | 0.805 (0.804–0.806) | 0.772 (0.770–0.774) | 0.778 (0773–0.785) |
| Cerebrovascular disease | |||
| HKU | 0.727 (0.725–0.729) | — | — |
| HKU-SG | 0.722 (0.720–0.725) | 0.695 (0.690–0.699) | 0.701 (0.692–0.710) |
| Ischemic heart disease | |||
| HKU | 0.717 (0.715–0.719) | — | — |
| HKU-SG | 0.700 (0.698–0.702) | 0.644 (0.640–0.647) | 0.635 (0.627–0.643) |
The predictor variables in the HKU risk scores are age, duration of diabetes, sex, smoking status, HbA1c, total and high-density lipoprotein-cholesterol, blood pressure, creatinine, hemoglobin, white cell count, resting heart rate, preexisting conditions (cancer, congestive heart failure, diabetes complications), and medication for diabetes, hypertension and statins. The HKU-SG risk scores include all predictors common to both the Hong Kong and Singapore datasets: age, duration of diabetes, gender, smoking status, body mass index, systolic and diastolic blood pressure, HbA1c, low-density lipoprotein-cholesterol, preexisting conditions (atrial fibrillation and chronic kidney disease). Further details are provided in an online repository (10). (95% CI.)
Optimism corrected C-index.
External Validation of JADE, RECODe, and UKPDS Models: Model Performance Measured by Harrell C-index
| Hong Kong Cohort | ||
|---|---|---|
| With Imputation | Complete Cases | |
| Mortality | ||
| JADE | 0.841 (0.840–0.843) | 0.793 (0.786–0.800) |
| RECODe | 0.808 (0.807–0.810) | 0.785 (0.778–0.793) |
| Cerebrovascular disease | ||
| JADE | 0.730 (0.727–0.733) | 0.716 (0.707–0.724) |
| UKPDS 60 | 0.713 (0.710–0.715) | 0.680 (0.673–0.685) |
| UKPDS 82 | 0.679 (0.676–0.681) | 0.646 (0.640–0.650) |
| Ischemic heart disease | ||
| JADE | 0.685 (0.683–0.688) | 0.655 (0.647–0.664) |
| UKPDS 56 | 0.676 (0.673–0.678) | 0.655 (0.650–0.661) |
| UKPDS 82 | 0.654 (0.651–0.657) | 0.648 (0.644–0.652) |
(95% CI.)
The HKU-SG risk scores were externally validated using the Singapore study sample comprising 2,363,508 person-years of follow-up for mortality, 2,055,127 person-years for cerebrovascular disease, and 1,747,518 person-years for ischemic heart disease. In external validation (Table 2), the discriminative performance for mortality (C-index 0.772) was higher than that of cerebrovascular disease (C-index 0.695) and ischemic heart disease (C-index 0.644). There was little difference in discriminative performance results from sensitivity analyses using complete case analysis of the Singapore validation sample, or by restricting the Singapore validation sample to the Chinese ethnicity subgroup (10).
Because the Singapore data sample lacked the requisite variables, the Hong Kong derivation sample was used for external validation of the JADE, RECODe, and UKPDS risk scores. In contrast to the HKU-SG results, there were differences in discriminative performance of the JADE, RECODe, and, to a lesser extent, UKPDS risk scores between external validation of the imputed data samples compared with complete case analysis (Table 3). The JADE, RECODe, and UKPDS risk scores all performed worse in complete case analysis. For example, the C-index of JADE risk scores dropped from 0.841 to 0.793 for mortality, 0.730 to 0.716 for cerebrovascular disease, and 0.685 to 0.655 for ischemic heart disease. The JADE risk score derived in and thus calibrated to Hong Kong Chinese consistently displayed better discriminative performance than the RECODe and UKPDS risk scores.
For calibration performance, the HKU-SG models showed close correspondence between predicted and observed risk at five years with the Singapore validation cohort across virtually the entire distribution for mortality and cerebrovascular disease (Fig. 1). There was some underestimation of the observed risk of ischemic heart disease by the HKU-SG risk score. The JADE risk score for mortality showed close correspondence with the observed risk of mortality among the Hong Kong cohort, but overestimates the risk of cerebrovascular disease (at higher risk percentiles) and ischemic heart disease (Fig. 2). In comparison, the calibration performance of the RECODe and UKPDS risk scores showed substantial overestimation of the observed risks of mortality and cerebrovascular disease (Fig. 2). The newer UKPDS 82 risk score underestimated the risk of ischemic heart disease whereas the older UKPDS 56 risk scores substantially overestimates the observed risk. The newer UKPDS risk scores had better calibration than the older UKPDS risk scores. Poor correspondence between the predicted and observed risks for cerebrovascular disease and ischemic heart disease is particularly apparent in the higher risk percentiles.
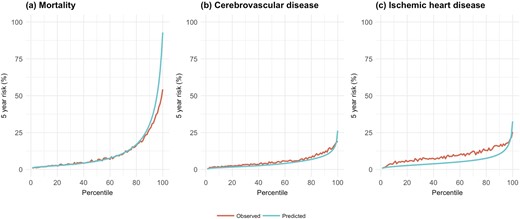
Mean predicted and observed risks of HKU-SG models at 5 y by percentile of predicted risk for the validation cohorts. HKU-SG models for the Singapore validation cohort.

Mean predicted and observed risks of JADE, RECODe, and UKPDS models at 5 y by percentile of predicted risk for the validation cohorts. (a) Mortality outcomes for the Hong Kong cohort (JADE and RECODe). (b) Cerebrovascular disease outcomes for the Hong Kong cohort (JADE and UKPDS). (c) Ischemic heart disease outcomes for the Hong Kong cohort (JADE and UKPDS).
Discussion
We developed and validated (internally and externally) risk scores for mortality, cerebrovascular disease, and ischemic heart disease in Chinese patients with type 2 diabetes in Hong Kong and Singapore. These contemporaneous HKU and HKU-SG risk scores update previous risk scores developed from a 1995 to 2005 Chinese cohort. Since that time improvements in medical care, lifestyles, and socioeconomic development in the intervening years may well have influenced disease outcome trajectories. The UKPDS and RECODe risk scores were developed in Western settings with few Asian participants and previously had not been validated in large Chinese populations.
The HKU and HKU-SG risk scores use simple clinical variables that are readily available, avoiding more sophisticated laboratory investigations such as the urinary albumin/creatinine ratio and microalbuminuria, that have limited the common usage of previous JADE, RECODe, and UKPDS risk scores in Chinese and resource-poor populations. We were unable to externally validate the JADE, RECODe, and UKPDS risk scores on the Singapore validation sample because of lack of data on the required predictors. Generally, for all the models, discrimination and calibration performance was highest for mortality and lowest for ischemic heart disease. Despite using a simpler set of predictors, the discriminative performances of the HKU-SG risk scores on external validation were comparable to JADE and RECODe and superior to UKPDS. External validation of the HKU-SG model yielded robust results with virtually identical discriminative performance (C-indices) using complete case analysis or Chinese-only subgroup. In contrast, complete cases analyses of the JADE, RECODe, and UKPDS risk scores resulted in substantially lower discriminative performance (C-indices), exhibiting much greater sensitivity to missing data.
Calibration performance of the HKU-SG risk scores in the external Singapore validation sample were superior to the calibration of JADE, RECODe, and UKPDS risk scores in the Hong Kong sample. Close correspondence was particularly observed for the HKU-SG mortality and cerebrovascular disease risk scores. The JADE model for mortality also showed close calibration with the observed risks in the Hong Kong cohort sample. Consistent with other studies, the UKPDS and RECODe risk scores tended to overestimate (the former more so than the latter) the risk of cerebrovascular disease and ischemic heart disease compared with the observed risk resulting in suboptimal calibration (6, 7).
Our study has a number of limitations. Both the development and validation samples were drawn from population-based health records, which increases generalizability but necessarily have less complete ascertainment of clinical data compared with the idealized settings of clinical trials or dedicated disease registers used by the previous risk models.
Comparisons of discrimination and calibration performance by the HKU-SG risk scores against JADE, RECODe, and UKPDS should be interpreted with caution because we were unable to perform external validation of all models on the same Singapore validation sample. The JADE, RECODe, and UKPDS risk scores were externally validated on the Hong Kong sample. Although mortality and cerebrovascular disease risks were similar in the Hong Kong and Singapore samples, rates of ischemic heart disease were higher in Singapore relative to Hong Kong. This is consistent with previous observations of a greater burden of coronary heart disease and related deaths in Singapore relative to Hong Kong (18–20). This likely led to the HKU-SG risk score underestimating the observed risk of ischemic heart disease in Singapore as shown in the calibration plots.
China has the highest absolute disease burden of diabetes in the world accounting for more than one in four diabetes cases globally (21). In China’s progress toward its recently promulgated Healthy China 2030 strategic plan (22), there is a case for diabetes services to be strengthened nationally. By calculating individual-level risk using routinely recorded data, these risk prediction scores can be used to evaluate population health status. These risk scores can be immediately implemented in the clinical setting for Chinese patients with diabetes using the online risk stratification tool. We took advantage of two large population-based datasets from Hong Kong and Singapore to develop and validate more parsimonious risk scores for the Chinese population, with the aim of providing wider implementation among populations in less developed settings or where clinical data are less readily available. We envisage the HKU-SG risk scores will be useful as a decision support for Chinese patients with diabetes to assess their disease risk.
Acknowledgments
We thank the Hospital Authority (Hong Kong) for kindly providing data access.
Financial Support: This study was supported by a University of Hong Kong Seed Fund for Basic Research grant (201709159008).
Disclosure Summary: The authors have nothing to disclose.
Data Availability: Restrictions apply to the availability of data generated or analyzed during this study to preserve patient confidentiality or because they were used under license. The corresponding author will on request detail the restrictions and any conditions under which access to some data may be provided.
Abbreviations:
- HKU
University of Hong Kong
- HKU-SG
University of Hong Kong-Singapore
- ICD-9
International Classification of Disease, 9th revision
- JADE
Joint Asia Diabetes Evaluation
- RECODe
Risk Equations for Complications Of type 2 Diabetes
- UKPDS
UK Prospective Diabetes Study
References and Notes
Author notes
K.B.T. and G.M.L. share joint senior authorship.
