


Abstract
The endocannabinoids anandamide (AEA) and 2-arachidonoylglycerol (2-AG), as well as the related acylethanolamide oleoylethanolamide (OEA), have been implicated in energy expenditure (EE) regulation and metabolic diseases. Muscle (fat-free mass) and fat (fat mass) are metabolically active compartments and main determinants of EE.
To assess whether human muscle, adipose, and plasma endocannabinoids correlate with EE.
Muscle, adipose, and plasma AEA, 2-AG, and OEA concentrations were measured via liquid chromatography–mass spectrometry. EE was assessed by indirect whole-room calorimetry.
Clinical trial.
Obese/overweight Native Americans of full (n = 35) and at least half (n = 21) Southwestern heritage.
Twenty-four-hour EE, sleeping EE (SLEEP), resting EE (REE), respiratory quotient (RQ), and macronutrient oxidation.
In full Natives, muscle AEA concentration correlated with SLEEP (r = −0.65, P = 0.004) and REE (r = −0.53, P = 0.02). Muscle 2-AG was associated with SLEEP (r = −0.75, P = 0.0003). Adipose OEA concentration correlated with RQ (r = −0.47, P = 0.04) and lipid oxidation (r = 0.51, P = 0.03). Plasma OEA concentration was associated with SLEEP (r = −0.52, P = 0.04). After adjustment for major determinants, these lipids explained nearly 20% of the additional variance of the respective measure. Similarly, in Native Americans of at least half Southwestern heritage, investigated lipids correlated with EE measures.
Endocannabinoids in metabolically relevant peripheral tissues explained a large part of EE variation and may be involved in regulating EE. Dysregulation of peripheral endocannabinoids may predispose people to metabolic diseases via an effect on EE and lipid oxidation.
Endocannabinoids, their regulatory enzymes, and targeted receptors make up the endocannabinoid system (ECS) (1). As derivatives of polyunsaturated fatty acids, endocannabinoids such as anandamide (AEA) and 2-arachidonoylglycerol (2-AG) are synthesized on demand from cell membrane phospholipids in various tissues (2–4) and bind to their G protein–coupled metabotropic receptors CB1 and CB2 via autocrine and paracrine signaling (3, 4). The nonendocannabinoid acylethanolamide oleoylethanolamide (OEA) is considered an ECS-related congener, synthesized and degraded together with AEA (5).
The ECS is involved in multiple metabolic pathways and has been extensively studied as a central regulator of energy balance (2). The ECS was shown to promote energy intake via central mechanisms, and consistent with a proposed effect on energy expenditure (EE), CB1-receptor antagonism/inverse agonism increased EE in rodents and humans (2, 6, 7). The latter was attributed to a relatively higher rate of lipid oxidation upon treatment (6, 7). In addition to an effect on lipid metabolism, in vitro and rodent models suggest that endocannabinoids are implied in glucose metabolism, as well as mitochondrial biogenesis in skeletal muscle and adipose tissue (1, 8–10), thus putatively affecting body compartments representative of the major determinants of human EE [i.e., fat mass (FM) and fat-free mass (FFM)] (11). Whether in humans and under physiologic conditions the role of the ECS in regulating metabolic activity in skeletal muscle and adipose tissue may be translated to an effect on EE is to be determined.
In plasma, changes in AEA and 2-AG concentrations are reflective of a dysregulated ECS tone in obesity and related disorders (1). It is, however, unclear whether plasma endocannabinoid concentrations are representative of ECS activity across tissues and thus correlate with a potential role of this system in EE regulation. Notably, cerebrospinal concentration of endocannabinoid-related OEA was shown to correlate with human EE measures, implicating this lipid in EE regulation via peripheral messaging (12). Despite its close structural and common origins with endocannabinoids, OEA reduces food intake and body weight via different receptors (13, 14) and possibly by enhanced peroxisome proliferator-activated receptor α–mediated lipolysis (15).
Given the implication of endocannabinoids and related OEA in metabolic processes and new research focusing on solely peripherally acting endocannabinoid antagonism (16), we characterized plasma, skeletal muscle and adipose tissue concentrations of AEA, 2-AG, and OEA and their associations with different measures of EE, assessed by indirect calorimetry in Native Americans of Southwestern heritage.
Materials and Methods
Participants and clinical assessment
The present report included data from 35 Native Americans of at least half Southwestern heritage and 21 Native Americans of full Southwestern heritage who participated (February 1995 to March 2009) in an ongoing study to identify obesity risk factors (17). Upon providing informed consent, healthy, nonpregnant, and nonlactating study participants were admitted to our clinical research unit. All volunteers included into the study were without diabetes [as per 75-g oral glucose tolerance test (Beckman Instruments, Fullerton, CA) or Autoanalyzer (Technicon, Tarrytown, NY)] (18). After admission, a sex- and weight-adjusted weight-maintaining diet was administered, consisting of 50% carbohydrates, 30% lipids, and 20% proteins (food quotient = 0.87). During the measurement of 24-hour EE, the weight-maintaining diet was adjusted to account for the reduced physical activity while in the metabolic chamber (19, 20). To ensure weight stability (±1%), caloric content of this diet was modified, if necessary. Anthropometric measurements of FM, FFM, and percentage body fat were performed using X-ray absorptiometry (DPX-1; Lunar Radiation Corp., Madison, WI) (21). Metabolic measurements were performed (see “Metabolic assessment”), and during the same stay, biological samples were collected: subcutaneous adipose tissue for measurement of endocannabinoids and OEA was removed from McBurney’s point or the respective area on the individual’s opposite site. A percutaneous needle biopsy of the vastus lateralis muscle was performed, as previously described (17). Prior to the oral glucose tolerance test, fasting plasma was collected for peripheral lipid measurement. Skeletal muscle, adipose tissue, and fasting plasma were snap-frozen and stored at −80°C until analysis.
The study (clinicaltrials.gov, NCT00340132) was approved by the Institutional Review Board of the National Institute of Diabetes and Digestive and Kidney Diseases.
Measurement of AEA, 2-AG, and OEA in human samples
In a single set on analysis, assessment of endocannabinoid and OEA concentrations in skeletal muscle, adipose tissue, and fasting plasma samples was performed in D. Piomelli’s laboratory at the Department of Pharmacology, University of California, Irvine, using liquid chromatography–mass spectrometry, as previously described (22). For a detailed description, please refer to the supplement.
Metabolic assessment
During 15-minute sampling intervals, the mean carbon dioxide and O2 gas exchange was calculated. During 23.75 hours in the whole-room calorimeter, 95 fifteen-minute sampling intervals were used to assess an individual’s EE as described in the above equation. To estimate 24-hour EE [coefficient of variation (CV), 2.4%], the measured EE during 23.75 hours was extrapolated to 24 hours (11). The average EE of all 15-minute intervals between 11:30 pm and 5 am of the following day for which spontaneous physical activity (SPA) was <1.5% served as an estimate for an individual’s sleeping EE (SLEEP; CV, 3.7%) (11, 23). SPA was assessed by radar (11). Compared with sleep, the increase of a participant’s thermogenesis in the awake, nonactive, and fed state is reflected by the awake-and-fed thermogenesis (AFT) (24). AFT is calculated from the difference between EE in the inactive state (EESPA) and SLEEP. It is these three components that make up 24-hour EE (24). Therefore, in case of correlation between 24-hour EE and lipid species, AFT and EESPA were investigated for association to assess the effect of endocannabinoids and OEA on this measure’s different components. Measurement of 24-hour carbon dioxide production and oxygen consumption (L) during an individual’s stay in the metabolic chamber allowed for calculation of the 24-hour RQ as a ratio of these two measures, after extrapolating each 15-minute measurement to 24 hours. From the 24-hour RQ, 24-hour lipid and carbohydrate oxidation were determined after accounting for protein oxidation as assessed by measuring 24-hour nitrogen excretion in urine. On a separate day and after an overnight fast, the energy expended in the motionless and awake state [resting energy expenditure (REE)] was also measured by a ventilated hood system (11). For REE, average interval measures (40 minutes) were extrapolated to 24 hours (CV, 4.7%) (11).
Statistical analyses
SAS Enterprise Guide 7.1 (SAS Institute, Inc., Cary, NC) was used to perform correlation analyses of endocannabinoid and OEA concentrations with EE measures. Measured concentrations for adipose and skeletal muscle lipids were log10-transformed to reduce the influence of extreme values on association analyses. Baseline characteristics are reported as mean ± standard deviation. Residuals of EE measures were obtained after introducing the major known determinants of the respective measurement into general linear models. For 24-hour EE, SLEEP, EESPA, and REE, these included age, sex, FFM, and FM (24, 25). Twenty-four-hour EE was also adjusted for SPA (11). Twenty-four-hour RQ was adjusted for age, sex, energy balance during indirect calorimetry, and percentage body fat (26). Major determinants of 24-hour substrate oxidation were age, sex, energy balance, FM, and FFM (11, 25). AFT was adjusted for age, sex, FFM, percentage body fat, and fasting glucose concentrations (24). Measures of anthropometry were adjusted for age and sex. The α level was set to 0.05. Pearson correlations are reported for normally distributed or log10-transformed variables. Native Americans of full vs at least half Southwestern heritage were analyzed separately in the current study to compare populations of similar anthropometry but of a more homogeneous (full Native) vs a more mixed heritage (at least half Native). For sensitivity analyses comparing study groups (i.e., full vs at least half Native Americans, participants with incomplete EE or lipid assessment), please refer to the supplement. By definition, Native Americans of full Southwestern heritage are included in the study group of at least half Native Americans. Both study groups were analyzed separately.
Results
Correlation of AEA, 2-AG, and OEA with participant characteristics and across tissues
For population characteristics, please refer to Table 1. Tissue and plasma lipid concentrations are reported in Supplemental Table 1. Partial correlations of anthropometry with tissue and plasma AEA, 2-AG, and OEA concentrations are reported in Supplemental Table 2. In Native Americans of full Southwestern heritage, adipose AEA concentration was associated with body mass index (r = 0.56, P = 0.04). Adipose OEA concentration correlated with percentage body fat (r = 0.59, P = 0.03). For plasma and skeletal muscle, there were no associations (all P > 0.05). In Native Americans of at least half Southwestern heritage, across tissues, no associations for AEA, 2-AG, and OEA concentration with participant characteristics were found (all P > 0.05).
Study Population: Demographic Characteristics
| Characteristic | Study Participants | |||||
|---|---|---|---|---|---|---|
| Native Americans of Full Southwestern Heritage | Native Americans of at Least Half Southwestern Heritage | |||||
| All Participantsa,b (n = 21) | Male (n = 13) | Female (n = 8) | All Participantsa,b (n = 35) | Male (n = 22) | Female (n = 13) | |
| Age, y | 30.0 ± 7.82 | 30.3 ± 8.13 | 31.1 ± 7.70 | 28.9 ± 7.5 | 28.9 ± 7.6 | 29.0 ± 7.5 |
| Body weight, kg | 94.6 ± 18.5 | 94.4 ± 16.8 | 95.1 ± 22.3 | 91.9 ± 18.0 | 93.6 ± 16.8 | 89.0 ± 20.3 |
| Body mass index, kg/m2 | 34.7 ± 8.56 | 32.9 ± 9.22 | 37.7 ± 6.90 | 32.9 ± 7.7 | 31.8 ± 7.7 | 34.8 ± 7.6 |
| Body fat, % | 33.5 ± 8.45 | 28.1 ± 5.72 | 42.2 ± 2.71 | 32.6 ± 7.7 | 28.0 ± 5.4 | 40.4 ± 3.7 |
| Waist circumference, in. | 43.4 ± 5.77 | 41.8 ± 5.09 | 46.0 ± 6.16 | 42.2 ± 5.5 | 41.4 ± 5.0 | 43.4 ± 6.3 |
| FM, kg | 32.1 ± 11.4 | 27.2 ± 9.36 | 40.1 ± 10.1 | 30.3 ± 10.3 | 26.9 ± 9.0 | 36.2 ± 10.0 |
| FFM, kg | 62.5 ± 11.8 | 67.2 ± 8.48 | 54.9 ± 12.9 | 61.5 ± 11.7 | 66.7 ± 8.7 | 52.8 ± 11.0 |
| Fasting plasma glucose, mg/dL | 87.3 ± 7.62 | 85.4 ± 7.88 | 90.4 ± 6.48 | 86.0 ± 9.0 | 83.6 ± 9.8 | 90.0 ± 6.0 |
| 2-h plasma glucose, mg/dL | 125.0 ± 22.7 | 120.1 ± 21.4 | 133.0 ± 23.9 | 118.0 ± 24.0 | 114.1 ± 22.6 | 124.6 ± 25.9 |
| Glucose tolerance statusc | ||||||
| Normal glucose regulation | 15 (71.4) | 11 (84.6) | 4 (50.0) | 28 (80.0) | 20 (90.9) | 8 (53.3) |
| Impaired glucose regulation | 6 (28.6) | 2 (15.4) | 4 (50.0) | 7 (20.0) | 2 (9.09) | 5 (46.7) |
| Energy intake, kcal/dd | 2344 ± 313 | 2423 ± 282 | 2217 ± 340 | 2282 ± 316.6 | 2383 ± 280 | 2113 ± 312.4 |
| 24-h respiratory quotient | 0.86 ± 0.03 | 0.86 ± 0.02 | 0.85 ± 0.03 | 0.86 ± 0.04 | 0.87 ± 0.03 | 0.84 ± 0.05 |
| 24-h carbohydrate oxidation, kcal/d | 1164 ± 253 | 1266 ± 172 | 976 ± 283 | 1121 ± 350 | 1276 ± 210 | 863 ± 391 |
| 24-h lipid oxidation, kcal/d | 859 ± 296 | 904 ± 284 | 777 ± 324 | 855 ± 342 | 835 ± 276 | 889 ± 442 |
| 24-h energy expenditure, kcal/d | 2389 ± 370 | 2560 ± 277 | 2112 ± 342 | 2345 ± 318 | 2474 ± 263 | 2127 ± 289 |
| Sleeping energy expenditure, kcal/d | 1790 ± 276 | 1883 ± 236 | 1646 ± 288 | 1750 ± 290 | 1834 ± 276 | 1605 ± 263 |
| Resting energy expenditure, kcal/d | 1790 ± 276 | 1891 ± 92 | 1627 ± 203 | 1812 ± 212 | 1896 ± 184 | 1655 ± 173 |
All data reported as frequency (percentage) or mean ± standard deviation. Native Americans of full and at least half Southwestern heritage were included in present analyses: in these individuals, Southwestern Native American heritage was of 8/8th vs ≥4/8th tribal descent by self-report, respectively.
Only healthy, nondiabetic (2-hour plasma glucose <200 mg/dL) individuals between 18 and 55 years old were included.
Maximum population size reported. Due to data availability, sample size may differ for certain measurements (see Supplemental Data).
For normal glucose regulation, fasting plasma glucose <100 mg/dL and 2-hour plasma glucose <140 mg/dL, and for impaired glucose regulation, fasting plasma glucose 100 to 126 mg/dL and/or 2-hour plasma glucose 140 to 199 mg/dL, in accordance with the American Diabetes Association guidelines (18).
Total energy intake during a 24-hour stay in a respiratory chamber. Meals served at 8 am, 11 am, 4 pm, and 7 pm. No difference in energy intake comparing Native Americans of full vs at least half Southwestern heritage (61.7 kcal/d, SE 87.1, P = 0.48).
Associations for endocannabinoid and OEA content across tissues and plasma are shown in Table 2. In Native Americans of full Southwestern heritage, muscle AEA concentration was associated with plasma OEA concentration (r = 0.54, P = 0.003). In Native Americans of at least half Southwestern heritage, muscle AEA and 2-AG concentrations correlated with plasma OEA concentration (r = 0.60, P = 0.0006 and r = 0.42, P = 0.02, respectively). Adipose AEA concentration was associated with plasma OEA concentration (r = 0.45, P = 0.03).
Correlation of Endocannabinoids and Oleoylethanolamide Across Tissues
| Charcteristic | Skeletal Muscle Tissue | Adipose Tissue | Plasma | ||||||
|---|---|---|---|---|---|---|---|---|---|
| AEA | 2-AG | OEA | AEA | 2-AG | OEA | AEA | 2-AG | OEA | |
| Skeletal muscle tissue | |||||||||
| AEA | |||||||||
| r | — | — | — | −0.11 | −0.13 | 0.33 | 0.31 | 0.29 | 0.60 |
| P | — | — | — | 0.57 | 0.51 | 0.09 | 0.10 | 0.13 | 0.0006 |
| 2-AG | |||||||||
| r | — | — | — | −0.06 | −0.02 | −0.16 | 0.34 | 0.08 | 0.42 |
| P | — | — | — | 0.74 | 0.93 | 0.42 | 0.07 | 0.66 | 0.02 |
| OEA | |||||||||
| r | — | — | — | 0.13 | 0.19 | 0.12 | 0.20 | 0.02 | 0.27 |
| P | — | — | — | 0.51 | 0.32 | 0.55 | 0.30 | 0.90 | 0.16 |
| Adipose tissue | |||||||||
| AEA | |||||||||
| r | −0.11 | −0.06 | 0.13 | — | — | — | 0.24 | 0.38 | 0.45 |
| P | 0.57 | 0.74 | 0.51 | — | — | — | 0.26 | 0.07 | 0.03 |
| 2-AG | |||||||||
| r | −0.13 | −0.02 | 0.19 | — | — | — | 0.21 | 0.03 | 0.30 |
| P | 0.51 | 0.93 | 0.32 | — | — | — | 0.32 | 0.87 | 0.16 |
| OEA | |||||||||
| r | 0.33 | −0.16 | 0.12 | — | — | — | −0.13 | 0.11 | 0.28 |
| P | 0.09 | 0.42 | 0.55 | — | — | — | 0.55 | 0.61 | 0.19 |
| Plasma | |||||||||
| AEA | |||||||||
| r | 0.31 | 0.34 | 0.20 | 0.24 | 0.21 | −0.13 | — | — | — |
| P | 0.10 | 0.07 | 0.30 | 0.26 | 0.32 | 0.55 | — | — | — |
| 2-AG | |||||||||
| r | 0.29 | 0.08 | 0.02 | 0.38 | 0.03 | 0.11 | — | — | — |
| P | 0.13 | 0.66 | 0.90 | 0.07 | 0.87 | 0.61 | — | — | — |
| OEA | |||||||||
| r | 0.60 | 0.42 | 0.27 | 0.45 | 0.30 | 0.28 | — | — | — |
| P | 0.0006 | 0.02 | 0.16 | 0.03 | 0.16 | 0.19 | — | — | — |
Partial correlation of AEA, 2-AG, and OEA across skeletal muscle and adipose tissue, as well as plasma in Native Americans of at least half Southwestern heritage (n = 35), adjusted for age and sex. Pearson correlation coefficient (r) reported. Significant results are highlighted in bold. In Native Americans of full Southwestern heritage, the association between skeletal muscle AEA concentration and plasma OEA concentration (in italics) could be reproduced. AEA, 2-AG, and OEA concentrations were log10-transformed to reduce the influence of extreme values on the multivariate model.
Skeletal muscle tissue endocannabinoid and OEA concentrations and EE in Native Americans of full Southwestern heritage
The 2-AG concentration in skeletal muscle correlated with residual 24-hour EE [r = −0.51, P = 0.03, β = −333.4 kcal/d per 10-fold difference, standard error (SE) 107.9; Fig. 1(a)], as well as residual SLEEP [r = −0.75, P = 0.0003, β = −537.4 kcal/d per 10-fold difference, SE 107.0; Fig. 1(b)]. After accounting for major known determinants of 24-hour EE and SLEEP, 2-AG accounted for an additional 4% and 20% [Fig. 2(a)] of the variance in 24-hour EE and SLEEP, respectively. Muscle 2-AG concentration was not associated with residual AFT but showed a negative correlation with residual EESPA (r = −0.68, P = 0.003, β = −0.49 kcal/d per 10-fold difference, SE 0.14). Muscle AEA concentration was also associated with residual SLEEP [r = −0.65, P = 0.004, β = −443.0.6 kcal/d per 10-fold difference, SE 125.3; Fig. 1(c)] and residual REE [r = −0.53, P = 0.02, β = −310.2 kcal/d per 10-fold difference, SE 95.8; Fig. 1(d)]. AEA explained an additional 15% [Fig. 2(b)] and 7% of these measures’ variance, respectively. In a multivariate model, muscle 2-AG and AEA jointly explained 26% of the unknown variance of SLEEP after accounting for age, sex, FM, and FFM with β = −416.6 kcal/d per 10-fold difference for 2-AG (P = 0.0004, SE 83.4) and β = −281.9 kcal/d per 10-fold difference for AEA (P = 0.005, SE 79.2). Muscle OEA concentrations were not associated with residual 24-hour EE, SLEEP, or REE (all P > 0.05). There were no correlations between any of the lipid species with residual 24-hour RQ and substrate oxidation (all P > 0.05).
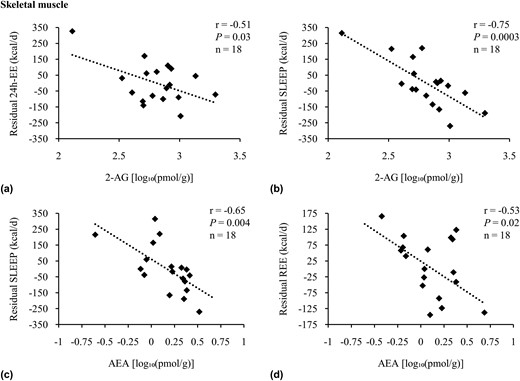
Adjusted correlations of residual measures of EE with skeletal muscle AEA and 2-AG. Association analysis of 2-AG with residuals of (a) 24-hour EE and (b) SLEEP, as well as AEA with residuals of (c) SLEEP and (d) REE in Native Americans of full Southwestern heritage. Twenty-four-hour EE, SLEEP, and REE were adjusted for age, sex, FM, and FFM. Twenty-four-hour EE was also adjusted for spontaneous physical activity (25). Endocannabinoids and OEA concentrations were log10-transformed to reduce the influence of extreme values on the multivariate model. Sensitivity analyses were performed for (a) dFβ = −3.69 standard deviation (SD), r = −0.13, P = 0.62; (b) dFβ = 1.96 SD, r = −0.67, P = 0.003; and (c) dFβ = 2.46 SD, r = −0.58, P = 0.01. Pearson correlation (r) reported. Due to incomplete EE and/or lipid assessment in skeletal muscle, the number of individuals included here in the presented analyses differed from the overall group of 21 Native Americans of full Southwestern heritage. Compared with the latter, these participants were not different regarding age, sex, FM, FFM, body mass index, percentage body fat, glucose regulation, and AEA, 2-AG, and OEA tissue and plasma concentrations (all P > 0.05). Individuals with EE measured using a whole-room indirect calorimeter (n = 18) and those with REE measured using the ventilated hood method (n = 18) were two different subgroups from the 21 individuals with lipid concentrations assessed in skeletal muscle. In sensitivity analyses considering age, sex, FM, FFM, body mass index, percentage body fat, glucose regulation, and AEA, 2-AG, and OEA tissue and plasma concentrations, both groups were not different from each other or the overall study population of at least half and full Native Americans of Southwestern heritage (all P > 0.05).
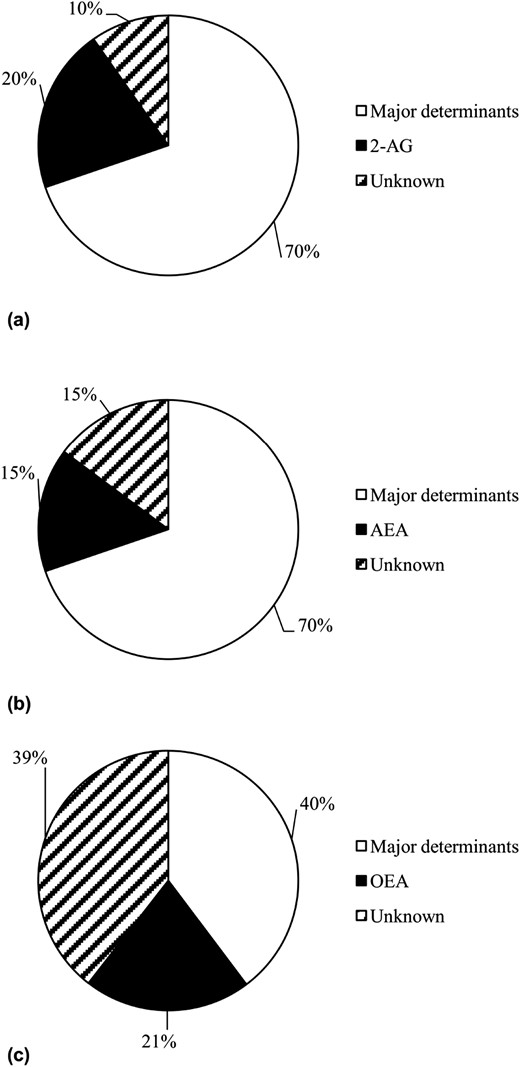
Variance of EE measure explained by AEA, 2-AG, and OEA. Variance of (a, b) SLEEP and (c) 24-hour RQ explained by major known determinants (SLEEP: FFM, FM, age, and sex; for 24-hour RQ: percentage body fat, energy balance during indirect calorimetry, age, and sex) and skeletal muscle (a) 2-AG or (b) AEA concentrations, as well as adipose tissue (c) OEA concentration, respectively. Notably, due to our study group size, reported variance may differ from previous reports (27).
Adipose tissue endocannabinoid and OEA concentrations in Native Americans of full Southwestern heritage
Adipose OEA concentrations were correlated with residual 24-hour RQ [r = −0.47, P = 0.04, β = −0.11 per 10-fold difference, SE 0.04; Fig. 3(a)], residual 24-hour lipid, and carbohydrate oxidation [r = 0.51, P = 0.03 and β = 734.2 kcal/d per 10-fold difference, SE 309.0; r = −0.57, P = 0.01 and β = −931.7 kcal/d per 10-fold difference, SE 322.4, respectively; Fig. 3(b) and 3(c)]. After accounting for the major known determinants of 24-hour RQ, 24-hour lipid oxidation, and carbohydrate oxidation, OEA explained an additional 21% [Fig. 2(c)], 10%, and 22% of these measurements, respectively. For other EE measures, including analyses performed for the AEA and 2-AG content in adipose tissue, no associations were found (all P > 0.05).
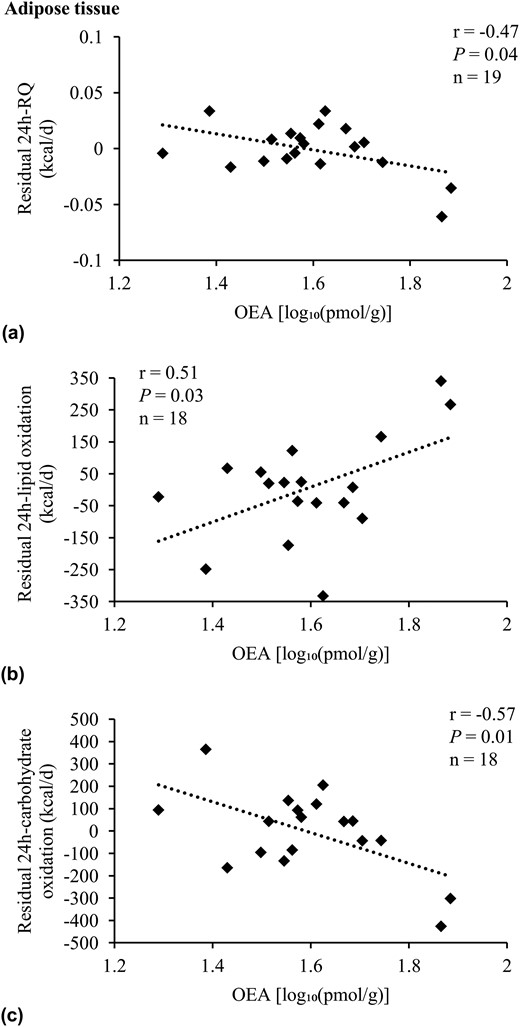
Adjusted correlations of residuals of RQ and substrate oxidation with adipose OEA. Association analysis of OEA with residuals of (a) 24-hour RQ, (b) 24-hour lipid oxidation, and (c) 24-hour carbohydrate oxidation in Native Americans of full Southwestern heritage. Twenty-four-hour RQ was adjusted for age, sex, energy balance, and percentage body fat. Twenty-four-hour lipid and carbohydrate oxidation were adjusted for age, sex, energy balance, FM, and FFM (25). OEA concentration was log10-transformed to reduce the influence of extreme values on the multivariate model. Pearson correlation (r) reported. Due to incomplete EE and/or lipid assessment in adipose tissue, the number of individuals included here in the presented analyses differed from the overall group of 21 Native Americans of full Southwestern heritage. Compared with the latter, these participants were not different regarding age, sex, FM, FFM, body mass index, percentage body fat, glucose regulation, and AEA, 2-AG, and OEA tissue and plasma concentrations (all P > 0.05).
Plasma endocannabinoid and OEA concentrations in Native Americans of full Southwestern heritage
In plasma, OEA was associated with residual SLEEP (r = −0.52, P = 0.04; β = −619.7 kcal/d per 10-fold difference, SE 287.6) in 15 individuals with complete EE and lipid assessment. The inclusion of OEA into a general linear model for SLEEP explained an additional 12% of this measure’s variance. Further analyses did not show any correlations for OEA, AEA, and 2-AG with residual EE measures, 24-hour RQ, and substrate oxidation (all P > 0.05).
Comparison of associations in Native Americans of at least half Southwestern heritage
In comparison with the full Native American group, in 30 Native Americans of at least half Southwestern heritage with complete EE data as well as skeletal muscle lipid assessment, the muscle 2-AG and AEA concentration correlated with residual SLEEP as well [r = −0.48, P = 0.007, β = −414.7 kcal/d per 10-fold difference, SE 139.9, Fig. 4(a); r = −0.62, P = 0.0003, β = −441.5 kcal/d per 10-fold difference, SE 100.7, Fig. 4(b), respectively]. In line with our findings in Native Americans of full Southwestern heritage, in individuals of at least half Southwestern heritage, OEA adipose tissue concentration correlated with residual 24-hour RQ [r = −0.36, P = 0.05, β = −0.06 kcal/d per 10-fold difference, SE 0.03, Fig. 4(c)] and trended to an association with residual 24-hour lipid and carbohydrate oxidation [r = 0.33, P = 0.08, β = 434.1 kcal/d per 10-fold difference, SE 227.8, and r = −0.31, P = 0.09, β = −475.9 kcal/d per 10-fold difference, SE −475.9; Fig. 4(d) and 4(e), respectively].
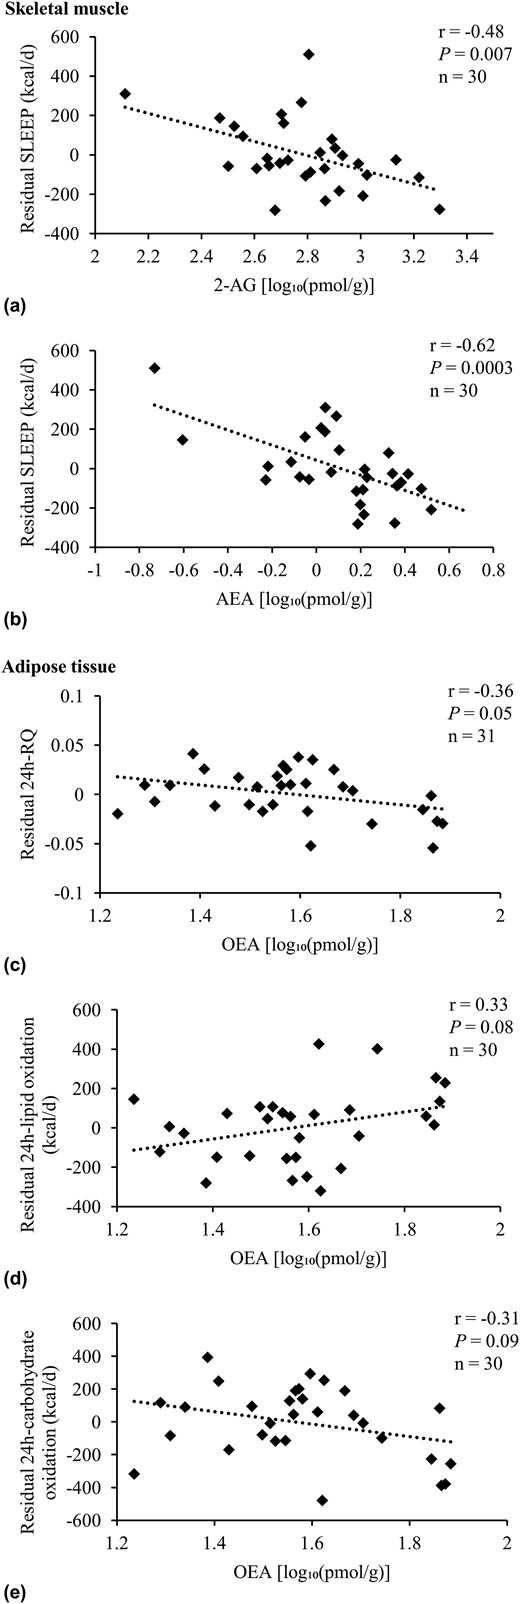
Adjusted correlations in Native Americans of at least half Southwestern heritage. Association analysis of 2-AG and AEA with residuals of (a, b) SLEEP, as well as OEA with residuals of (c) 24-hour RQ, (d) 24-hour lipid oxidation, and (e) carbohydrate oxidation in Native Americans of at least half Southwestern heritage. SLEEP was adjusted for age, sex, FM, and FFM. Twenty-four-hour RQ was adjusted for age, sex, energy balance, and body fat. Twenty-four-hour lipid and carbohydrate oxidation were adjusted for age, sex, energy balance, FM, and FFM (25). Endocannabinoids and OEA concentrations were log10-transformed to reduce the influence of extreme values on the multivariate model. Sensitivity analyses for significant results were performed: in (a), removing the individual with the highest residual SLEEP from analysis did not change the significance of reported results (dFβ = −2.05, r = −0.38, P = 0.04). The same sensitivity analyses were performed for (b): upon removal of the individual with the lowest AEA concentration, the association of skeletal muscle AEA concentration with residual SLEEP was still significant (dFβ = −3.71, r = −0.46, P = 0.01). This was also true for the other outlier with a slightly higher AEA concentration (dFβ = 1.59, r = −0.63, P = 0.0003). Excluding both outliers from association analysis did not affect the significance of presented results (r = −0.43, P = 0.02). Pearson correlation (r) reported. Due to incomplete EE and/or lipid assessment in skeletal muscle and adipose tissue, the number of individuals included here in the presented analyses differed from the overall group of 35 Native Americans of at least half Southwestern heritage. Compared with the latter, these participants were not different regarding age, sex, FM, FFM, body mass index, percentage body fat, glucose regulation, and AEA, 2-AG, and OEA tissue and plasma concentrations (all P > 0.05).
Discussion
We have demonstrated that skeletal muscle, adipose tissue, and plasma concentrations of endocannabinoids and endocannabinoid-related OEA—lipid compounds already implicated in energy balance regulation (1, 2)—are associated with measures of EE and substrate oxidation in humans at risk for metabolic and cardiovascular disease. Specifically, skeletal muscle AEA and 2-AG content were correlated with SLEEP, REE, and 24-hour EE in this population, explaining a large amount of the residual variance after accounting for the known determinants of these measures (11, 25). Specifically, for SLEEP, AEA and 2-AG explained an additional 15% and 20% and, jointly, 26% of its variance. In adipose tissue, OEA was associated with 24-hour RQ, 24-hour lipid oxidation, and carbohydrate oxidation, accounting for 21% of the variance for 24-hour RQ. Peripheral OEA concentrations in plasma were associated with SLEEP, as well. Primarily in skeletal muscle and plasma, associations were found between AEA, 2-AG, and OEA. Our analyses indicate that in Native Americans of Southwestern heritage, peripheral AEA, 2-AG, and OEA may be involved in the regulation of EE.
The ECS affects weight gain via central and peripheral mechanisms of energy intake and EE control: in rodents and humans, higher central ECS activity leads to greater food intake and activates food reward–related mechanisms (1, 2). Central reduction of ECS tone, either by deletion of hypothalamic CB1-receptor or increased endocannabinoid degradation, led to higher EE in mice and affected weight change (28, 29). Evidence from cell cultures suggests that higher ECS activity decreases insulin-stimulated glucose uptake and oxidative metabolism in human skeletal muscle (8, 9, 30), whereas lower ECS tone led to greater mitogenesis (9). In adipose tissue, higher ECS activity increases adipose lipid storage and mitochondrial biogenesis (6, 10, 31). Thus, the ECS may affect metabolic activity of overall representatives of FFM and FM, which indicates a role for peripheral ECS activity in human EE regulation (1, 2). To date, studies have investigated a link between the ECS and human EE primarily in vitro or in a clinical trial administering a CB1-receptor inverse agonist (6–10, 29, 31). The current study demonstrated associations between directly measured tissue concentrations of the ECS and related OEA with gold-standard measures of EE under physiologic conditions, providing novel insight into the involvement of the ECS in human energy balance regulation.
We found that the concentration of specific endocannabinoids in skeletal muscle was negatively associated with EE. This is supported by rodent models in which CB1-receptor stimulation results in impaired skeletal muscle oxidative metabolism and mitogenesis, whereas CB1-receptor antagonism induces lipolysis and increased EE (6, 10, 31). In human skeletal muscle, inhibition of the CB1-receptor (1) reduces the expression of adenosine monophosphate–activated protein kinase α-1, a positive regulator of glucose and lipid oxidation, as well as mitogenesis (9), and (2) decreases pyruvate dehydrogenase kinase 4 expression, which is involved in mitochondrial glucose oxidation (9). A clinical trial investigating the effect of administration of a CB1-receptor inverse agonist on EE found an increase in lipid oxidation along with increased REE (7). We did not observe an association of AEA and 2-AG with 24-hour RQ or lipid oxidation, indicating that basal ECS activity may have a more limited role in affecting EE via lipid metabolism. However, these studies imply a role for the ECS in skeletal muscle metabolic control. Furthermore, as supported by our multivariate model for 2-AG, AEA, and SLEEP, 2-AG and AEA may act as independent regulators of human EE. Specifically, regarding the different components of EE, AEA and 2-AG might primarily affect SLEEP.
FFM explains ∼70% of the variance in EE (27). Although ∼20% of this variance is determined by the energy expended by skeletal muscle (32), skeletal muscle has a relatively low mass-specific metabolic rate (33), and other components of FFM, such as the liver, kidneys, or brain, contribute to a greater extent to EE (34). Therefore, we need to be cautious in the interpretation of the dimension a skeletal muscle endocannabinoid effect might have on human EE. Nevertheless, AEA and 2-AG explained a large amount of the residual variance in SLEEP, adjusted for its major known determinants. As for obesity therapy, it remains a major challenge to identify novel determinants of EE; our data may point to the peripheral ECS as a putative aim of targeted pharmacotherapy. Notably, novel pathways have been described via which the ECS may modulate EE. These may include, for instance, a role of endocannabinoids in sphingolipid-mediated mitochondrial dysfunction (35).
Although in adipocyte cultures, a higher ECS tone affects metabolic processes such as lipolysis, fatty acid oxidation, and mitochondrial biogenesis (1, 10, 31), we did not observe an association between adipose tissue AEA and 2-AG concentration and EE measures. This is not surprising as higher 24-hour EE in participants with obesity is primarily due to greater metabolically active FFM and not FM (11). Nevertheless, adipose tissue OEA—an ECS congener—may be important in mechanisms underlying human weight regulation: we found that increased OEA adipose tissue concentrations were associated with lower 24-hour RQ, consistent with increased lipid oxidation. Dependent on peroxisome proliferator-activated receptor α activation, OEA induced adipocyte lipolysis in a rodent model and in vitro (36), as well as reduced energy intake upon peripheral administration in rats (13). It might therefore be that its antiobesogenic action is due to the effect of OEA on lipid oxidation and food intake (13, 36). Individuals with higher 24-hour RQs, indicating lower reliance on lipids, gain more weight than individuals who use lipids as a primary source for energy production (26, 37). This effect is thought to be mediated via greater food intake to replenish glycogen stores (37). As human adipocyte in vitro lipolysis is associated with whole-body lipid oxidation (38), the association of adipose OEA concentration with 24-hour RQ and substrate oxidation indirectly indicates a role for adipose OEA in human food intake regulation. Thus, pharmacotherapy directed at adipose OEA in humans may be useful to modify energy intake via an effect on lipid vs carbohydrate oxidation.
The negative association of plasma OEA concentration with SLEEP was observed in a small study subpopulation and could not be reproduced in our bigger study cohort. It is interesting to note that although we generally did not find associations of AEA, 2-AG, and OEA across body tissues, there was an association between skeletal muscle AEA and plasma OEA, and both were associated with SLEEP. These results thus may reflect an overall ECS tone influencing metabolism (1).
Although our sample size in the full Native study subgroup was limited, comparative analyses of ECS and/or OEA and EE measures for Native Americans of full vs at least half Southwestern heritage of similar anthropometry indicated that in these groups, variation in the degree of Southwestern heritage had little effect on investigated associations.
Our results are consistent with the known physiology of the ECS and its related lipid OEA. However, we acknowledge that the current study investigated a relatively small cohort of Native Americans of Southwestern heritage. Nevertheless, we were able to show that association patterns observed for full Native Americans were largely shown in a larger study population of a more mixed Southwestern heritage as well. Although it should be noted that results from other metabolic studies conducted in individuals of Native American Southwestern heritage have been confirmed in other populations (39), our data still need to be reproduced in larger cohorts of a more diverse heritage. Due to its sample size, results drawn from our study population may be influenced by outliers, and we acknowledge that this particularly affected the association of 24-hour EE and skeletal muscle 2-AG content. However, all other sensitivity analyses performed supported our results. Although the ECS and OEA have been implicated in energy regulation, our results are cross-sectional and thus cannot confirm causality. Unlike other studies, we did not find an association between plasma endocannabinoids and OEA and body composition or plasma glucose (12, 40), possibly due to our small cohort.
To conclude, we have demonstrated associations between muscle and adipose concentrations of AEA, 2-AG, and OEA with measures of EE and substrate oxidation in Native Americans of Southwestern heritage. Moreover, these concentrations are correlated across different body compartments. Thus, the peripheral endocannabinoid system and its related congener OEA remain intriguing targets for pharmacologic regulation of energy balance.
Abbreviations:
- 2-AG
2-arachidonoylglycerol
- AEA
anandamide
- AFT
awake-and-fed thermogenesis
- CV
coefficient of variation
- ECS
endocannabinoid system
- EE
energy expenditure
- EESPA
energy expenditure in the inactive state
- FFM
fat-free mass
- FM
at mass
- O2
oxygen
- OEA
oleoylethanolamide
- REE
resting energy expenditure
- RQ
respiratory quotient
- SE
standard error
- SLEEP
sleeping energy expenditure
- SPA
spontaneous physical activity.
Acknowledgments
Financial Support: This work was supported by the National Institutes of Health Intramural Research Fund, Charité-Universitätsmedizin Berlin, and the Berlin Institute of Health Charité Clinician Scientist Program (to R.J.v.S.).
Clinical Trial Information: ClinicalTrials.gov no. NCT00340132 (registered 1 August 1982).
Disclosure Summary: The authors have nothing to disclose.
