


Abstract
Many biological pathways involved in regulating substrate metabolism display rhythmic oscillation patterns. In rodents, clock genes regulate circadian rhythms of metabolic genes and substrate metabolism. However, the interrelationships among substrate metabolism, metabolic genes, and clock genes have not been fully explored in people.
We tested the hypothesis that the diurnal expression pattern of pyruvate dehydrogenase kinase 4 (PDK4), a key metabolic enzyme involved in fuel switching between glucose and free fatty acids (FFAs), is associated with plasma FFA concentration and clock genes.
We analyzed peripheral blood mononuclear cells (PBMCs), subcutaneous adipose tissue, and plasma samples obtained serially during 24 hours from metabolically healthy women (n = 10) and evaluated the interrelationships among PDK4, plasma FFA, and clock genes. We also determined the potential mechanisms responsible for PDK4 transcriptional regulation by using primary human PBMCs and adipocytes.
We found that PDK4 diurnal expression patterns were similar in PBMCs and adipose tissue (ρ = 0.84, P < 0.001). The diurnal variation in PBMC PDK4 expression correlated more strongly with plasma FFA and insulin (ρ = 0.86 and 0.63, respectively, both P < 0.001) concentrations than clock genes. Data obtained from primary culture experiments demonstrated that FFAs directly induced PDK4 gene expression, at least in part through activation of peroxisome proliferator-activated receptor α.
Our results suggest that plasma FFA availability is an important regulator of diurnal expression patterns of PDK4, and we identify a novel interaction between plasma FFA and cellular diurnal rhythms in regulating substrate metabolism.
Daily energy homeostasis is maintained by alterations in the use of exogenous and endogenous fuels in response to nutrient availability and hormonal control during the feeding–fasting cycle (1, 2). In the postprandial state, insulin stimulates glucose uptake and oxidization and enhances lipogenesis and triglyceride storage in adipose tissue. In the postabsorptive state, lipolysis of adipose tissue triglycerides releases free fatty acids (FFAs) into the circulation, which are then preferentially used for mitochondrial β-oxidation and adenosine triphosphate production. Accordingly, the key biological pathways involved in regulating substrate metabolism display rhythmic oscillation patterns during a 24-hour period (1, 3–5).
Pyruvate dehydrogenase kinase 4 (PDK4) is a key mitochondrial enzyme that is involved in regulating the shift in substrate oxidation between carbohydrate and fat as needed in response to the metabolic environment (6). PDK4 inactivates the pyruvate dehydrogenase complex and inhibits the entry of pyruvate into the tricarboxylic acid cycle, thereby preventing the oxidation of glucose and promoting the oxidation of FFAs. Dysregulation of PDK4 expression is associated with alterations in substrate metabolism that occur in people with obesity, insulin resistance, and type 2 diabetes (7, 8). Data from studies conducted in rodents have shown that clock genes (2, 9, 10), master regulators of circadian rhythm, are directly involved in controlling circadian variations in Pdk4 gene expression and whole-body and cellular substrate metabolism (11–13). Although data from several studies have found that clock genes oscillate in human tissues and cells (4, 14–17), the diurnal regulation of PDK4 and its relationship with substrate metabolism and clock genes in people are not known.
The purpose of this study was to investigate the mechanisms responsible for the diurnal expression pattern of PDK4 in metabolically healthy people throughout the normal 24-hour fed and fasted conditions. We hypothesized that diurnal variation in PDK4 expression is associated with diurnal variations in plasma FFA concentrations and clock genes. Peripheral blood mononuclear cells (PBMCs), adipose tissue, and plasma samples were obtained serially for 24 hours to determine the interrelationships among diurnal variations in expression of PDK4 and clock genes and plasma FFA and insulin concentrations. Additionally, we determined the potential mechanisms responsible for PDK4 transcriptional regulation by conducting studies in primary PBMCs and human subcutaneous preadipocytes.
Materials and Methods
Study subjects
Ten women who were overweight participated in this study (Table 1). All subjects had normal oral glucose tolerance and one or fewer metabolic syndrome criteria. Adipose tissue and blood samples analyzed for this study were obtained while subjects participated in a study that involved evaluating diurnal variations in insulin sensitivity (4). Written informed consent was obtained from all subjects before their participation in this study, which was approved by the Institutional Review Board of Washington University School of Medicine.
Study Subject Characteristics (n = 10)
| Characteristic | Value |
| Age, y | 42.3 ± 5.9 |
| Body mass index, kg/m2 | 28.0 ± 1.1 |
| Fat-free mass, kg | 46.1 ± 5.3 |
| Total body fat, % | 40.5 ± 4.6 |
| Visceral adipose tissue volume, cm3 | 524 ± 252 |
| Intrahepatic triglyceride content, % | 1.59 ± 1.51 |
| Glucose, mg/dL | 90.3 ± 5.0 |
| Insulin, mU/L | 7.5 ± 1.1 |
| HOMA-IR | 1.79 ± 0.82 |
| Triglyceride, mg/dL | 70 ± 30 |
| HDL cholesterol, mg/dL | 64 ± 22 |
| LDL cholesterol, mg/dL | 107 ± 44 |
Values are means ± standard deviation.
Abbreviations: HDL, high-density lipoprotein; HOMA-IR, homeostasis model assessment of insulin resistance; LDL, low-density lipoprotein.
PBMC isolation and adipose tissue biopsies
Subjects were admitted to the Clinical Research Unit in the evening the day before the study, consumed a standard dinner at 1800 hours, and fasted until the next morning. At 2100 hours, a Teflon catheter was inserted into a radial artery for blood sampling. Subjects were instructed to sleep at 2200 hours and were awakened between 0530 hours and 0600 hours the next morning. During the day of the study, subjects ingested three identical liquid meals, which were consumed within 20 minutes at 0700 hours (breakfast), 1230 hours (lunch), and 1900 hours (dinner). Each meal comprised 55% of total energy as carbohydrates, 15% as protein, and 30% as fat and contained a third of each subject’s estimated total daily energy requirement, calculated as 1.2 times the measured resting energy expenditure, determined by using a metabolic measurement cart (TrueOne 2400; ParvoMedics, Sady, UT). All meals were prepared in the metabolic kitchen of the Clinical Research Unit. To minimize the impact of physical activity, subjects were asked to rest in bed during the study. Blood samples were obtained through the radial artery catheter every 3 hours from 0600 hours to 0300 hours and at 0500 hours (0600 hours, 0900 hours, 1200 hours, 1500 hours, 1800 hours, 2100 hours, 2400 hours, 0300 hours, 0500 hours) and PBMCs were isolated through a density gradient centrifugation by using the Histopaque-1077 (no. 10771; Sigma-Aldrich, St. Louis, MO). Abdominal subcutaneous adipose tissue samples were obtained every 6 hours (0600 hours, 1200 hours, 1800 hours, 2400 hours). Each abdominal subcutaneous adipose tissue sample was obtained from a different periumbilical quadrant to avoid the potential confounding effects of posttraumatic injury and inflammation on our outcome measures. After the biopsy site was cleaned and sterilized, the skin and underlying tissues were anesthetized by cutaneous and percutaneous injection of 1% lidocaine. Abdominal subcutaneous adipose tissue was aspirated through a 4-mm liposuction cannula (Tulip Medical Products, San Diego, CA) connected to a 30-cc syringe from the periumbilical area. Tissue samples were immediately rinsed with ice-cold saline and frozen in liquid nitrogen until subsequent analyses.
Real-time polymerase chain reaction
Total RNA was isolated from PBMCs, adipose tissue, and cultured primary cells by using RNeasy Mini kit (Qiagen, Valencia, CA) or TRIzol reagent (Invitrogen, Carlsbad, CA). Real-time polymerase chain reaction was performed on clock genes [CLOCK, brain and muscle Arnt-like protein-1 (BMAL1), Period 1 (PER1), Period 2 (PER2), and Rev-ErbA (REV-ERBα)] and PDK4. Gene expression was determined by using an ABI 7500 real-time polymerase chain reaction system (Invitrogen) with SYBR Green or TaqMan (Invitrogen) as we previously described (4, 18). We purchased predesigned TaqMan probes from Invitrogen. Sequences of the primers are provided in Supplemental Table 1. The expression of each gene was normalized to the housekeeping gene, glyceraldehyde-3-phosphate dehydrogenase (GAPDH). All PBMC PDK4 gene expression data are provided in Supplemental Table 2.
Plasma FFA, insulin, cortisol, and glucose concentrations
Plasma FFA was measured as previously described (19). Plasma insulin and cortisol concentrations were measured by using electrochemiluminescence technology (Elecsys 2010; Roche Diagnostics, Mannheim, Germany) (4, 18). Plasma glucose concentration was determined by using an automated glucose analyzer (Yellow Springs Instruments, Yellow Springs, OH).
Primary culture of PBMCs and human subcutaneous preadipocytes
PBMCs were isolated from blood samples obtained from healthy nonobese people (body mass index, 22.7 ± 1.6 kg/m2) after subjects fasted overnight. Isolated PBMCs were immediately cultured in RPMI 1640 medium containing glucose (5 mmol/L), glutamine (2 mmol/L), and 0.5% fatty acid–free, low endotoxin (≤0.1 ng/mg) bovine serum albumin (no. A8806; Sigma-Aldrich) (basal medium). After a 3-hour incubation with the basal medium, cells were treated with basal medium containing physiological concentrations (50 or 250 μmol/L) of fatty acids [palmitate (no. P9767; Sigma-Aldrich)/oleate (no. O7501; Sigma-Aldrich)/linoleate (no. L8134, Sigma-Aldrich), 2:2:1 ratio], physiological (0.1 or 1 nmol/L) or supraphysiological (10 nmol/L) concentrations of insulin, a peroxisome proliferator-activated receptor α (PPAR-α) antagonist GW6471 (10 μmol/L) (no. 4618; Tocris Bioscience, Ellisville, MO), or a combination of them for 3 hours. All culture media were sterilized by using membrane filtration before usage.
Primary human subcutaneous preadipocytes were purchased from Lonza (no. PT-5020; Walkersville, MD). Human preadipocytes were exposed to differentiation medium containing fetal bovine serum (FBS) and other growth factors, such as insulin and dexamethasone (no. PT-8002; Lonza), and differentiated to mature adipocytes according to the manufacturer’s instructions. Differentiated cells were incubated in Dulbecco’s modified Eagle’s medium (no D6046; Sigma-Aldrich) containing 1% FBS and 0.5% fatty acid-free, low endotoxin bovine serum albumin for 24 hours before they were treated with FFAs (250 μmol/L), insulin (10 nmol/L), or both for 3 hours.
Statistical analyses
A Shapiro–Wilk was used to verify normality of the data. One-way repeated measures analysis of variance (ANOVA) was used to evaluate diurnal variations (time effects). A cosinor analysis was performed by using CircWave v1.4 software to assess the diurnal rhythms of PDK4 and clock genes expression. A Spearman correlation coefficient (ρ) was calculated to examine correlations between outcomes of interest. Comparisons among three or more groups were performed by using one-way ANOVA followed by the Tukey post hoc test. Data are presented as mean ± standard error of the mean (SEM). A P value < 0.05 was considered significant.
Results
Diurnal expression pattern of PDK4 in PBMCs is strongly correlated with plasma FFA and insulin concentrations in metabolically healthy people
The expression of clock genes (PER1, PER2, and REV-ERBα) and PDK4 showed distinct diurnal variations in PBMCs obtained from metabolically healthy women (Fig. 1) (P < 0.05, one-way repeated measures ANOVA). PBMC PER2 and PDK4 had robust diurnal rhythms (P < 0.001, cosinor analysis). We found that PBMC PDK4 expression was moderately but significantly correlated with PER2 (ρ = 0.27, P = 0.009) and REV-ERBα (ρ = 0.28, P = 0.008) (Supplemental Fig. 1). Plasma concentrations of FFAs and insulin showed reciprocal diurnal changes during the 24-hour feeding/fasting cycle (Fig. 2A and 2B). Diurnal variations in PBMC PDK4 expression and plasma FFA concentrations were nearly identical (Fig. 2C) and strongly correlated with each other (ρ = 0.86, P < 0.001) (Fig. 2D). Moreover, there was a robust correlation between PBMC PDK4 expression and plasma FFA concentrations in each participant (Supplemental Tables 2 and 3). We found a significant, but weaker, correlation between PBMC PDK4 expression and the inverse values of plasma glucose concentrations (ρ = 0.47, P < 0.001) (Supplemental Fig. 2). PBMC PDK4 expression also correlated strongly with the inverse values of plasma insulin concentrations (ρ = 0.63, P < 0.001) (Fig. 2E and 2F; Supplemental Table 3). Although we found a robust diurnal variation in plasma cortisol concentrations (P < 0.001, one-way repeated measures ANOVA), PBMC PDK4 expression did not correlate with plasma cortisol concentrations (ρ = 0.08, P = 0.43) (Supplemental Fig. 3).

Diurnal expression patterns of clock genes and PDK4 in PBMCs. Gene expression of selected clock genes (CLOCK, BMAL1, PER1, PER2, and REV-ERBα) and PDK4 normalized to GAPDH expression in PBMC obtained from metabolically healthy women (n = 10). Subjects consumed identical meals at 0700 hours, 1230 hours, and 1900 hours. Data are means ± SEM. †P < 0.05, ‡P < 0.001, by one-way repeated measures ANOVA.

Diurnal variation of PBMC PDK4 expression is associated with plasma FFA and insulin concentrations. Plasma FFA (A) and insulin (B) concentrations during 24 hours in metabolically healthy women (n = 10). Arrows indicate PBMC collection. (C and E) Comparisons are shown between diurnal variations in PBMC PDK4 gene expression (red line) and plasma FFA concentrations (blue line) (C) and inverse plasma insulin concentrations (E) (green line). (D and F) Relationships are shown between PBMC PDK4 gene expression and plasma FFA concentrations (D) and inverse values of plasma insulin concentrations (F). Data are means ± SEM. †P < 0.001, assessment over time by one-way repeated measures ANOVA.
FFAs induce PBMC PDK4 gene expression by activating PPAR-α
To determine the mechanism responsible for the observed relationships between PDK4 and plasma FFA and insulin concentrations, we isolated PBMCs from metabolically healthy people and developed a primary human PBMC culture system that included the physiological range of FFA and insulin concentrations. We found that physiological concentrations of FFAs (50 to 250 μmol/L) markedly (∼66-fold) increased PBMC PDK4 gene expression in a dose-dependent manner (Fig. 3A). In contrast, insulin treatment did not affect PBMC PDK4 gene expression at physiological (0.1 or 1 nmol/L) and even supraphysiological (10 nmol/L) concentrations (Fig. 3B). FFA-induced PBMC PDK4 gene expression was inhibited by a PPAR-α antagonist GW6471, but not insulin (Fig. 3C), suggesting that FFAs directly induce PBMC PDK4 gene expression, at least in part through activation of PPAR-α.
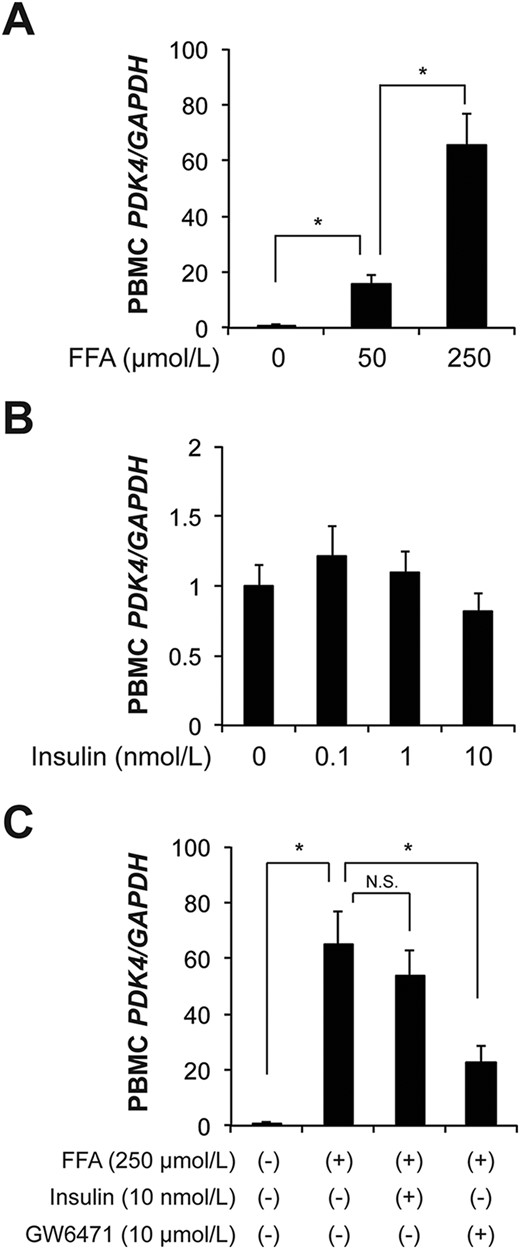
FFAs induce PDK4 gene expression through activation of PPAR-α in primary PBMCs. PDK4 gene expression in PBMCs was isolated from metabolically healthy people after they fasted for ∼12 hours overnight. (A and B) PBMCs were cultured and treated with FFAs (A) or insulin (B) for 3 hours (n = 8 per group). (C) Effects of insulin (10 nmol/L) or a PPAR-α antagonist (10 μmol/L GW6471) on FFA-induced PBMC PDK4 gene expression (n = 7 per group). Data are means ± SEM. *P < 0.01, by using one-way ANOVA followed by the Tukey post hoc test. N.S., not significant.
Adipose tissue PDK4 expression is associated with plasma FFA concentrations and PBMC PDK4 expression
The expression of clock genes (CLOCK, BMAL1, PER1, PER2, REV-ERBα) showed diurnal variations (P < 0.05, one-way repeated measures ANOVA) and rhythms (P < 0.05, cosinor analysis) in subcutaneous adipose tissue (Fig. 4). The antiphase expression patterns of BMAL1 and PER1/PER2 were consistent with those observed in PBMCs (Fig. 1) and the expression patterns of clock genes were also similar to those previously found in human adipose tissue (14, 17). Adipose tissue PDK4 expression also displayed a robust diurnal variation (P < 0.001, one-way repeated measures ANOVA) and rhythm (P = 0.003, cosinor analysis) (Fig. 4). Adipose tissue PDK4 expression correlated with PER1 (ρ = 0.58, P < 0.001) and PER2 (ρ = 0.62, P < 0.001) (Fig. 5A and 5B). There was a stronger positive correlation between adipose tissue PDK4 expression and plasma FFA concentrations (ρ = 0.80, P < 0.001) (Fig. 5C) and between adipose tissue and PBMC PDK4 expression (ρ = 0.84, P < 0.001) (Fig. 5D; Supplemental Table 3). Additionally, we found a significant, but weaker, correlation between adipose tissue PDK4 expression and the inverse values of plasma insulin concentrations (ρ = 0.47, P = 0.002) and plasma cortisol concentrations (ρ = 0.37, P = 0.019) (Fig. 5E and 5F). However, adipose tissue PDK4 expression was not correlated with the inverse values of plasma glucose concentrations (ρ = 0.06, P = 0.71) (Supplemental Fig. 4). Finally, FFAs (250 μmol/L) acutely induced PDK4 expression and insulin (10 nmol/L) partly inhibited FFA-induced, but not basal, PDK4 expression in cultured human subcutaneous adipocytes (Fig. 5G). Taken together, these results suggest that diurnal variation in adipose tissue PDK4 expression is, at least in part, regulated by plasma FFA availability.
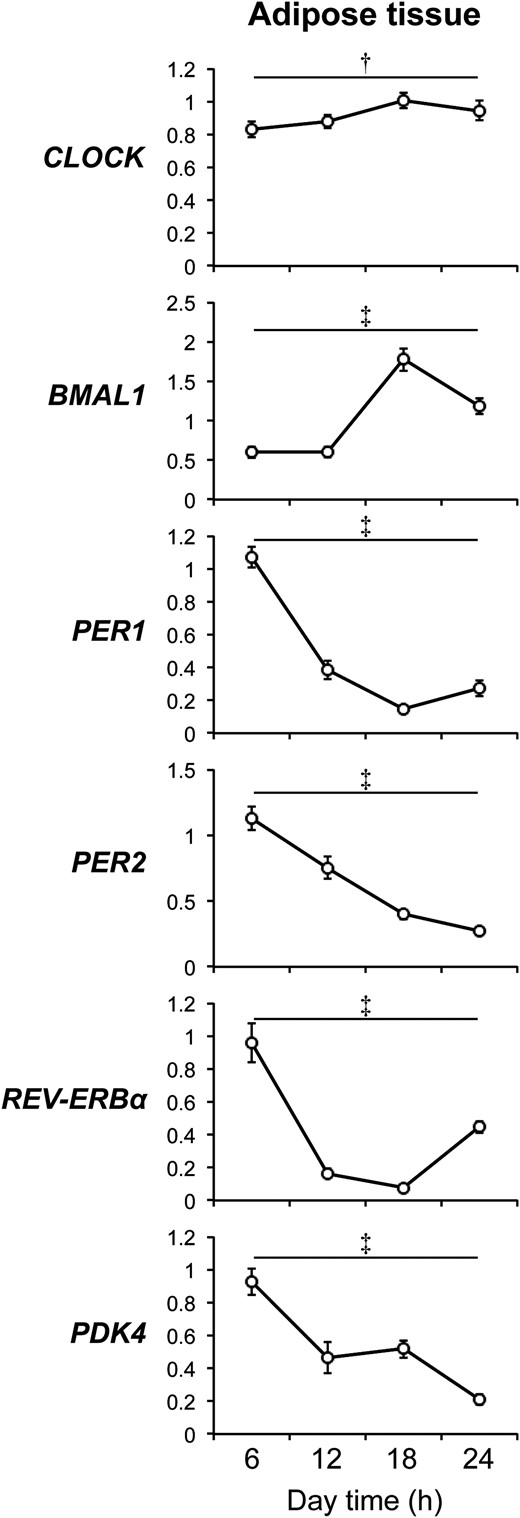
Diurnal expression patterns of clock genes and PDK4 in adipose tissue. Gene expression of selected clock genes (CLOCK, BMAL1, PER1, PER2, and REV-ERBα) and PDK4 normalized to GAPDH expression in subcutaneous adipose tissue obtained from metabolically healthy women (n = 10). Data are means ± SEM. †P < 0.05, ‡P < 0.001, by using one-way repeated measures ANOVA.
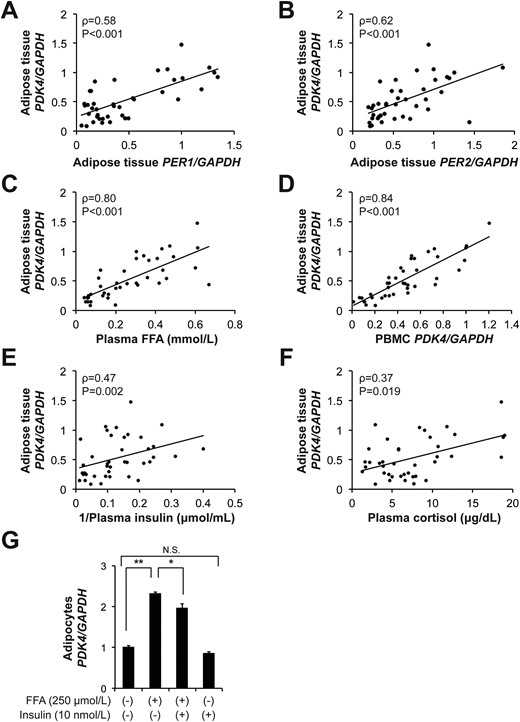
Adipose tissue PDK4 gene expression is associated with plasma FFA concentrations and PBMC PDK4 gene expression. (A–F) Relationship between adipose tissue PDK4 gene expression and adipose tissue PER1 (A) and PER2 (B) gene expression, plasma FFAs (C), PBMC PDK4 gene expression (D), plasma insulin (E), and cortisol concentrations (F). (G) PDK4 gene expression in differentiated human subcutaneous adipocytes treated with FFA (250 μmol/L), insulin (10 nmol/L), or both for 3 hours (n = 3 per group). Data are means ± SEM. *P < 0.05, **P < 0.001, by using one-way ANOVA followed by the Tukey post hoc test. N.S., not significant.
Discussion
The results from this study demonstrate that PDK4, a key mitochondrial enzyme involved in fuel switching between glucose and FFA, oscillates in PBMCs and adipose tissue in metabolically healthy people. Moreover, the diurnal expression patterns of PDK4 were significantly correlated with plasma FFA and insulin concentrations as well as clock genes. Data obtained from primary cell culture experiments demonstrated that FFAs induce PDK4 transcription, at least in part through PPAR-α signaling. Although several circulating hormones are known to affect PDK4 expression, such as growth hormone (20, 21), thyroid hormone (22), glucocorticoid (23, 24), adiponectin (25), and epinephrine (26), our results suggest that plasma FFA availability is a key regulator of diurnal variation of PDK4 during normal 24-hour fed and fasted conditions. These findings demonstrate a novel interaction between plasma FFA concentrations and diurnal variations in cellular gene expression of factors that regulate FFA metabolism in people, and they underscore the importance of plasma FFA availability in regulating whole-body and cellular substrate metabolism.
Our findings are consistent with data from previous studies conducted in healthy people that found that PDK4 expression is induced during experimental conditions that increase plasma FFA concentrations, such as a lipid emulsion infusion (27), starvation (28, 29), and high-fat diet feeding (30, 31). Additionally, FFA-induced PDK4 expression is likely mediated by PPAR-α in PBMCs, which is consistent with the results from previous studies that found that PDK4 expression is induced by the selective PPAR-α ligand WY-14643 in human PBMCs (32). However, in contrast to the profound inhibitory effect of insulin on PDK4 expression in human skeletal muscle (30, 33), we found that insulin had a minimal effect on PDK4 expression in cultured PBMCs and adipocytes. The mechanism responsible for these apparent differences is not known, but it could involve cell type–specific differences in PDK4 transcriptional regulation. Indeed, it was reported that PPARα-independent activation of PDK4 transcription involves the estrogen-related receptor-α/peroxisome proliferator-activated receptor γ coactivator-1 pathway in myoblasts but not in hepatocytes (34). Therefore, postprandial insulin secretion could inhibit PDK4 expression in a tissue-specific manner, contributing to the diurnal alterations in whole-body substrate metabolism during the normal fed–fasted cycle. However, we cannot exclude the possibility that our primary culture system does not accurately reflect in vivo conditions and that the presence of insulin or FBS during the adipocyte differentiation process dilutes the effect of insulin on PDK4 expression in mature adipocytes.
Emerging evidence from mouse models has suggested that clock genes regulate FFA metabolism by modulating transcription of key metabolic enzymes, including Pdk4 (1, 9–11). We found that expression of clock genes, such as PER1, PER2, and REV-ERBα, correlated with PDK4 expression in PBMCs and adipose tissue, although these relationships were weaker than those between plasma FFA concentrations and PDK4 expression. These findings indicate that peripheral clock genes could be involved in regulating diurnal variations in PDK4 and FFA metabolism in people. Additionally, we found that adipose tissue PDK4 expression correlated with plasma cortisol concentrations, suggesting that the central circadian clock could also be involved in regulating the diurnal variation of PDK4 expression in some peripheral organs. A limitation of our study is that we did not use a constant routine protocol, which would have allowed an assessment of the endogenous component of circadian rhythms without environmental influences (35), because we specifically chose to evaluate metabolic outcomes in a real world setting. We cannot exclude the possibility that timing of meals and sampling in relationship to waking time varied among subjects, or that subjects experienced sleep deprivation during the study, which could have potentially affected expression of clock genes. Therefore, it is possible that endogenous expression rhythms of clock genes are more tightly linked to the metabolic regulators, including PDK4 expression and FFA metabolism during constant feeding and lighting conditions. Additional studies are needed to determine whether misalignment of fasting–feeding or sleep–awake cycles with endogenous circadian rhythms affects diurnal variations of PDK4 expression and its relationship with FFA metabolism.
In this study, we analyzed the expression of clock genes and PDK4 in circulating PBMCs, because frequent sampling is required to evaluate the full dynamics of diurnal variation in cellular function, which is not possible with tissue biopsies because of the burden on study participants. Our results demonstrate that diurnal expression patterns of PDK4 in PBMCs are significantly correlated with those in adipose tissue. Additionally, PDK4 gene expression patterns observed in PBMCs and adipose tissue found in the present study are consistent with the expression pattern observed in skeletal muscle samples that we reported previously (4). Taken together, these results suggest that PBMCs can provide an accessible surrogate for other tissues to investigate the diurnal variations in cellular events involved in regulating substrate metabolism.
In summary, the results from the present study suggest that plasma FFA availability is an important physiological regulator of diurnal expression patterns of PDK4 in both PBMCs and adipose tissue. These findings demonstrate the importance of interaction among organ systems in regulating metabolic function and energy homeostasis in people. Additional studies that involve a systems biology approach are needed to determine whether the interrelationships among diurnal rhythms of clock genes, metabolic genes, and circulating metabolites are altered in people who have metabolic dysfunction, such as those with insulin resistance and type 2 diabetes.
Abbreviations:
- ANOVA
analysis of variance
- BMAL1
brain and muscle Arnt-like protein-1
- FBS
fetal bovine serum
- FFA
free fatty acid
- GAPDH
glyceraldehyde-3-phosphate dehydrogenase
- PBMC
peripheral blood mononuclear cell
- PDK4
pyruvate dehydrogenase kinase 4
- PER1
Period 1
- PER2
Period 2
- PPAR-α
peroxisome proliferator-activated receptor α
- SEM
standard error of the mean.
Acknowledgments
The authors thank Jennifer Shew and Freida Custodio for technical assistance; Janine Kampelman, Melisa Moore, Kathryn Gratza, and the staff of the Clinical Research Unit for help in performing the studies; and the study subjects for their participation.
Financial Support: This study was supported by National Institute of Diabetes and Digestive and Kidney Diseases Grant DK56341 (to S.K., Nutrition and Obesity Research Center), National Center for Advancing Translational Sciences Grant UL1 TR000450 (KL2 Career Developmental Award to J.Y.), and Central Society for Clinical and Translational Research Early Career Development Award (to J.Y.). S.Y. was supported by the Sumitomo Life Welfare and Culture Foundation.
Clinical Trial Information: ClinicalTrials.gov nos. NCT02011581 (registered 9 December 2013) and NCT02093572 (registered 18 March 2014).
Author Contributions: S.Y. was involved in designing and conducting in vitro experiments, sample processing, and data analysis. A.C.M. was involved in tissue sample processing and data analysis. P.A.-V. conducted the metabolic studies and data analysis. K.L.S. and M.P.F. were involved in sample processing and data analysis. A.L.O. and B.W.P. contributed to plasma sample processing and data analysis. S.K. obtained funding for the studies and was involved in conducting the metabolic studies and data analysis. All authors reviewed and edited the manuscript. J.Y. is the guarantor of this work and, as such, had full access to all the data in the study and takes responsibility for the integrity of the data and the accuracy of the data analysis.
Disclosure Summary: The authors have nothing to disclose.
References
Author notes
These authors contributed equally to this study.
