


Abstract
Nonalcoholic fatty liver disease is very frequent in type 2 diabetes, with increased risk of further development of liver fibrosis. Animal studies have shown that GLP-1 receptor agonists may reduce liver lipogenesis. However, data in humans are scarce.
To study the effect of liraglutide 1.2 mg/d on liver fat content (LFC) in patients with uncontrolled type 2 diabetes and to evaluate the factors potentially associated with liraglutide-induced modification of LFC.
LFC was measured by proton magnetic resonance spectroscopy before and after 6 months of liraglutide treatment in 68 patients with uncontrolled type 2 diabetes mellitus.
Liraglutide 1.2 mg/d.
Change in LFC.
Treatment with liraglutide was associated with a significant decrease in body weight, HbA1C, and a marked relative reduction in LFC of 31% (P < 0.0001). No significant modification of LFC was observed in a parallel group of patients 6 months after intensification of the antidiabetic treatment with insulin. The reduction in LFC and body weight were highly correlated (r = 0.490; P < 0.0001). In multivariate analysis, the reduction in LFC was independently associated with baseline LFC (P < 0.0001), age (P = 0.010), and reduction in body weight (P < 0.0001), triglycerides (P = 0.019), and HbA1c (P = 0.034). In the patients who had no significant decrease in body weight, no significant reduction in LFC was observed.
Six months of treatment with liraglutide 1.2 mg/d significantly reduced LFC in patients with inadequately controlled type 2 diabetes and this effect was mainly driven by body weight reduction. Further studies are needed to confirm that this reduction in LFC may significantly reduce fibrosis progression.
Nonalcoholic fatty liver disease (NAFLD) is commonly associated with type 2 diabetes and increases the risk for the development of nonalcoholic steatohepatitis (NASH), cirrhosis, and hepatocellular carcinoma (1). Glucagon-like peptide 1 (GLP1) analogs are antidiabetic agents that have been shown to improve liver histology in animal models of NASH (2–5). Some animal and in vitro data suggest a possible direct effect of GLP1 agonists on hepatocytes. They have been shown to reduce fatty acid accumulation, diminish endoplasmic reticulum stress, promote autophagy, and regulate the activity of enzymes involved in fatty acid metabolism, such as Δ-5 desaturase (2, 6, 7).
GLP1 agonists have been reported to significantly decrease liver enzyme levels in patients with type 2 diabetes (8, 9). A reduction of liver fat content (LFC) with liraglutide is suggested by improvement of indirect indicators of steatosis (liver-to-spleen attenuation ratio or liver-to-kidney ratio) in some studies (10, 11). However, data on the effect of GLP1 agonists on LFC, using standard reference methods for evaluation of LFC, are scarce. In a series of 8 patients with type 2 diabetes and NAFLD confirmed by examination of biopsy specimens, an improvement in liver histology was observed in 3 patients after 28 weeks of treatment with exenatide (12). In the Liraglutide Efficacy and Action in NASH (LEAN) study, liraglutide 1.8 mg/d for 48 weeks was shown in liver biopsy specimens to induce a greater resolution of NASH and attenuate the evolution to fibrosis, as compared with placebo, in 26 patients with NASH, including 9 patients with type 2 diabetes. In the LEAN-J study (i.e., the LEAN study in Japanese patients), 10 patients with NASH, confirmed by evaluation of biopsy specimens, and glucose intolerance underwent a second liver biopsy 96 weeks after the initiation of treatment with liraglutide. Specimen examination showed decreased histological inflammation (13). A significant reduction in LFC, assessed by proton spectroscopy, has been reported in a study performed in obese patients with type 2 diabetes treated with GLP1 agonists, including only 6 patients on liraglutide (14). In a recent study, performed with 18 patients with type 2 diabetes, no significant decrease in LFC, assessed by proton spectroscopy, was observed after 12 weeks of treatment with liraglutide 1.8 mg/d (15).
Thus, data on the effect of the GLP1-agonist, liraglutide, on NAFLD are limited. Because most of the few studies available included patients who did not have diabetes, the real effect of the usual treatment with liraglutide on LFC in patients with type 2 diabetes is still unclear.
This prompted us to perform a prospective study to analyze the effect of liraglutide at a dose of 1.2 mg/d for 6 months on LFC evaluated by proton spectroscopy, which is the reference method, and to evaluate the factors that may be associated with liraglutide-induced modification of LFC in a substantial number of patients with inadequately controlled type 2 diabetes, corresponding to a clinical indication for the use of liraglutide.
Patients and Methods
This prospective, single-center study was approved by our regional ethics committee and written informed consent was obtained from all patients before study inclusion (ClinicalTrials.gov no. NCT02721888).
Patients
In this study, we included patients with type 2 diabetes treated with metformin and/or sulfonylurea (or glinides) and/or insulin, for whom treatment with liraglutide was indicated because of poorly controlled diabetes (HbA1c >7%). Exclusion criteria were severe hepatic impairment [aspartate aminotransferase (AST) or alanine aminotransferase (ALT) levels >3 times the upper limit of normal] or renal function (creatinine clearance <30 mL/min). Patients with alcohol and/or drug abuse, treatment with dipeptidyl peptidase 4 (DPP4) inhibitors during the 3 previous months, or previous treatment with thiazolidinediones or any GLP1 agonists were also excluded.
The results obtained with liraglutide in this study were compared with those of 16 patients with uncontrolled type 2 diabetes included in a parallel study performed in our center, in which evaluation of LFC was performed by proton spectroscopy before and 6 months after intensification of the antidiabetic treatment with insulin (ClinicalTrials.gov no. NCT02048189).
Study design
At baseline, all patients in the study had a physical examination; fasting blood sampling for biological measurements, including liver enzymes [AST, ALT, gamma glutamyl transferase (GGT)], fasting blood glucose, plasma lipids [triglycerides, high-density lipoprotein (HDL) cholesterol (HDL-C), low-density lipoprotein-cholesterol (LDL-C)] and HbA1c; abdominal magnetic resonance imaging (MRI) to assess visceral and subcutaneous fat; and proton magnetic resonance spectroscopy to accurately measure LFC.
The following day, treatment with liraglutide was started at 8:00 am at an initial dose of 0.6 mg/d, which was uptitrated to 1.2 mg/d after 1 week. This 1.2 mg/d dose was maintained throughout the study.
All the patients included in the study had received, at baseline, dietary advice from a dietitian and physical advice from a nurse according to the standards of medical care in diabetes (16). Overweight patients were advised to reduce calorie intake on an individual basis, and in all patients, a fat intake less than 35%, rich in monounsaturated fat, was recommended. All patients were advised to exercise for at least 3 days per week for a total of at least 150 minutes over the course of the week.
After 6 months of treatment with liraglutide, all patients had a follow-up evaluation with a physical examination; fasting blood sampling for biological measurements, including liver enzymes (AST, ALT, GGT), fasting blood glucose, plasma lipids (triglycerides, HDL-C, LDL-C), and HbA1c; abdominal MRI to assess visceral and subcutaneous fat; and proton magnetic resonance spectroscopy to accurately measure LFC.
Liver fat content
LFC of the subjects was obtained using a 3.0 Tesla Magnetom TRIO TIM whole body system (Siemens, Erlangen, Germany), as previously described (17). Hepatic steatosis was defined as LFC ≥5.5% (18, 19).
Visceral and abdominal fat
Intra-abdominal and subcutaneous fat areas were assessed in each patient by MRI at the level of the L4-L5 intervertebral disc (20).
Analytical procedures
Fasting plasma glucose, triglyceride, HDL-C, LDL-C, and plasma liver enzyme levels were determined by standard procedures. HbA1c was measured by high-performance liquid chromatography (Variant II; Biorad, Richmond, CA). The plasma adiponectin concentration was determined using an enzyme immunoassay kit (Quantikine; R&D, Systems, Minneapolis, MN).
Statistical analysis
Data are reported as mean ± standard deviation (SD). Statistical calculations were performed using the SPSS software package (IBM Corp., Armonk, NY). The paired t test was used for comparisons of data between baseline and after 6 months of liraglutide treatment. The Pearson correlation coefficients (r) were determined by linear regression analysis. Statistical significance of the correlation coefficients was determined by the method of Fisher and Yates. Multivariate analyses were performed by stepwise multivariate linear regression. A 2-tailed probability level of 0.05 was accepted as statistically significant.
Results
Baseline characteristics of the patients
Of the 80 patients included in the study, 68 completed the study. The 12 patients who did not complete the study were 4 patients who were not able to undergo MRI due to claustrophobia, 6 patients who stopped the treatment with liraglutide because of gastrointestinal side effects that occurred during the initial period of the study, and 2 patients who stopped for personal reasons. Adherence to therapy and dietary and physical activity was checked at 3 and 6 months and was considered good in the 68 patients who completed the study. The baseline characteristics of the 68 patients who completed the study are shown in Table 1. They showed the typical features of type 2 diabetes: increased body mass index (BMI), elevated plasma triglycerides levels, and low HDL-C values. The mean LFC of the studied population was elevated (17.3% ± 10.9%) and 57 patients (84%) had NAFLD defined as LFC ≥5.5%.
Clinical, Biological, and Anatomical Characteristics of the Patients at Baseline and After 6 Months of Treatment With Liraglutide
| Characteristic | Values at Baseline | Values After 6 Months of Liraglutide Treatment | P |
|---|---|---|---|
| Sex, M/F, no. | 37/31 | ||
| Age, mean ± SD, y | 56.9 ± 11.3 | ||
| Diabetes duration, mean ± SD, y | 11.0 ± 8.7 | ||
| Antidiabetic treatment, no. (%) | |||
| Metformin | 61 (90) | ||
| Sulfonylurea or glinide | 41 (60) | ||
| Insulin | 14 (21) | ||
| Body weight, mean ± SD, kg | 99.5 ± 19.6 | 95.9 ± 19.2 | <0.0001 |
| BMI, mean ± SD, kg/m2 | 35.9 ± 6.8 | 34.7 ± 6.8 | <0.0001 |
| HbA1c, mean ± SD, % | 9.8 ± 2.1 | 7.3 ± 1.1 | <0.0001 |
| ALT level, mean ± SD, UI/L | 45.9 ± 23.8 | 39.5 ± 16.6 | 0.021 |
| AST level, mean ± SD, UI/L | 25.0 ± 12.3 | 23.5 ± 10.9 | NS |
| GGT level, mean ± SD, UI/L | 70.8 ± 91.5 | 46.0 ± 30.7 | 0.017 |
| LDL-C level, mean ± SD, mmol/L | 2.57 ± 0.89 | 2.38 ± 0.85 | NS |
| HDL-C level, mean ± SD, mmol/L | 1.08 ± 0.33 | 1.20 ± 0.43 | 0.004 |
| Triglyceride level, mean ± SD, mmol/L | 2.46 ± 1.86 | 1.90 ± 1.35 | 0.004 |
| Adiponectin level, mean ± SD, μg/L | 3216 ± 2687 | 4272 ± 2398 | <0.0001 |
| Liver fat content, mean ± SD, % | 17.3 ± 10.9 | 11.9 ± 9.3 | <0.0001 |
| Visceral fat area, mean ± SD, cm2 | 254 ± 101 | 223 ± 105 | 0.005 |
| Subcutaneous fat area, mean ± SD, cm2 | 384 ± 160 | 358 ± 155 | 0.009 |
Abbreviation: NS, not significant.
Effects of 6 months of treatment with liraglutide 1.2 mg/d
The modifications in the clinical and biological parameters after 6 months of treatment with liraglutide are shown in Table 1. After 6 months of treatment with liraglutide at a dose of 1.2 mg/d, we observed a significant decrease in mean HbA1c (from 9.8% ± 2.1% to 7.3% ± 1.1%; P < 0.0001); in mean body weight (from 99.5 kg ± 19.6 kg to 95.9 kg ± 19.2 kg; P < 0.0001); in mean BMI (from 35.9 ± 6.8 kg/m2 to 34.7 kg/m2 ± 6.8 kg/m2; P < 0.0001); in mean visceral fat area (from 254 cm2 ± 101 cm2 to 223 cm2 ± 105 cm2; P = 0.005); in mean subcutaneous fat area (from 384 cm2 ± 160 cm2 to 358 cm2 ± 155 cm2; P = 0.009); in mean ALT level (from 45.9 UI/L ± 23.8 UI/L to 39.5 UI/L ± 16.6 UI/L; P = 0.021), in mean GGT level (from 70.8 UI/L ± 91.5 UI/L to 46.0 UI/L ± 30.7 UI/L; P = 0.017); and in mean plasma triglyceride level (from 2.46 mmol/L ± 1.86 mmol/L to 1.90 mmol/L ± 1.35 mmol/L; P = 0.004); as well as a significant increase in mean HDL-C level (from 1.08 mmol/L ± 0.33 mmol/L to 1.20 mmol/L ± 0.43 mmol/L; P = 0.004), and in plasma adiponectin level (from 3216 μg/L ± 2687 μg/L to 4272 μg/L ± 2398 μg/L; P < 0.0001).
As shown in Figure 1, a significant reduction in LFC was observed after 6 months of treatment with liraglutide 1.2 mg/d (from 17.3% ± 10.9% to 11.9% ± 9.3%; P < 0.0001), corresponding to a mean 31% relative decrease in LFC. Among the 57 patients with NAFLD at baseline, LFC decreased by 33% (from 20.1% to 13.5%; P < 0.0001). In the 38 patients who had both normal ALT and normal GGT levels at baseline, LFC decreased significantly after liraglutide treatment (from 14.6% ± 10.8% to 10.2% ± 9.3%; P < 0.0001).
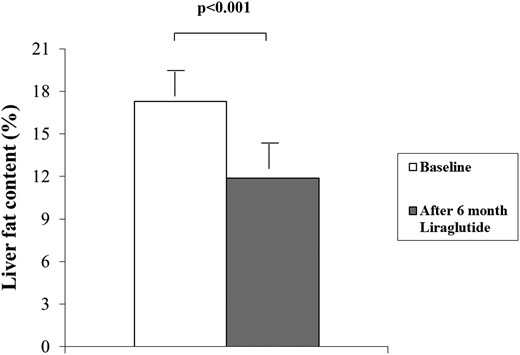
Liver fat content in patients with type 2 diabetes before and 6 months after the initiation of liraglutide treatment.
We compared the results obtained with liraglutide on LFC with those obtained in a group of 16 patients with type 2 diabetes showing similar baseline characteristics (mean BMI, 35.2 kg/m2; mean HbA1c, 9.3%) and who had measurement of LFC by proton spectroscopy at baseline and 6 months after intensification of the antidiabetic treatment with insulin. In these patients, intensification of the antidiabetic treatment with insulin induced a significant decrease in HbA1c (from 9.3% ± 1.6% to 8.5% ± 1.5%; P = 0.018) but no significant change in body weight (97.4 kg ± 19.4 kg to 98.2 kg ± 18.8 kg; P = 0.45) or in LFC (9.6% ± 10.8% to 8.4% ± 8.3%; P = 0.49).
Correlations between decrease in LFC and modifications in clinical, anatomical, and biological parameters
The correlations between decrease in LFC and modifications in clinical, anatomical, and biological parameters after 6 months of treatment with liraglutide are shown in Table 2. The reduction in LFC correlated significantly with the reduction in body weight, and in AST, ALT, and triglyceride levels, and in HbA1c value. As shown in Figure 2, the correlation between the reduction in LFC and the reduction in body weight was highly significant (r = 0.490; P < 0.0001).
Correlations Between Decrease in Liver Fat Content and Modifications in Clinical, Anatomical, and Biological Parameters After 6 Months of Liraglutide Treatment
| Change in Levels of: | LFC | HbA1c | AST | ALT | GGT | Triglycerides | LDL-C | HDL-C | Body Weight | Visceral Fat | Subcutaneous Fat | Adiponectin |
|---|---|---|---|---|---|---|---|---|---|---|---|---|
| LFC | 1 | 0.261a | 0.526b | 0.500b | 0.223 | 0.301a | 0.214 | −0.001 | 0.490b | 0.220 | 0.212 | 0.105 |
| HbA1c | 1 | 0.289a | 0.382c | 0.456b | 0.371c | 0.154 | −0.093 | 0.301a | 0. 013 | 0.008 | −0.061 | |
| AST | 1 | 0.630b | 0.274a | 0.289a | −0.016 | −0.088 | 0.496b¶ | 0.117 | 0.220 | 0.104 | ||
| ALT | 1 | 0.397d | 0.162 | −0.073 | −0.078 | 0.381c | 0.196 | 0.270a | 0.178 | |||
| GGT | 1 | 0.041 | −0.036 | −0.071 | 0.268a | 0.022 | 0.267a | −0.051 | ||||
| Triglycerides | 1 | 0.253a | −0.040 | 0.245a | 0.224 | −0.010 | 0.187 | |||||
| LDL-C | 1 | −0.082 | 0.068 | 0.211 | 0.148 | −0.067 | ||||||
| HDL-C | 1 | −0.059 | 0.121 | −0.010 | −0.043 | |||||||
| Body weight | 1 | 0.299a | 0.381c | −0.068 | ||||||||
| Visceral fat | 1 | 0.332c | −0.029 | |||||||||
| Subcutaneous fat | 1 | −0.069 | ||||||||||
| Adiponectin | 1 |
P < 0.05.
P ≤ 0.0001.
P ≤ 0.01.
P ≤ 0.001.
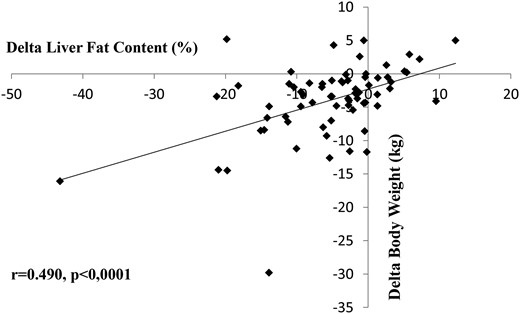
Correlation between reduction in liver fat content and reduction in body weight.
Independent predictors of LFC decrease in patients receiving liraglutide
We analyzed the association between the variation in LFC and the variation in other clinical and biological parameters in patients receiving liraglutide. For this purpose, we performed a multivariate analysis by introducing into the statistical model the variations that correlated with the decrease in LFC with a P value ≤ 0.10 as well as potential confounding factors such as age and sex. The reduction in LFC was independently and significantly associated with the reduction in body weight (P < 0.0001), the reduction in plasma triglyceride levels (P = 0.004), and the reduction in HbA1c (P = 0.014; Table 3). These 3 variables explained 49% of the variance of LFC reduction. Reduction in body weight explained the larger part of the variance (28%), whereas reduction in HbA1c explained only 7%. The results of the multivariate analysis were similar when the antidiabetic treatment (i.e., metformin, sulfonylurea or glinide, insulin) was introduced into the model.
Multivariate Analysis Without Baseline LFC in the Modela
| Variables | β | t | P | r2b | Δ r2 |
|---|---|---|---|---|---|
| Δ Body weight | 0.433 | 4.127 | <0.0001 | 0.28 | |
| Δ Triglyceride level | 0.319 | 3.024 | 0.004 | 0.42 | 0.14 |
| Δ HbA1c | 0.276 | 2.559 | 0.014 | 0.49 | 0.07 |
| Sex | −0.24 | −1.154 | 0.254 | — | — |
| Age | −0.057 | −0.550 | 0.585 | — | — |
| Δ Subcutaneous fat level | 0.036 | 0.318 | 0.752 | — | — |
| Δ LDL-C level | 0.027 | 0.247 | 0.806 | — | — |
| Δ Visceral fat level | 0.011 | 0.101 | 0.752 | — | — |
Abbreviations: —, not applicable; β, standardized coefficient; Δ, change in.
Statistically significant variables are shown in bold.
Total r2 = 0.49.
Because we found a significant correlation between the reduction in LFC and baseline LFC (r = 0.574; P < 0.0001), we performed an additional multivariate analysis with baseline LFC included in the model. In this multivariate analysis, the reduction in LFC was independently and significantly associated with baseline LFC (P < 0.0001), the reduction in body weight (P < 0.0001), age (P = 0.010), the reduction in plasma triglyceride levels (P = 0.019), and the reduction in HbA1c (P = 0.034; Table 4). These 5 variables explained 74% of the variance of LFC reduction. When the variable “baseline LFC” was replaced by the variable “NAFLD at baseline” in the multivariate analysis, the reduction in LFC was independently and significantly associated with the reduction in body weight (P < 0.0001), the reduction in plasma triglyceride levels (P = 0.003), NAFLD at baseline (P = 0.009), and the reduction in HbA1c (P = 0.048).
Multivariate Analysis With Baseline LFC In the Modela
| Variables | β | t | P | r2b | Δ r2 |
|---|---|---|---|---|---|
| Baseline LFC | 0.559 | 6.685 | <0.0001 | 0.43 | |
| Δ Body weight | 0.388 | 5.049 | <0.0001 | 0.62 | 0.19 |
| Age | −0.210 | -2,682 | 0.010 | 0.67 | 0.05 |
| Δ Triglyceride level | 0.194 | 2.438 | 0.019 | 0.71 | 0.04 |
| Δ HbA1c | 0.174 | 2.181 | 0.034 | 0.74 | 0.03 |
| Δ LDL-C level | 0.083 | 1.012 | 0.317 | — | — |
| Δ Subcutaneous fat level | 0.079 | 0.955 | 0.345 | — | — |
| Sex | −0.018 | −0.223 | 0.824 | — | — |
| Δ Visceral fat level | 0.014 | 0.167 | 0.868 | — | — |
Abbreviations: —, not applicable; β, standardized coefficient; Δ, change in.
Statistically significant variables are shown in bold.
Total r2 = 0.74.
Influence of liraglutide on LFC according to body weight reduction
To more precisely study the influence of liraglutide on LFC according to body weight reduction, the patients were separated into 3 tertiles according to their body weight modification. In the first tertile, in which mean body weight modification was not significant (baseline, 102.7 kg ± 19.7 kg; after 6 months of liraglutide treatment, 103.6 kg ± 20.3 kg), liver fat reduction was not significant (from 18.1% ± 10.6% to 17.3% ± 10.7%; P = 0.56; Figure 3). On the contrary, in the second tertile, in which body weight decrease with liraglutide treatment was significant (from 90.6 kg ± 15.6 kg to 87.6 kg ±15.7; P < 0.0001) and in the third tertile, in which body weight decrease was much more important (from 105.4 kg ± 20.6 kg to 95.8 kg ± 18.8 kg; P < 0.0001), liver fat reduction was highly significant (from 16.8% ± 11.5% to 12.0% ± 8.5%, P = 0.003 for tertile 2; from 17.0% ± 11.1% to 6.9% ± 4.9%, P < 0.0001 for tertile 3; Fig. 3).
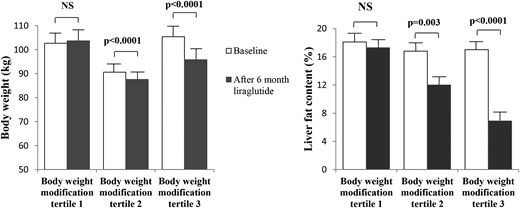
Body weight reduction and liver fat content reduction with liraglutide treatment in patients with type 2 diabetes, according to the tertile of body weight modification. NS, not significant.
Discussion
In this study in 68 patients with type 2 diabetes, we showed that liraglutide prescribed for uncontrolled diabetes at a dose of 1.2 mg/d for 6 months induced a significant 31% relative reduction in LFC, assessed by proton spectroscopy, which is the reference noninvasive method. We also showed that the reduction in LFC induced by liraglutide was strongly associated with body weight reduction, which seemed to be the main factor driving the liraglutide-induced liver fat reduction.
So far, the effect of liraglutide treatment on LFC has never been evaluated in a substantial number of patients with type 2 diabetes. The LEAN study, which analyzed the effect of liraglutide at 1.8 mg/d for 48 weeks, was performed in 26 patients with NASH, but included only 9 patients with type 2 diabetes (13). In the Japanese LEAN-J study, no patients with type 2 diabetes were studied (21). In the study performed by Cuthbertson et al. (14), only 6 patients were treated with liraglutide. The recently reported Canadian study included only 18 patients with type 2 diabetes (15). In our study, we chose a dose of 1.2 mg/d of liraglutide, which corresponds to the most frequently prescribed dose (22). This 1.2 mg/d dose of liraglutide was not used in the 2 studies that analyzed the effect of liraglutide on LFC in series that included patients with type 2 diabetes (15).
Our results are different from those of Tang et al. (15), who found no significant reduction in LFC in a group of 18 patients with type 2 diabetes after 3 months of treatment with liraglutide at a dose of 1.8 mg/d. We do not think that the discrepancy between our study and that of Tang et al. is due to a shorter time (i.e., 3 months) in that study, because LFC reduction has been observed over a short time (e.g., within 4 weeks with caloric restriction or exercise) (23). We think that the absence of LFC reduction with liraglutide in the study performed by Tang et al. may be partly due to the limited weight loss in their study as compared with ours and the study by Armstrong et al. (13) in which the patients lost 6 kg and had a reduction in liver fat. In addition, the discrepancy between our results and those of Tang et al. may also be due to different patients’ baseline characteristics (i.e., significantly lower HbA1c, lower fasting triglyceride levels, and lower fat content in the patients in that study).
The main difference between the 2 studies was the duration of the liraglutide treatment, which was 6 months in our study and only 3 months in the study of Tang et al. (15). This suggests that 3 months of treatment may be too short to observe any effect of liraglutide on LFC.
The beneficial effect of liraglutide on LFC observed in our study is not likely to be due to confounding factors such as quality of patient care, or counseling or diet offered by the team. It seems to be a specific effect of the liraglutide treatment because we did not see any reduction in LFC in patients who showed significant decrease in HbA1c after intensification of the antidiabetic treatment with insulin.
The effect of 6 months of treatment with liraglutide 1.2 mg/d on liver fat is impressive, with a relative 33% reduction in LFC among patients with diabetes who had NAFLD at baseline. This effect was associated with a significant improvement in liver enzyme levels. This positive effect of liraglutide on liver fat is likely to be clinically relevant, particularly in patients with NAFLD. Such a marked decrease in LFC was shown in patients with diabetes who had NASH, confirmed by examination of biopsy specimens, after 6 months of treatment with pioglitazone, another antidiabetic agent of the thiazolidinedione class, at a dose of 45 mg/d (24). However, thiazolidinediones have a negative effect on body weight, which is not the case with liraglutide.
Our results in humans are in accordance with in vitro and in vivo animal studies, which showed a decrease in LFC with GLP1 or GLP1 receptor agonists (3, 5, 25). In an animal model, exendin-4 reversed hepatic steatosis in ob/ob mice (3).
One important finding of our study was that body weight reduction was a significant factor driving the reduction in LFC in patients receiving liraglutide. Body weight reduction has been shown to induce a significant decrease in LFC in several studies. In a study performed in patients with histologically proven NASH, body weight reduction through lifestyle modifications induced significant improvements in the histological features of NASH, and these improvements were independently associated with the degree of weight loss (26). In addition, massive weight reduction following bypass surgery has been shown to be associated with a marked improvement in liver steatosis, including a pronounced reduction in inflammation and fibrosis (27). In a study performed in 8 obese patients with type 2 diabetes, a significant reduction in LFC, assessed by proton spectroscopy, was observed after a mean weight loss of 8 kg while on a hypocaloric diet (28). Moreover, a reduction in liver enzyme levels has been shown to be associated with body weight reduction during treatment with orlistat (29) or SGLT2 inhibitors (30, 31). The fact that body weight reduction in patients on liraglutide is a major factor driving LFC reduction is supported by the nonsignificant reduction in LFC among patients who had no significant decrease in body weight (i.e., patients belonging to the first tertile of body weight modification). This does not rule out a possible direct effect of liraglutide on liver fat but suggests that if liraglutide does have a direct effect on liver fat in humans, it is likely to be modest.
Data from our multivariate analyses indicate that the reduction in LFC in patients receiving liraglutide was independently associated with the reduction in body weight and in HbA1c. It is interesting to note that in the meta-analysis of the Liraglutide Effect and Action in Diabetes (LEAD) studies, the reduction in liver enzyme levels in patients receiving liraglutide was associated with a reduction in both body weight and HbA1c (8). The association between the reduction in LFC and the reduction in HbA1c is another important finding of our study, because it is in accordance with the association between the reduction in liver enzyme levels and the improvement in glycemic control reported in the meta-analysis of the LEAD studies (8). It has been demonstrated that liver de novo lipogenesis is stimulated by carbohydrate-responsive element-binding protein, which is activated by hyperglycemia (32, 33). We suppose the reduction in hyperglycemia during liraglutide treatment may have diminished the activation of carbohydrate responsiveness element–binding protein and, consequently, of the de novo lipogenesis. Moreover, the reduction in HbA1c may also reflect a reduction in insulin resistance with liraglutide, and some recent data indicate an improvement in hepatic insulin sensitivity in patients with NASH treated with liraglutide, which might be a factor explaining the reduction in LFC (34).
Hypoadiponectinemia is strongly associated with the presence of steatosis in humans and in animal models (35–37). In a mouse model of steatosis, the delivery of recombinant adiponectin dramatically alleviated hepatomegaly and steatosis (38). We observed, as reported in Results, an increase in adiponectin levels with liraglutide therapy. However, in this study, we did not find any correlation between the reduction in LFC and the increase in plasma adiponectin, suggesting that the modification in plasma adiponectin in patients receiving liraglutide was not responsible for the reduction in LFC.
One weakness of our prospective study is that it is not a randomized study with a control group. However, although we did not perform a randomized, placebo-controlled study, we compared our data with those obtained in a parallel group of 16 patients with type 2 diabetes featuring similar baseline characteristics (i.e., BMI, HbA1c) and who had measurement of LFC by proton spectroscopy at baseline and 6 months after intensification of the antidiabetic treatment with insulin. Because of the absence of any significant decrease in LFC in the control group (P = 0.49), it seems unlikely that different results would have been observed with a larger control group. We think that this comparison allows us to suggest that the beneficial effect on LFC observed with liraglutide is a specific effect of the liraglutide therapy. In addition, the aim of our study was to analyze the effect of treatment with liraglutide as a whole, including its effect on body weight reduction, in real-life conditions, and to evaluate the factors that may be associated with liraglutide-induced modification of LFC which, we think, is a major strength of our study. In our study, dedicated to the assessment of LFC in patients receiving liraglutide, we did not evaluate liver fibrosis, which requires a liver biopsy. However, the favorable effect of liraglutide on fibrosis in the LEAN phase 2 trial is encouraging (13). In this trial, only 9% of the patients in the liraglutide group had progression of fibrosis, compared with 36% in the placebo group. However, our data showing a marked decrease in LFC after 6 months of treatment with liraglutide are positive and suggest that progression to fibrosis could be reduced. Specific studies on liver fibrosis are needed to confirm this hypothesis.
In conclusion, we showed that 6 months of treatment with liraglutide at a daily dose of 1.2 mg induced a significant reduction in LFC in patients with inadequately controlled type 2 diabetes and that this effect was mainly driven by the liraglutide-induced reduction in body weight. Further studies are needed to confirm that such a reduction in LFC may significantly reduce progression to fibrosis.
Abbreviations:
- ALT
alanine aminotransferase
- AST
aspartate aminotransferase
- BMI
body mass index
- GGT
gamma glutamyl transferase
- GLP1
glucagon-like peptide 1
- HDL-C
high-density lipoprotein-cholesterol
- LDL-C
low-density lipoprotein-cholesterol
- LFC
liver fat content
- LEAN
Liraglutide Efficacy and Action in Nonalcoholic Steatohepatitis
- MRI
magnetic resonance imaging
- NAFLD
nonalcoholic fatty liver disease
- NASH
nonalcoholic steatohepatitis
Acknowledgments
This study was supported by grants from NovoNordisk and the French National Research Agency (ANR) under the program “Investissements d’Avenir” (Grant ANR-11-LABX-0021; LipSTIC Labex).
Author contributions: J-M.P. and B.V. recruited patients, analyzed data, and wrote the manuscript. J-P.C., O.C., and R.L. performed proton spectroscopy and magnetic resonance imaging. D.D. and L.D. performed biological measurements. B.B. and C.F. recruited patients and analyzed data.
Clinical trial registry: ClinicalTrials.gov no. NCT02721888 (registered 29 February 2016).
Disclosure Summary: The authors have nothing to disclose.
References
Author notes
Address all correspondence and requests for reprints to: Bruno Vergès, MD, PhD, Service Endocrinologie, Diabétologie et Maladies Métaboliques, Hôpital du Bocage, CHU. 21000 Dijon, France. E-mail: [email protected].
