


Abstract
The objective of the study was to evaluate the effects of dosimetrically guided I-131 prescribed activities on hematopoiesis reflected by changes in complete blood counts (CBCs).
This was a retrospective analysis.
The study was conducted at an academic center.
A total of 152 patients with differentiated thyroid cancer who had 185 dosimetrically guided I-131 treatments.
There were no interventions.
Repeated-measure ANOVA was used for the analysis of the differences in the averages of CBCs that were documented at baseline and 1, 6, 12, 24–36, and 48–60 months after I-131 treatment.
All parameters decreased to their respective nadir at 1 month and then gradually returned toward baseline values. White blood cells (WBCs) and platelets (PLTs) were the most significantly affected cells. At 1 month, the decrease was 29.6% (P < .0001) for WBCs and 25% (P < .0001) for PLTs, whereas at 12 months, the decrease was 15.5% (P < .0001) and 13% (P < .0001), respectively. Lymphocytes appeared to be more susceptible to I-131 than neutrophils (ANCs). The decreases were small in absolute numbers for red blood cells, hematocrit and hemoglobin not surpassing 10%. Multivariate analysis demonstrated that the ratio of administered prescribed activity-to-maximum tolerated activity was associated with the decreases in WBCs (P = .0038), ANCs (P = .0063), and red blood cells (P = .029), with borderline significance for PLTs (P = .057) and hemoglobin (P = .057).
Dosimetrically guided I-131 resulted in statistically significant decreases in CBC parameters, which were more prominent in WBCs and PLTs. Lymphocytes were more severely affected than ANCs, whereas all parameters reached a nadir at 1 month and then gradually returned toward baseline values over the 5-year follow-up of our study.
As noted by the American Thyroid Association guidelines, three approaches are available for determining the prescribed activity for I-131 for the treatment of metastatic differentiated thyroid cancer (DTC) (1). These include empiric fixed prescribed activity using variable prescribed activities (2), whole-body dosimetry that determines the maximum tolerated activity (MTA) to the blood (ie, a surrogate for the bone marrow) (3, 4), and lesional dosimetry that attempts to determine the radiation absorbed dose to the tumor (5).
Of the potential adverse events of I-131 therapies, bone marrow suppression has been considered the most important (6). Although more than 20 publications have described their observations regarding bone marrow suppression secondary to I-131 therapy (6), few authors have reported their experience regarding bone marrow suppression secondary to the administration of dosimetrically-guided prescribed activities of I-131 (7–12). Moreover, the latter publications suffer from limitations including low patient numbers, limited number of time points measurements, short follow-up period, little to no evaluation of administered therapeutic prescribed activity, and/or total accumulative prescribed activity. An important parameter not previously reported is the change in complete blood counts (CBCs) relative to the ratio of administered therapeutic prescribed activity to the calculated MTA by dosimetry.
The objective of this study was to evaluate our experience at the MedStar Washington Hospital Center regarding the following: 1) the response of the patients' CBCs at multiple time points up to 5 years after administration of dosimetrically guided prescribed activities of I-131 for the treatment of metastatic disease secondary to DTC and 2) the relationship of the CBC responses after I-131 treatment to multiple factors including the amount of prescribed activity administered, the accumulated total activity, and the ratio of the administered prescribed activity divided by the dosimetrically determined MTA.
Materials and Methods
After institutional review board approval, we performed a retrospective review of patients seen at MedStar Washington Hospital Center from January 2001 to December 2013 who met the following inclusion criteria: 1) DTC; 2) near-total or total thyroidectomy; and 3) suspected or documented metastatic DTC (dosimetry was used exclusively for known or highly suspected distant metastatic disease and occasionally for extensive locoregional disease with vascular and/or lymphatic invasion, and we did not perform dosimetry for microscopic residual disease); 4) I-131 dosimetry performed to determine the MTA; 5) I-131 treatment within 1 month of I-131 dosimetry; 6) a baseline pretreatment CBCs; and 7) at least one CBC available during follow-up. Patients were excluded from the study if they had an abnormal baseline CBC, were known to have any baseline hematological disease, or had a systemic disease that could affect their bone marrow or peripheral blood cells (eg, systemic lupus erythematosus, HIV infection, rheumatoid arthritis), and/or received subsequent medication that could affect their hematological state (eg, tyrosine kinase inhibitors, cytotoxic chemotherapy).
Patients were treated with I-131after preparation with either recombinant human (rh) TSH or thyroid hormone withdrawal (THW). The administered prescribed activity of I-131 was determined by the referring physician in conjunction with the nuclear physician after taking into account the patient's clinical presentation and MTA calculated by dosimetry. The procedure of dosimetry has been previously described in detail (3).
The parameters of the CBC evaluated were hematocrit (Hct), hemogloblin (Hgb), red blood cell (RBC) count, white blood cell (WBC) count, absolute neutrophil count (ANC), absolute lymphocyte count (ALC), and platelet count (PLT). Baseline CBC values were obtained within 4 weeks prior to I-131 treatment. In patients prepared with THW, the blood draw was while they were off thyroid hormone, whereas for patients prepared with rhTSH, the draw was obtained on thyroid hormone. Blood samples obtained 3–4 weeks after I-131 treatment were tabulated as 1 month, 4–8 months as 6 months, 10–14 months as 12 months, 22–40 months as 24–36 months, and 41–64 months as 48–60 months. At 1 month, 126 CBCs were documented, at 6 months 124 CBCs, at 12 months 146 CBCs, at 24–36 months 91 CBCs, and at 48–60 months 36 CBCs. All data were included in our statistical analysis. All follow-up CBCs were obtained while the patient was on thyroid hormone replacement. Any administrations of blood transfusion or blood stimulating factors that were reported as a hematological adverse event secondary to I-131 were recorded.
Statistical analysis
Changes over time in CBC parameters were tested using a mixed-effect model, which adjusted for random effect due to repeated measurements per patient over time. Time was treated as a fixed effect. Difference in changes over time in CBC parameters between external beam radiation therapy (EBRT) vs non-EBRT, rhTSH stimulation vs THW, and the number of I-131 treatments were tested using interactions with time in the models. An analysis of the time interval between every two consecutive treatments was conducted for 22 patients who had more than one treatment. Correlations between interval in months between in each treatment and CBC parameters was tested using a mixed-effect model. The correlation between changes over time in CBC parameters and age at I-131 treatment, gender, tumor node metastasis (TNM) stage, I-131 prescribed activity, cumulative prescribed activity, and ratio of administered prescribed activity to MTA were tested separately using mixed-effect models. Furthermore, three separate multivariate analysis models were constructed for CBC parameters with either prescribed activity, cumulative prescribed activity, or ratio of given prescribed activity to MTA as independent predictor adjusting for age, gender, stage, stimulation, EBRT, and their interaction with time. Descriptive statistics were presented using means and SDs, and percentages were calculated for categorical variables. The analysis was conducted using SAS 9.3 (SAS Institute).
Results
Clinical characteristics
We examined records from 461 dosimetries. Our study cohort consisted of 152 patients who were diagnosed with follicular cell-derived carcinoma and had undergone at least one dosimetrically guided I-131 treatment in our institution and met all the inclusion criteria noted above. Twenty-two patients received more than one dosimetrically guided treatment, bringing the total number of the examined dosimetries to 185. The pertinent characteristics of our study cohort are presented in Table 1. The nodal and distant metastases of the patients are described in Supplemental Table 1.
Baseline Demographics
| Baseline Characteristics | n = 152 (100%) |
|---|---|
| Gender | |
| Female | 86 (56.6%) |
| Male | 66 (43.4%) |
| Age at diagnosis, y | |
| Mean ± SD | 48 ± 17.1 |
| Range | 9–85 |
| Age at I-131 treatment | |
| Mean ± SD | 53.3 ± 18.4 |
| Range | 18–86 |
| Surgery | |
| Total thyroidectomy | 152 (100%) |
| Histology | |
| Papillary | 114 (75%) |
| Classical | 70 (46%) |
| Follicular variant | 22 (14.5%) |
| Tall cell | 9 (5.9%) |
| Follicular | 22 (14.5%) |
| Hürthle cell | 10 (6.6%) |
| Poorly differentiated | 6 (3.9%) |
| TNM stage | |
| I | 53 (34.9%) |
| II | 10 (6.6%) |
| III | 27 (17.7%) |
| IV | 62 (40.8%) |
| Method of preparation | |
| rhTSH | 110 (59.5%) |
| THW | 75 (40.5%) |
| Administered I-131 activity, mCi | |
| Mean ± SD | 262.1 ± 100.8 |
| Range | 26.4–499 |
| Cumulative dosage of I-131 received, mCi | |
| Mean ± SD | 448.9 ± 269.9 |
| Range | 26.4–1417 |
| Ratio of administered I-131 activity to MTA | |
| Mean ± SD | 68% ± 22% |
| Range | 4%–100% |
| EBRT | |
| Yes | 25 (16.4%) |
| No | 127 (83.6%) |
Specific time course of decreases of CBCs
For WBCs, ANCs, ALCs, and PLTs, the mean decreases as well as the percentage differences from the baseline values for all those CBC parameters are shown in Table 2. WBCs and PLTs were the cell lineages that were more severely affected from the I-131 treatment. The time course of the WBC and PLT average decreases from baseline values is depicted in Figure 1.
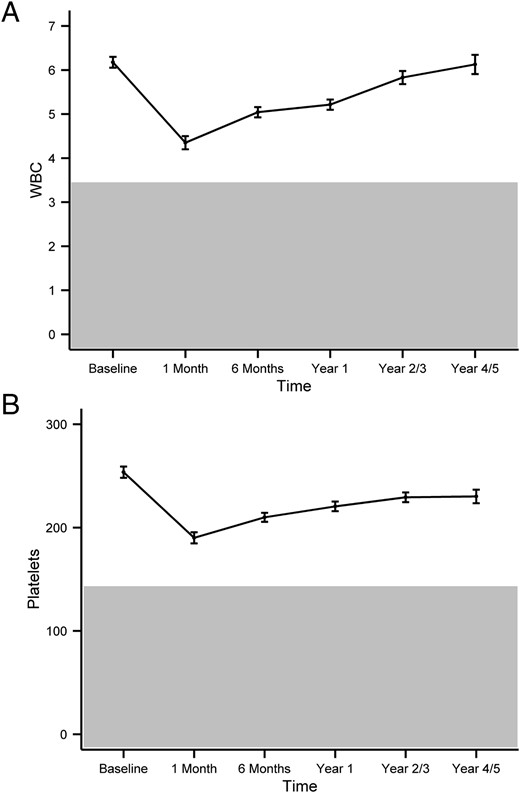
The pattern of I-131 induced changes in WBCs (A) and PLTs (B) over time.
The graph represents the mean changes of the parameters over time, with error bars representing the SE. The y-axis represents cell counts in 103 cells per microliter. The gray area represents abnormal values (that are below the reference range).
Changes in CBC Parameters After I-131 Treatment Over Time
| WBCs, 10c/μL | PLTs, 10c/μL | ANCs, 10c/μL | ALCs, 10c/μL | |
|---|---|---|---|---|
| Mean (SE) at baseline | 6.18 (0.12) | 253.62 (5.4) | 3.77 (0.1) | 1.76 (0.05) |
| Mean (SE) change at 1 mo, % | −1.83 (0.14) (29.6%) | −63.51 (5.1) (25%) | −0.89 (0.13) (23.6%) | −0.82 (0.04) (46.6%) |
| P value | <.0001 | <.0001 | <.0001 | <.0001 |
| Mean (SE) change at 6 mo, % | −1.13 (0.12) (18.3%) | −43.68 (3.9) (17.2%) | −0.54 (0.11) (14.4%) | −0.5 (0.04) (28.4%) |
| P value | <.0001 | <.0001 | <.0001 | <.0001 |
| Mean (SE) change at 12 mo, % | −0.96 (0.11) (15.5%) | −33.09 (4.2) (13%) | −0.54 (0.1) (14.4%) | −0.35 (0.04) (19.9%) |
| P value | <.0001 | <00001 | <.0001 | <.0001 |
| Mean (SE) change at 24–36 mo, % | −0.35 (0.14) (5.7%) | −24.27 (4.3) (9.6%) | −0.14 (0.13) (3.7%) | −0.18 (0.05) (10.2%) |
| P value | .017 | <.0001 | .29 | .0004 |
| Mean (SE) change at 48–60 mo, % | −0.05 (0.2) (0.1%) | −23.46 (5.7) (9.3%) | 0.06 (0.16) (1.6%) | −0.11 (0.07) (6.3%) |
| P value | .81 | <.0001 | .69 | .12 |
Whereas statistically significant differences were observed for RBC, Hgb, and Hct (data presented in Supplemental Table 2) at multiple time points, the decrease was less than 10% for all of the time points, and as a result we do not believe that this was clinically significant. However, the overall time pattern mirrored the one observed in WBCs and PLTs.
Because the WBC was one of the cell lineages that were more significantly affected, we further analyzed ANCs and ALCs as the two major constituents of the WBC. The data presented in Table 2 demonstrate that ALCs were more significantly affected by I-131 treatment than ANCs.
Moreover, Table 3 presents the grades of hematopoietic toxicity caused by the administration of I-131, as specified by the Common Terminology Criteria for Adverse Events (CTCAE-NCI; version 4). Similar to our above analysis, the most significant decreases were observed during the first month after treatment. Most the patients had either a grade 1 hematopoietic toxicity or their blood counts did not drop below the lower level of the normal reference range.
Grade of Hematopoietic Toxicity
| 1 Mo, %, n | 6 Mo, %, n | 12 Mo, %, n | 24–36 Mo, %, n | 48–60 Mo, %, n | |
|---|---|---|---|---|---|
| WBC | |||||
| Grade 1 | 22% (28) | 14% (17) | 14% (20) | 5% (5) | 6% (2) |
| Grade 2 | 17% (22) | 3% (4) | 1% (2) | 0% (0) | 0% (0) |
| Grade 3 | 3% (4) | 0% (0) | 0% (0) | 0% (0) | 0% (0) |
| ANCs | |||||
| Grade 1 | 6% (8) | 3% (4) | 3% (5) | 2% (2) | 3% (1) |
| Grade 2 | 6% (7) | 2% (3) | 3% (4) | 0% (0) | 0% (0) |
| Grade 3 | 3% (4) | 0% (0) | 0% (0) | 0% (0) | 0% (0) |
| ALCs | |||||
| Grade 1 | 3% (4) | 3% (4) | 2% (3) | 0% (0) | 0% (0) |
| Grade 2 | 19% (24) | 5% (6) | 2% (3) | 2% (2) | 0% (0) |
| Grade 3 | 4% (5) | 3% (4) | 1% (2) | 1% (1) | 0% (0) |
| Hgb | |||||
| Grade 1 | 22% (28) | 15% (19) | 8% (12) | 4% (4) | 3% (1) |
| Grade 2 | 4% (5) | 2% (3) | 1% (1) | 1% (1) | 0% (0) |
| Grade 3 | 0% (0) | 0% (0) | 0% (0) | 0% (0) | 0% (0) |
| PLTs | |||||
| Grade 1 | 21% (27) | 9% (11) | 8% (11) | 1% (1) | 0% (0) |
| Grade 2 | 2% (2) | 0% (0) | 0% (0) | 0% (0) | 0% (0) |
| Grade 3 | 0% (0) | 0% (0) | 0% (0) | 0% (0) | 0% (0) |
| Total CBCs documented | 127 | 124 | 146 | 91 | 36 |
Abbreviation: n, number of patients exhibiting a grade of hematopoietic toxicity. Grades of hematopoietic toxicity were specified using CTCAE-NCI, version 4.
rhTSH stimulation vs THW
Because hypothyroidism has been associated with hematological changes (13–16), we compared those patients who were hypothyroid when prepared with THW vs those who were euthyroid when prepared with rhTSH injections. No statistically significant difference was noted between the two subgroups for age (P = .11) and gender (P = .28). Baseline CBC values were comparable in the two groups for WBCs (P = .28), ANCs (P = .13), and ALCs (P = .11), but Hgb, Hct, RBCs, and PLTs were significantly higher at baseline in the hypothyroid (THW) group (P = .0007, P = .0001, P < .0001, and P = .0052, respectively).
After dosimetrically guided I-131 treatment, the decreases in Hgb, Hct, and RBC levels were small in absolute numbers. No statistically significant difference was observed between the two groups for the changes in WBCs and ANCs at all time points. As shown in Table 4 and Supplemental Table 3, ALCs at all time points up to 12 months had a statistically significant decrease in patients who were prepared with THW vs rhTSH, and this was also true for PLTs for all time points up to 48–60 months after treatment. Despite the fact that no statistically significant difference was found between the two groups in prescribed activity of I-131 received (P = .38) and cumulative prescribed activity of I-131 received (P = .1), patients prepared with THW received a higher percentage of the calculated MTA (76%) than those prepared with rhTSH (63%), and this was statistically significant (P < .0001).
Changes in ALCs After I-131 Treatment Over Time in Patients Prepared With THW Versus rhTSH for I-131 Treatment
| rhTSH | THW | rhTSH-THW | ||||
|---|---|---|---|---|---|---|
| Mean (SE) | P Value | Mean (SE) | P Value | Mean (SE) | P Value | |
| At baseline | 1.7 (0.06) | 1.86 (0.08) | −0.16 (0.1) | .11 | ||
| Decrease at 1 mo | −0.7 (0.05) | <.0001 | −1.03 (0.07) | <.0001 | 0.33 (0.08) | <.0001 |
| Decrease at 6 mo | −0.44 (0.05) | <.0001 | −0.63 (0.07) | <.0001 | 0.19 (0.08) | .02 |
| Decrease at 12 mo | −0.26 (0.04) | <.0001 | −0.51 (0.06) | <.0001 | 0.25 (0.08) | .002 |
| Decrease at 24–36 mo | −0.15 (0.06) | .02 | −0.26 (0.08) | .0029 | 0.11 (0.11) | .3 |
| Decrease at 48–60 mo | −0.05 (0.09) | .59 | −0.14 (0.1) | .15 | 0.09 (0.14) | .52 |
All cell counts are in 10c cells per microliter.
EBRT vs no EBRT
To distinguish between the potential effects of I-131 treatment and EBRT on CBCs, we compared the subgroup of patients that were not exposed to EBRT and those that had received EBRT. Overall, no significant differences were found for WBCs (P = .35), ANCs (P = .98), PLTs (P = .34), Hgb (P = .49), and Hct (P = .63) (data not shown). On the contrary, significant differences were observed for RBCs (P = .019) and ALCs (P < .0001) as shown in Figure 2, A and B, respectively.
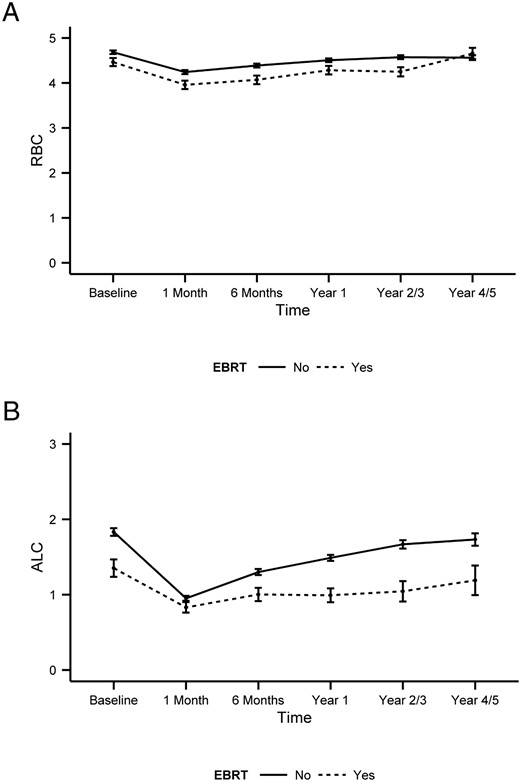
Comparison of the changes in RBCs (A) and ALCs (B) after I-131 treatment in patients with and without prior EBRT.
The graph represents the mean changes of the parameters over time, with error bars representing the SE. Statistically significant differences were observed for the two groups in RBCs (P = .019) and ALCs (P < .0001). The y-axis represents cell counts in 106 cells per milliliter for RBCs and in 103 cells per microliter. The reference range for RBCs is 4.7–6.1 106 cells/μL in men and 4.2–5.4 106 cells/μL in women, whereas the reference range for ALCs is 1.3–3.5 103 cells/μL.
We then examined whether the site of EBRT affected the decrease in the CBC parameters. More specifically, we compared patients who received EBRT at bone metastases (17 of 25, 68%) with patients who received EBRT at other-than-bone metastases (lung, brain, neck, etc) (8 of 25, 32%). Our analysis demonstrated that there were no statistically significant differences between the two groups in the decreases documented at all time points.
Factors influencing the level of decrease in CBC values
Statistical analyses were performed to identify factors associated with the decrease in CBC parameters over time. Bivariate analyses revealed no significant association between the decrease in any CBC parameter and gender as well as TNM stage. Age at I-131 treatment correlated with the decrease over time in ANCs (P = .017), Hgb (P = .002), Hct (P = .009), and RBCs (P = .036) but not for WBCs (P = .056), ALCs (P = .059), and PLTs (P = .21). Interestingly, no correlation was found when univariate analyses were performed for the administered prescribed activity and the cumulative prescribed activity of I-131. On the contrary, a significant correlation was found between the ratio of administered prescribed activity to MTA and decreases in WBCs (P = .0012), PLTs (P = .039), ANCs (P = .003), Hgb (P < .0001), Hct (P < .0001), and RBCs (P < .0001).
Because the ratio of administered prescribed activity to MTA demonstrated a significant association with CBC decreases, a multivariate analysis was performed after adjusting for the age at I-131 treatment, gender, TNM stage, and the method of preparation for treatment and whether the patient has received prior EBRT. The findings were congruent with the results of the bivariate analyses. Administered prescribed activity and the cumulative prescribed activity showed no statistically significant correlation with the decreases in CBCs, but the ratio of administered prescribed activity to MTA was associated with the decreases in WBCs (P = .0038), ANCs (P = .0063), and RBCs (P = .029). A borderline statistically significant association was observed for the decrease in PLTs (P = .057) and Hgb (P = .057). The results identified the ratio of prescribed activity to MTA as a significant factor associated with the decrease of CBC values after I-131 treatment.
Finally, we performed an analysis to examine whether there is a correlation between the grade of hematopoietic toxicity (as presented in Table 3) and either the administered activity of I-131 or the ratio of the administered activity to MTA. We found statistically significant correlations between the grade of hematopoietic toxicity and the administered activity in WBCs at 1 month (P = .002), in PLT at 1 month (P = .04), and in Hgb at 6 months (P = .001) and 12 months (P = .04). Likewise, statistically significant correlations were found between the grade of hematopoietic toxicity and the ratio of the administered activity to MTA in ALCs at 1 month (P = .01), in PLT at 1 month (P = .03), and in Hgb at 1 month (P = .0004), 6 months (P = .04), and 12 months (P = .0073).
Multiple radioactive iodine treatments
The effect of multiple I-131 treatments was analyzed in a subset of patients. Twenty-two patients had more than one I-131 dosimetrically guided treatments: 16 patients had two treatments, four patients had three treatments, one patient had five treatments, and one patient had six treatments. Baseline CBC values before each treatment were assessed and compared with baseline values before the first treatment. WBCs, ANCs, ALCs, RBCs, and PLTs demonstrated a step-wise decrease at baseline values after each consecutive I-131 treatment. Hgb and Hct did not follow the same pattern and the baseline values after each treatment did not show great fluctuation. The baseline WBCs decreased by a mean estimate of 0.35 103/μL for each additional treatment (P = .02), with ANCs also decreasing 0.35 103/μL (P = .01). Likewise, PLTs and RBCs decreased by 12.09 103/μL (P = .02) and 0.11 106/μL (P = .01), respectively, for each additional treatment. The baseline values of Hgb (P = .08), Hct (P = .3), and ALCs (P = .15) did not show a statistically significant decrease after each additional treatment.
In regard to the absolute decreases after each I-131 treatment in CBC values in this subset of patients, no statistically significant correlation was found between the absolute change of all CBC parameters over time after the treatment and the number of treatments. The absolute decreases of WBC were similar and were not dependent on the number of treatments that the patient had received (P = .39) (Figure 3). All CBC parameters demonstrated similar patterns (data not shown).
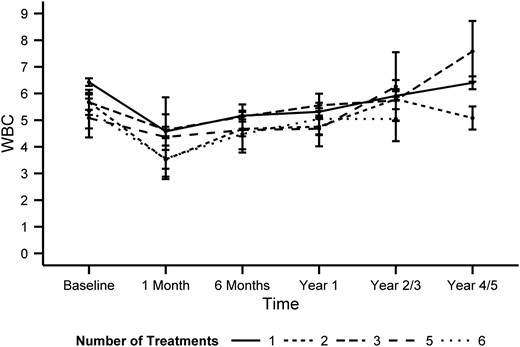
The changes in WBCs over time relative to the number of total I-131 treatments.
The graph represents the mean changes of WBC over time, with error bars representing the SE. No statistically significant (P = .39) correlation was found between the number of treatments and the magnitude of the decrease in WBCs. The y-axis represents cell counts in 103 cells per microliter.
In regard to the time between treatments as a factor affecting the magnitude of the decreases in CBC parameters, no association was identified (P values for WBCs, P = .18, PLTs, P = .06, ANCs, P = .41, ALCs, P = .45, Hgb,. P = .61, Hct, P = .9, and RBCs, P = .83). One factor that needs to be taken into account is that, in the vast majority of cases, subsequent treatments were performed with an at least 11-month-long period of treatment rest, thus providing the bone marrow with time to recover.
Our data demonstrated that multiple I-131 treatments are associated with lower baseline CBC values, but the absolute decrease after treatment is not greater in patients who had multiple treatments. Finally, no administration of blood transfusion or blood stimulating factors was reported as a result of a hematological adverse event secondary to I-131.
Discussion
To our knowledge, this study reports the hematological adverse effects in the largest number of patients with DTC with the following: 1) were treated with a prescribed activity of I-131 that was guided by whole-body dosimetry, 2) had the most extensive number of time points tabulated, and 3) had a comparison of the administered individual prescribed activity not only to the total individual and cumulative prescribed activity but also to the ratio of the administered prescribed activity to the calculated MTA. Specifically, we demonstrated that: 1) WBCs and PLTs are the most severely affected blood cell lineages after a dosimetry-guided I-131 treatment, with ALCs being affected more than ANCs; 2) all CBC parameters decrease to a nadir at 1 month, and then they gradually return toward baseline values; 3) the ratio of administered dosage to MTA is an important factor influencing the level of CBC decreases; 4) patients that have multiple I-131 treatments tend to return to lower baseline CBC values after each treatment.
Despite its strengths, this study has certain limitations. First, due to the retrospective nature of the study, there is the potential for bias, which, if present, cannot be controlled. Moreover, the CBCs were not always performed at exactly the same time. Finally, although the number of second, third, and subsequent therapies evaluated is one of the largest of any study published, this number is still low, and further study is warranted.
In comparison with previous publications, the results of this study are similar to our earlier observations in which the greatest changes in the patients' CBCs were observed in WBCs and PLTs with little change in Hct and Hgb, and the nadirs of the WBCs and PLTs were at approximately 1 month after I-131 treatment (9). In one recently published report, Molinaro et al (17) noted a statistically significant decline of 9.7% (P < .001) in WBCs and a 5.8% (P < .001) in PLTs, with no significant change in Hgb at 12 months after I-131. Of note is that their prescribed activity was not dosimetrically guided and was approximately 100 mCi (3.7 GBq).
However, our data differ from other earlier reports. Padovani et al (12) reported a small but statistically significant decrease in Hgb, Hct, and PLTs without any significant change in WBCs at 12 months after dosimetrically guided I-131 treatment in 50 patients. Several differences in the two studies may have contributed, at least in part, to the difference in observations. First, Padovani et al did not perform formal dosimetry before every administered activity, and second, 29 patients (58%) had EBRT in contrast to our 16.4%. This high percentage could have acted as a confounder. As we showed, patients who received EBRT had a statistically significant difference in RBCs and ALCs, and Zachariah et al (18) demonstrated the significant effects of fractionated regional EBRT in the hematological equilibrium. More recently, Prinzen et al (19) demonstrated statistically significant decreases in WBCs and PLTs at 3, 6, and 12 months after I-131 therapy with minimal increases in Hgb at 3 months. However, these changes were not clinically significant and the mean prescribed activity was 150 mCi. In addition, the study by Prinzen et al did not evaluate hematological parameters at 4 weeks, which has been shown to be the nadir for WBCs and PLTs (9).
In the present study, age at the time of treatment correlated with the decrease in CBCs in our unadjusted model, and this was not unexpected because people of advanced age have decreased bone marrow reserves (20). No correlation was observed with either the administered or the cumulative I-131 prescribed activity, which is consistent with some reports (12, 17) but discordant with others (21, 22). However, in analyzing both our unadjusted and adjusted models, the ratio of administered prescribed activity of I-131 to MTA correlated with the decreases in CBCs. This tends to validate a correlation between dosimetrically guided I-131 and the radiation absorbed dose to the bone marrow. Awareness of this relationship may help the treating physician to select a more appropriate prescribed activity of I-131 and/or scheduling of I-131 therapy for patients based on risk of bone marrow suppression.
In patients whose tumor has responded to I-131 therapy and continues to take up I-131, a frequent question is when should the next dosimetrically guided I-131 therapy be administered? This is problematic and depends on multiple factors, a discussion of which is beyond the scope of this report. However, this study offers guidance in regard to the pattern of the patients' decreases in CBC values including the patient's expected time of nadir, range of decrease values, and the pattern of recovery. These patterns may be valuable in helping to determine not only the time for another dosimetrically guided I-131 therapy but also appropriate decreases of the I-131 prescribed activity. However, further study is warranted to evaluate the many other factors or approaches to determine the time for the next I-131 therapies. Until those data are available, we propose deferring a subsequent I-131 therapy, if possible, approximately 12 months as originally recommended by R. Leeper (personal communication).
In summary, we demonstrate that there are significant changes on hematopoiesis resulting from a dosimetrically guided I-131 treatment. However, no administrations of transfusions and/or stimulating factors were observed to be required. This is important in helping to confirm that dosimetrically guided I-131 allowed the administration of potential higher prescribed activities than standard empiric prescribed activities while avoiding clinically significant adverse hematological events. Further study is warranted in evaluating the patterns of decreased CBCs after dosimetrically guided I-131 as an aid in helping to identify reduced bone marrow reserves prior to future I-131 treatment and/or the time of an administration of a future I-131 treatment.
Acknowledgments
This work was supported by generous grants from grateful patients. Biostatistical support for this project has been supported in whole or in part with federal funds (Grant UL1RR031975) from the National Center for Research Resources, the National Institutes of Health, through the Clinical and Translational Science Awards Program, a trademark of the Department of Health and Human Services, part of the Roadmap Initiative, “Re-Engineering the Clinical Research Enterprise.”
Disclosure Summary: The authors have nothing to disclose.
Abbreviations
- ALC
absolute lymphocyte count
- ANC
absolute neutrophil count
- CBC
complete blood count
- CTCAE-NCI
Common Terminology Criteria for Adverse Events
- DTC
differentiated thyroid cancer
- EBRT
external beam radiation therapy
- Hct
hematocrit
- Hgb
hemogloblin
- MTA
maximum tolerated activity
- PLT
platelet count
- RBC
red blood cell
- rh
recombinant human
- THW
thyroid hormone withdrawal
- TNM
tumor node metastasis
- WBC
white blood cell.
