


Abstract
First Nations (FN) people in Canada are commonly diagnosed with colorectal cancers. Although Canada has treaty responsibilities to ensure FNs people have equitable access to quality health services, access to colorectal cancer screening in Canada by FNs people has not been fully assessed.
The objectives of our retrospective population-level study that linked multiple administrative databases were to investigate differences in colorectal cancer screening rates: participation, retention, positivity, follow-up colonoscopy, and invasive colorectal cancer detection, as well as wait times to follow-up colonoscopy, and stages at diagnosis between FNs and non-FNs people in Alberta. All Alberta residents eligible for colorectal cancer screening (aged 50-74) between 2012 and 2018 were included. The study and descriptive methods adhered to FNs principles of ownership, control, access, and possession.
FNs people were less likely to participate in colorectal cancer screening (lower by 15.9% among women, P < 0.00001, and 17.0% among men; P = 0.0007), and less likely to be retained in the screening program (lower by 11.6%, P = 0.0013, among women and 9.9% %, P = 0.034, among men). They were more likely to screen positive (average difference of 7.0% among women and 7.3%, among men, both P < 0.0002). Invasive colorectal cancer detection rates were higher (3.2/1000) versus (2.3/1000) as were late-stage diagnoses (61% versus 43%, P = P = 0.004) among FNs people than non-FNs people, respectively.
Higher invasive colorectal cancer detection rates and more late-stage diagnoses in FNs people can be due to lower participation and retention in colorectal cancer screening programs. Understanding and addressing the reasons for these inequities are needed to improve these outcomes for FNs people.
Lay Summary
Colorectal cancer can be prevented or caught early through screening programs. First Nation (FN)s people get more colorectal cancer than most Canadians. We wondered if this could be caused by FNs people not being screened as much. We compared colorectal cancer screening services for FNs people to non-FNs people in Alberta. We linked several health data sources available from 2012 to 2018 for people between 50 and 74 years of age. FNs people did not get screened for colorectal cancer as much as non-FNs people. They had higher positive screening test results too. When colorectal cancers were found, FNs people had more advanced cancer. The results were shared first with the FNs communities by their health leaders. Results were then shared with provincial health leaders. The next step is to overcome barriers to colorectal cancer screening faced by FNs people. When differences in colorectal cancer screening disappear, FNs people could have fewer colorectal cancers.
Introduction
Colorectal cancers (CRCs) are the third most common cancer type and the second most common cause of cancer deaths among people living in Canada.1 CRC incidence and mortality rates have been decreasing within Canada; CRC screening has likely contributed to these trends, as screening reduces CRC-related mortality by identifying and removing pre-cancerous lesions and/or early-stage CRCs.2 The Alberta Colorectal Cancer Screening clinical practice guideline recommends annual CRC screening for average-risk people aged 50-74 years with a fecal immunochemical test (FIT). In spite of First Nation (FN) resistance to settler colonialism as well as many FN ways of being that protect and promote health, FN people in Canada experience unique health challenges.3–6
Canadian colonialism has profound negative impacts across the determinants of FN peoples’ health.3–5 The direct colonial violence against FN individuals and the colonial violence against FN cultures, lifeways, and relationships to the land shapes the health of FN people today.7,8
CRCs were historically less common among FN people in Canada; however, incidence and mortality rates of CRCs among FN people have increased in recent years,9–12 and CRCs are now the second most common cancer type among FN people in Alberta.13,14 The settler-colonial nation-state of Canada has a moral and treaty responsibility to ensure FN people have equitable access to quality health services.15,16 Given the burden of CRC among FN people in Canada and the proven benefits of CRC screening, equitable access to CRC screening for FN people should be prioritized and was identified as a key need nearly a decade ago by the FNs, Inuit, Métis Action Plan developed in consultation with these populations.17
Despite the importance, information on the uptake and outcomes of CRC screening among FN people in Canada is limited, in part because FN status is not routinely captured in administrative or provincial registry databases. The few studies available suggest that CRC screening is not equitably delivered to FN people in Canada. However, studies to date have relied either on survey data—with the data quality problems associated with self-reports—or were limited to merely one element along the screening pathway.12,17,18 Furthermore, research involving FN participants is often performed without sufficient consultation and direction from FN leaders and communities The study objectives were to carry out the most comprehensive evaluation to date of a CRC screening pathway among FN people in Canada by comparing CRC screening participation and retention rates, positivity and follow-up test rates, and invasive CRC detection rates as well as stage at diagnosis over time between FN and non-FN people.
Methods
FNs engagement
This study represents a collaborative partnership between the Alberta CRC Screening Program (ACRCSP) and the Alberta FN Information Governance Centre (AFNIGC). The AFNIGC, a regional satellite centre for the National FNIGC, was formed as a not-for-profit in 2011 to strengthen FNs control and capacity in ethical and relevant processes for research. The AFNIGC has a direct mandate and accountability process to use research and information collected from FN communities for the benefit of these communities, including cancer prevention.19,20 The AFNIGC and ACRCSP co-developed and co-led this project.
Study setting, population, and data sources
The ACRCSP launched in 2007 and contains individual-level fecal occult blood (FOBT, 2009 – 2013) and FIT (2014 – today) test dates and lab results. Colonoscopy information is captured via the discharge abstract database, National Ambulatory Care Reporting Systems databases, and Alberta Practitioner Claims databases. Following the Alberta CRC screening guidelines,21 of our retrospective cohort study included all registered Alberta residents aged 50-74 years between 2012 and 2018. Databases routinely linked to the ACRCSP database include the Alberta Health (AH) Person Directory, Vital Statistics, and the Alberta Cancer Registry (ACR). The Person Directory database includes data from all registered Alberta residents that is used to determine screening eligibility. Vital statistics and ACR data were used to remove deceased individuals and patients who were previously diagnosed with invasive CRC. Thus, it is a clean data set of the eligible population. The Provincial Healthcare Number is the primary key to linking these multiple data sources, using deterministic linkage methods.
A Data Governance Agreement was developed between AH Services Screening Programs and the AFNIGC. This enabled the FN registry stewarded by the Government of Alberta (AH) to be linked with the ACRCSP database. The FN identifiers originated from the AH Care Insurance Plan (AHCIP) Adjusted Population Registry. Before 2009, all Alberta residents were required to register for AHCIP coverage and pay monthly health care premiums to receive insured hospital and physician services. For FN individuals registered with the federal government, these premiums were covered and, as a result, the province was able to identify registered FN individuals residing in Alberta.
Important study considerations included incorporating the FN principles of ownership, control, access, and possession (OCAP®™). All personnel working with these data completed OCAP®™ training prior to accessing the data or summary results as the AFNIGC had jurisdiction over these data. Two community gatherings were held with Elders, Knowledge Holders, cancer survivors, and community members from each Treaty area (Supplementary Figure S2). The pre-study one involved sharing the project’s objectives and listening to those present to ensure that the protocols and processes were respectful of FN values. At the post-study community gathering, the results of the project were shared and FN attendees were provided opportunities to ask questions, provide context to the results, and offer solutions to enhance screening uptake in their communities. In keeping with the OCAP®™ principles, results were first shared within FN communities and then with AFNIGC approval, with healthcare leaders in AB and in publications.
Only the ACRCSP analysts had access to individual-level data, including FN identifiers. They created aggregated data summaries of FN and non-FN populations from this merged secure database (Supplementary Figure S1) for 7 selected system-level quality indicators (Supplementary Table S1) on cancer screening activities.22,23 These standardized indicators are collected by the ACRCSP using relatively straightforward algorithms to evaluate the local performance of the CRC screening program that are shared nationally Ethics approval for this study (HREBA.CC-19-0101) was granted from the Health Research Ethics Board of Alberta—Cancer Committee. Consent for this project for the FN people was through our partnership with AFNIGC. For the non-FN people, screening participation implies consent.
Study outcomes
The aggregated data were analyzed using descriptive quantitative analyses to calculate differences between FN and non-FN groups for the following CRC screening pathway indicators (outcomes): (i) CRC screening participation rates (percentage of Alberta residents aged 50-74 years who had a FOBT or FIT test in the past 2 years and/or sigmoidoscopy or colonoscopy in the past 5 years); (ii) CRC screening retentions rates (percentage of people who had a normal fecal test at age 50-72 who were subsequently re-screened within 30 months); (iii) CRC screen positivity rates (percentage of individuals with an abnormal fecal test result); (iv) follow-up test rates (percentage of people who had a colonoscopy within 180 days of an abnormal fecal test); (v) timeliness of follow-up testing (days until 90% of those with an abnormal fecal test had a follow-up colonoscopy24); (vi) rate of invasive CRCs detected by colonoscopies performed within 180 days from an abnormal fecal test result; and (vii) the stage distribution of screen-detected invasive CRCs.
Statistical analysis
Two-sample tests of proportions used pooled standard errors and t-tests assumed non-equal variances. Confidence intervals (CIs) were calculated based on standard errors for the estimated proportions or means. Trends were evaluated using joinpoint models that assumed first-order correlations. Reported P-values for each sex group have been adjusted for multiple tests using the step-down Holm-adjusted method.25 Analyses were conducted separately for each screening indicator, age, and biological sex subgroup to minimize confounding. To ensure possible age distribution differences did not affect the various rates, we standardized them using the 2011 Canadian population for the appropriate age ranges for each sex denoted in the figures as All Ages (ASR). Data were aggregated over years and sometimes sexes to ensure sufficient data values (≥10) in specific categories. Analyses were carried out using RStudio v1.1.447, Stata 16.0, and Joinpoint 4.9.1.0 statistical software programs.
Results
As depicted in Figure 1A and B, FN women and men in Alberta were less likely than their non-FN counterparts to receive CRC screening. In the all-ages (ASR) comparisons, the difference in the average participation rates for FN compared to non-FN people was 15.9% (95% CI = 15.0% to 16.8%; P < 0.00001) and 17.0% (95% CI = 15.2% to 18.9%; P = 0. 0007) lower among women and men, respectively. This difference has been decreasing over time, but only significantly among FN men. The annual percentage change was not statistically significant for FN women (0.2, P = 0.644), for non-FN women (−0.60, P = 0. 332), and for non-FN males (0.35 P = 0.071) but was for FN males (2.82, P = 0.034). ASR participation rates were all below the national benchmark of 60%; however, non-FN men aged 70-74 years and women aged 60 years and above met this standard.23 Supplementary Table S2 provides the counts for each group by year and sex of those who participated out of the total target population.
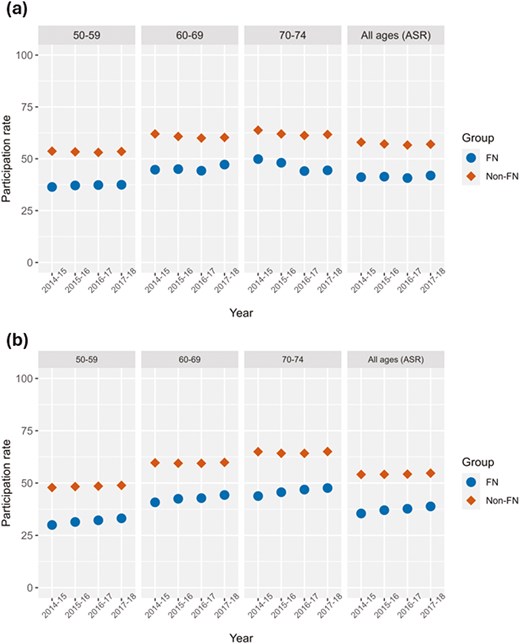
Participation rates over the years 2014-2018 by age and sex groups. All ages (ASR) panel represents age-standardized rates (A) Female participation rates, (B) Male participation rates. FN = First Nation, Non = Non-First Nation. ASR = age-standardized rate.
In Figure 2A and B, FN women and men who had a normal fecal test were less likely than non-FN people to be retained in the provincial screening program. In the All Ages (ASR) comparisons of 2012-2013 to 2015-2016 data, the difference in the average retention rates for FN compared to non-FN people were 11.6% (P = 0.0013) and 9.9% (P = 0.034) lower than their non-FN counterparts among women and men, respectively. There were some statistically significant downward trends: FN women (APC = −3.52, P = 0.099), non-FN women (APC = −2.4, P =0.054), FN men (APC = −5.56, P = 0.034) and non-FN men (APC = −1.90, P = 0.039).
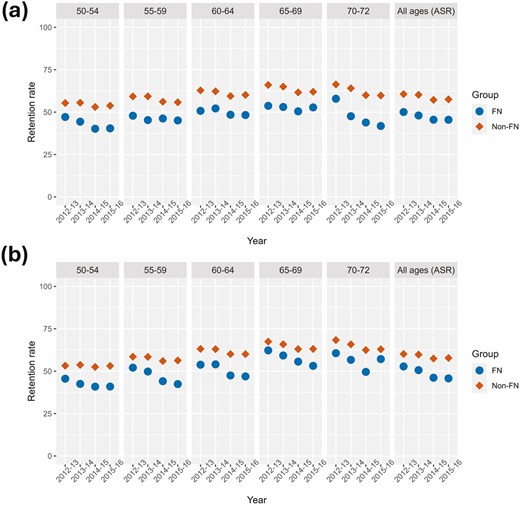
Retention rates over the years 2012-2016 inclusive by age and sex groups. All ages (ASR) panel represents age-standardized rates (A) Female retention rates, (B) male retention rates. FN = First Nation, Non = Non-First Nation. ASR = age-standardized rate.
Figure 3A and B demonstrate that from 2014 to 2018, FN women and men had higher screen positivity rates than their non-FN counterparts. Among women aged 50-74, the difference in the average ASR positivity rates (Supplementary Table S3) was 7.0% (P = 0.0002) higher in the FN group compared to the non-FN group, with differences in the age group averages increasing from 5.8% for the youngest age group (50-54) to 8.9% in the oldest age group (70-74). The difference in the average ASR positivity rates among men aged 50 to 74 were similar, 7.3% higher, for FN men compared to non-FN men (P = 0.0002). The differences in averages increased with age groups, from 6.7% for men aged 50-54 to 8.9% for men aged 70-74. Positivity rates were higher for men compared to women in both groups, although there was substantial variation in the FN groups due to their smaller population size.
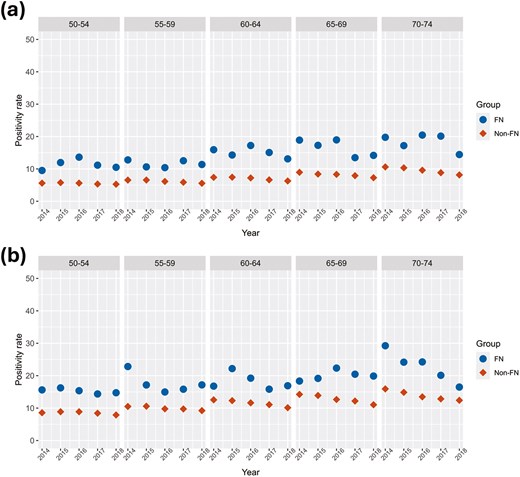
Positivity rate of FIT tests over the years 2014-2018 inclusive by age and sex groups. (A) Female positivity rate, (B) male positivity rate. FN = First Nation, Non = Non-First Nation.
As seen in Figure 4A and B, FN women and men had lower follow-up colonoscopy test rates after an abnormal fecal test result across all age groups than their non-FN counterparts. The difference in the average ASR rates was 9.0 % (P = 0.18) higher in the FN women than in the non-FN women (Supplementary Table S4). In the age groups 50-59, 60-69, and 70-74 years, the difference in age group averages increased from 7.2%, to 10.8% to 11.3%, respectively. The differences in average follow-up test rates between non-FN and FN men for the same age groups were greater, starting with 12.4% to 9.7%, to 16.7%. The difference in the average ASR rate was 11.9% (P = 0.039) higher in the FN men than non-FN men. There were also no significant trends over this short time period for any age group and all test rates were at least 10% below the national benchmark of 85 % within 180 days.23
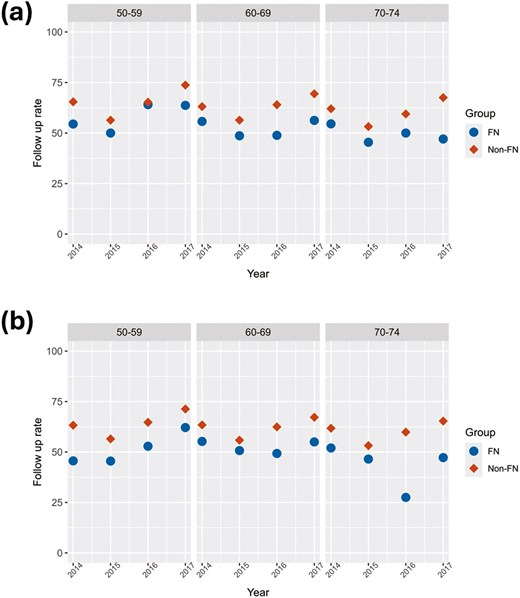
Follow-up test rates over the years 2014-2017 inclusive by age and sex groups sex. (A) Female follow-up test rate, (B) male follow-up test rate. FN = First Nation, Non = Non-First Nation.
The number of days when 90% of follow-up colonoscopies were completed following abnormal fecal tests (wait times) ranged between age groups from 125 to 168 days among women and 108 to 173 days among men who completed this test. There were no significant differences in this measure between FN and non-FN groups although FN women aged 70-74 waited 11.69 days on average longer than their counterparts. All groups were above the national standard of 60 days for 90% of wait times for follow-up colonoscopies (results not shown, Supplementary Table S5).22
Invasive CRC detection rates per 1000 people were higher among FN people (3.2, 95% CI = 2.5 to 3.8) than among non-FN people (2.3, 95% CI = 2.2 to 2.4, P = 0.009). Also, the cancer stage of invasive CRCs were significantly different (P = 0.009) between FN and non-FN people. FN people were also more likely to be detected at late-stage disease (stages III + IV, 61% versus 43%) and less likely to be diagnosed at early-stage (I+II; 38% versus 57%; P = 0.004, Table 1).
Cancer stage distribution by First Nations status. Counts, percentages, and 95% confidence intervals of detected invasive cancers for males and females combined from 2013-2017, by stage and First Nations status.
| All Sexes | First Nations (n = 78) | Non-First Nations (n = 3555) | ||||
| No. | % | 95% CIa | No. | % | 95% CI | |
| Stage-I | 15 | 19% | (10.5%,28.0%) | 1235 | 35% | (33.2%,36.3%) |
| Stage-II | 15 | 19% | (10.5%,28.0%) | 780 | 22% | (20.6%,23.3%) |
| Stage-III | 37 | 47% | (36.4%,58.5%) | 1083 | 30% | (29.0%,32.0%) |
| Stage-IV | 11 | 14% | (6.4%,21.8%) | 457 | 13% | (11.8%,14.0%) |
aCI, confidence interval.
Discussion
FN people in Alberta are significantly less likely to participate in CRC screening and to be retained in the provincial CRC screening program after having a normal screening test. They also had higher screen positivity rates across each age and sex. FN people had lower follow-up test rates than non-FN people, especially men. With the exception of delays for FN women aged 70-74—timeliness from a positive screening test to a follow-up colonoscopy was similar between FN and non-FN people and about double the national target for the indicator. Lastly, FN people in Alberta are more likely to be diagnosed with invasive CRCs and to be diagnosed with later-stage CRCs.
There are multiple potential reasons for these inequities. A 2018 review by Hutchinson et al. identified the following barriers to cancer screening among Indigenous people living in Canada: (a) attitudes and beliefs about cancer; (b) health system challenges; (c) lack of trust towards health care providers and health organizations; (d) lack of knowledge or awareness about cancer and cancer screening; (e) barriers associated with demographics and health determinants; (f) impacts of colonialism, discrimination, and racism.17 It is not known what caused the higher FIT positivity rates, although a higher prevalence of IBD could be one such cause.26 A new diagnosis of IBD was one of the factors found in a German population study by Amitay et al. to be independently associated with increased odds of FIT positivity (OR = 9.13, 95%CI 2.18, 38.19) at screening colonoscopy.27 Havercamp et al. reported an average FIT positivity result of 23.6% in a study of 165 American Indians/Alaska Natives in 3 tribally operated healthcare facilities where a mailout FIT kit was evaluated.28 This higher positivity rate could be due to a lower FIT threshold of 10 ug/g, not the 15 ug/g used by ACRCSP. Compared to fecal tests, we anticipated more barriers to follow-up colonoscopies given the service availability in bigger centres, thus transportation issues, and the greater invasiveness; the similar rate and timeliness of follow-up testing between FN and non-FN people are encouraging. FN people in Alberta are more likely to be diagnosed with invasive CRCs and to be diagnosed with later-stage CRCs. This inequity is likely due in part to lower rates of participation and retention among FN people in Alberta’s CRC screening program. Further, risk factors for CRC such as higher BMIs, red meat intake, cigarette smoking, low physical activity, and low fruit and vegetable consumption are likely more common among FN people.3,5,29–32 Differences in screening and subsequent later-stage diagnoses of colorectal cancer may be impacted by experiences of colonial trauma contributing to distrust by FN people in healthcare systems in general, and particular hesitancy to participate in screening due to the sensitive and private nature of the tests.19,20
This study was initiated in response to a request from the AFNIGC to evaluate cancer screening given certain FN leaders wanted to improve cancer prevention in their communities. Building on the findings from this study, future research will begin to identify the barriers and facilitators to cancer screening within the FN communities. New approaches need to be co-created with FN communities and Screening Programs that address the identified inequities, such as education and awareness in FN communities, enhanced FIT kit availability by mail-out (recently implemented in Alberta), and education of health care providers on delivering screening services. A continuing Data Governance Agreement between AFNIGC and ACRCSP will enable periodic ongoing surveillance to measure progress at the population level. Other current projects include extending this type of evaluation to Métis people in Alberta as well as asking them about their experiences with cancer screening, including barriers and facilitators.
This study has several limitations. Incomplete FN identifiers were used in the period following 2009, as individuals migrating into Alberta were not assigned FN status so would be excluded from the analysis. Non-status FN people could not be identified either. Among FN people in Alberta, there are many diverse communities, and many differences—such as living on versus off reserve—that likely impact the indicators studied. Similarly, the non-FN population in Alberta contains significant diversity as well as inequity between subgroups. The limited follow-up time periods of screening program data may have reduced the generalizability of the results and results may not be applicable to other provinces or territories. Limitations of the linked administrative health database can include missing or subsequently corrected information that can lead to bias and inaccuracies. Bias from missing FN identifiers is unlikely due to small migration numbers. Although all colonoscopy procedures are captured in the database, assumptions about indications were made based on time since an abnormal FIT test result so some misclassification is possible. Sufficient lag time to capture follow-up tests and results for each cycle of screening helped to ensure accurate data were used in this study. Since FIT testing dates and results are direct service data (no selection bias), the data are more accurate than administrative data collected for other purposes. Quality assurance measures that are run on the data sources as well as checks and reconciliation of each data load mitigate these potential issues. The strengths of this ACRCSP database, including large sample sizes, fecal test data obtained directly from provincial labs, exclusion of people diagnosed with CRC or are deceased, consistency of definitions and data elements, and linking of all relevant sources over many years, also alleviate these potential issues and improve the accuracy of the data. Lastly, this study did not explore why gaps in screening outcomes exist, and how these shortcomings may be mitigated.
The main objective of this study was to carry out a comprehensive evaluation of the CRC screening to diagnosis pathway among FN people in Alberta using population-level data resulting from linkages between several provincial administrative and clinical databases. To date, the magnitude of inequities in CRC screening among FN people in Alberta, and elsewhere, have not been quantified, in part due to a lack of screening data that included a comparison population group and measured trends over time.33 To fill evidence gaps along the screening and diagnosis pathway, trends in screening and follow-up participation, detection, and timeliness outcomes were examined for people participating in screening programs in Alberta with and without FN status. Work is needed to better understand and address reasons for inequities in CRC screening participation and retention and reasons for higher rates of positive screens, invasive CRCs, and later-stage diagnoses among FN people in Alberta.
Acknowledgments
These project leaders are grateful to the First Nations’ Elders, Knowledge Holders, cancer survivors, and community members who shared their knowledge, experiences, and wisdom before, during, and after the completion of this study. We are also grateful for the support from the AB First Nations Information Governance Centre team, Janetta Soup in particular. From Alberta Health Services Screening Programs, the following individuals contributed substantially to our project: Monica Schwann (Director, Screening Programs), Bonnie Chiang (Program Manager, Alberta Breast Cancer Screening Program / Alberta Cervical Cancer Screening Program), James Newsome (Program Innovation and Integration Lead), Linan Xu (Lead, Analysts) and Fengpeng Teng (statistician). Lastly, we would like to thank Dr. Amy Colquhoun from Alberta Health.
Author Contributions
David Klassen: writing—original draft preparation and final approval of the version to be submitted. Winson Y. Cheung: methodology and final approval of the version to be submitted. Angeline Letendre: conceptualization, methodology, funding acquisition, and final approval of the version to be submitted. Lea Bill: methodology, resources, supervision, and final approval of the version to be submitted. Bonnie A. Healy: conceptualization, methodology, funding acquisition, supervision, resources, and final approval of the version to be submitted. Chinmoy Roy Rahul: formal analysis, software, data curation, visualization, and final approval of the version to be submitted. Karen A. Kopciuk: conceptualization, methodology, funding acquisition, formal analysis, supervision, project administration, resources, writing—original draft preparation, and final approval of the version to be submitted. Huiming Yang: conceptualization, methodology, funding acquisition, resources, supervision, writing—original draft preparation, and final approval of the version to be submitted.
Funding
This research was funded by an operating grant received from the Canadian Institutes for Health Research (Primary Investigators Kopciuk, and Yang and Knowledge Holder Bonnie Healy), grant number DAE-162507. The funder had no role in the conduct of the research and/or preparation of the article; in the study design; in the collection, analysis, and interpretation of data; in the writing of the report; and in the decision to submit the article for publication.
Conflicts of interests
All authors declare no conflicts of interest. Conflict of interest disclosure forms (ICMJE) have been collected for all co-authors and can be accessed as supplementary material here.
Data availability
Due to the nature of the research, including the adoption of OCAP® in this project, supporting data are not available.

