


Abstract
Obesity is known to influence the circulating 25(OH)D level but less is known about whether it influences the time required to reach a stable 25(OH)D level after initiating vitamin D supplementation. This observational study was done to investigate whether BMI modified the time required to reach a steady-state 25(OH)D level in response to vitamin D supplementation. Participants in the Boston STOP IT study who were treated for 12 mo with 700 IU of vitamin D3 and 500 mg of calcium daily and had 25(OH)D measures at 0, 6, and 12 mo, were included. We assessed the trajectory of 25(OH)D levels by baseline BMI category (normal weight, BMI 18.5-24.9 kg/m2, n = 62; overweight and obese, BMI ≥ 25 kg/m2, n = 105). Baseline 25(OH)D levels were 78 ± 31.3 nmol/L (normal weight) and 74.7 ± 36.5 nmol/L (overweight and obese). In a linear mixed model examining the influence of time and baseline BMI category on change in the mean 25(OH)D level, there was a significant time x BMI group interaction (p = .024. The normal weight participants had reached steady-state 25(OH)D levels by 6 mo whereas 25(OH)D levels continued to rise between 6 and 12 mo in the overweight and obese participants. This analysis suggests that the time required to reach a steady-state 25(OH)D level after initiating vitamin D supplementation in overweight and obese adults is greater than the usual 3-mo time point commonly used in clinical practice. A more refined definition of the time course of circulating 25(OH)D response to supplementation is needed in overweight and obese individuals in order to optimize clinical monitoring of vitamin D status.
Lay Summary
Circulating 25(OH)D levels are used to assess the adequacy of vitamin D supplementation. These measurements are typically made about 3 mo after starting supplementation, when, based on current evidence in normal weight adults, the 25(OH)D level is known to stabilize. Obesity slows the production of 25(OH)D in the liver, and it is plausible that obesity may extend the time required to reach a stable 25(OH)D level in response to supplementation. In this 12-mo study in 167 older men and women who were supplemented with 700 IU of vitamin D3 daily, the average 25(OH)D concentration had reached a stable level at 6 mo in the normal weight adults but continued to increase between 6 and 12 mo in the overweight and obese adults. Additional work is needed to more precisely define the time course of change in 25(OH)D levels following supplementation in overweight and obese adults.
Introduction
It is widely recognized that obese persons have lower 25(OH)D levels than normal weight individuals1–5 and that they achieve smaller increments in circulating 25(OH)D levels in response to supplementation.4–7 In the Vitamin D and Omega-3 Trial (VITAL) study, for example, after 2 yr of treatment with 2000 IU of vitamin D3 daily, the increment in the mean 25(OH)D level in obese adults was about 10% lower than the increment in normal weight adults.5 None of these studies assessed whether obesity influenced the time required to reach steady-state 25(OH)D levels after initiating supplementation with vitamin D.
Vieth et al. measured 25(OH)D levels frequently over a 5-mo period in healthy, normal weight adults after initiating daily supplementation with 1000 and 4000 IU of vitamin D3. In each dose group, the mean 25(OH)D level rose and plateaued at 3 mo.8 Heaney et al. subsequently made a similar finding.9 Roizen et al. found that obesity reduces the activity of CYP2R1, the main vitamin D hydroxylase in the liver, in mice.10 A reduction in CYP2R1 activity, if present in overweight and obese humans, could potentially extend the time required for them to reach stable 25(OH)D levels following supplementation.
The objective of this study was to assess whether BMI influences the time required to reach a steady-state 25(OH)D level after initiating daily vitamin D supplementation. We addressed this question in participants in the Boston STOP IT study who were assigned to treatment with 700 IU of vitamin D3 and 500 mg of calcium daily.11 In the current analyses, we included the 167 participants who had complete measurements of 25(OH)D at baseline, 6 and 12 mo.
Materials and methods
The STOP IT study was a randomized, double-blind, placebo-controlled trial to test whether treatment with 700 IU of vitamin D3 and 500 mg of calcium as calcium citrate malate vs placebo daily for 3 yr decreased bone loss from the hip in healthy men and women age 65 yr and older.11 Exclusion criteria, described in detail elsewhere,11 included osteoporosis or treatment with osteoporosis drugs or steroids, and history of renal disease and kidney stones. Participants agreed not to take personal calcium or vitamin D supplements during the study. The protocol was approved by the Investigational Review Committee at Tufts University and all participants gave written informed consent.
There were 445 participants, enrolled in the STOP IT study. In this analysis we included only participants who were assigned to take 700 IU of vitamin D3 plus 500 mg of calcium daily and had complete assessments of BMI and 25(OH)D at baseline and complete measurements of 25(OH)D at 6 and 12 mo (n = 167). All analyses include the 167 participants; there were no missing covariate data.
Height was measured on a Harpendon stadiometer and weight on a digital scale. BMI was calculated as weight (kg)/height (m).2
Seasons of baseline measurements were categorized as June-November and December-May, based on previous studies in the Boston area.12 Follow-up measurements were made within 2 wk of the target dates on the 6 and 12 mo visits.
Calcium intake was assessed by food frequency questionnaire, as described previously.13
Blood was drawn on each visit after an 8-hr overnight fast. Plasma 25(OH)D was assessed by the competitive binding protein method of Preece14 and subsequently the 25(OH)D values were converted to Diasorin equivalent values. The conversion formula was based on a calibration study in which 40 samples were measured by both methods. All 25(OH)D values reported herein are estimated Diasorin values (D) which were calculated from the competitive binding protein values (C) in ng/mL as D = 5.742 + 0.538(C), as reported earlier.15
Estimated glomerular filtration rate (eGFR) was calculated according to the Chronic Kidney Disease Epidemiology Collaboration creatinine equation.16
Statistical analysis
We categorized participants at baseline into BMI groups according to standard BMI reference ranges: normal weight (18.5-24.9 kg/m2) and overweight and obese (BMI ≥ 25 kg/m2). In order to include all participants in the analysis, one participant with BMI <18.5 was included in the normal weight group (the BMI was 16.6 kg/m2); four participants with BMI >35 kg/m2 were included in the overweight and obese group (their BMIs were: 36.2, 36.9, 41.2, and 43.7 kg/m2).
Baseline characteristics including age, sex, race, BMI, weight, calcium intake, season of enrollment, and eGFR were compared in the BMI groups using t-tests for continuous variables and chi-square tests for categorical variables. Mean and SD of 25(OH)D levels were also calculated for both BMI groups at baseline, 6 mo, and 12 mo.
We fit a mixed-effects model with 25(OH)D as the outcome and fixed effects for the BMI group, time (as a categorical variable), and the BMI group by time interaction, and a random effect for participant. An unstructured covariance matrix was specified. In an adjusted model, we also added sex, age, eGFR, calcium intake, and season of enrollment as covariates. We assessed the BMI group by time interaction term to evaluate the effect of BMI group on changes in 25(OH)D levels over time, and, given a significant interaction, compared the slopes of the two BMI groups.
As an exploratory analysis, we subdivided the heavier group into overweight (BMI 25-29.9 kg/m2) and obese (BMI ≥ 30.0 kg/m2) subgroups and repeated the mixed-effects model using the three BMI groups.
Two-sided p values <.05 were considered statistically significant. Statistical analyses were conducted in SAS software (version 9.4).
Study design
This is a human observational study.
Results
The baseline clinical characteristics of participants in the two BMI groups are shown in Table 1.
Baseline characteristics by BMI groupa.
| Normal weight (BMI < 25 kg/m2) n = 62 | Overweight/obese (BMI ≥ 25 kg/m2) n = 105 | p (BMI group difference) | |
|---|---|---|---|
| Age, yr | 72.0 (5.1) | 70.2 (4.3) | .011 |
| Female, N (%) | 42 (67.7) | 46 (43.8) | .003 |
| Race, N (%) | .590 | ||
| White | 60 (96.8) | 103 (98.1) | |
| Black | 2 (3.2) | 2 (1.9) | |
| BMI, kg/m2 | 23.0 (1.8) | 28.7 (3.2) | <.0001 |
| Weight, kg | 62.7 (8.6) | 80.9 (11.4) | <.0001 |
| Calcium intake, mg/d | 710.1 (313.9) | 721.0 (364.5) | .844 |
| Season at baseline, N (%) | .367 | ||
| 1 June-30 November | 28 (45.2) | 55 (52.4) | |
| 1 December-31 May | 34 (54.8) | 50 (47.6) | |
| eGFR, mL/min | 76.8 (13.1) | 78.8 (11.9) | .324 |
aValues are mean (SD) unless otherwise specified.
Abbreviation: eGFR, estimated glomerular filtration rate.
The normal weight group was a little older and had a greater proportion of women, but calcium intake, season of measurement, and eGFR were balanced in the two groups. Compliance with the vitamin D supplement during year 1 not differ between the BMI groups. It was 95.3% in the normal-weight group and 96.4% in the overweight/obese BMI group (p = .62).
The mean (SD) within-subject weight change over the 1-yr study period was 0.1 kg ± 2.3 kg in the normal weight group and 0.4 kg ± 2.3 kg in the overweight/obese group (P for BMI group difference = 0.48).
Mean 25(OH)D levels at baseline, 6 mo, and 12 mo in the two BMI categories are shown in Table 2. Mean plasma 25(OH)D levels were numerically lower in the overweight/obese participants than in the normal weight participants at each time point, but the difference was statistically significant only at 6 mo.
Mean ± SD of 25(OH)D levels (nmol/L) by BMI group at baseline, 6 mo, and 12 mo.
| Normal Weight (BMI < 25 kg/m2) N = 62 | Overweight/Obese (BMI ≥ 25 kg/m2) N = 105 | p (BMI Group Difference) | |
|---|---|---|---|
| Baseline | 78.1 (31.6) | 74.7 (36.5) | .534 |
| 6 mo | 130.3 (42.5) | 111.1 (32.5) | .003 |
| 12 mo | 131.3 (40.8) | 118.9 (39.3) | .054 |
| Normal Weight (BMI < 25 kg/m2) N = 62 | Overweight/Obese (BMI ≥ 25 kg/m2) N = 105 | p (BMI Group Difference) | |
|---|---|---|---|
| Baseline | 78.1 (31.6) | 74.7 (36.5) | .534 |
| 6 mo | 130.3 (42.5) | 111.1 (32.5) | .003 |
| 12 mo | 131.3 (40.8) | 118.9 (39.3) | .054 |
In an unadjusted linear mixed model, there was a significant time by BMI category interaction (p = .0243), indicating that the change in 25(OH)D levels over time differed between the normal weight and overweight/obese groups. Adjustment for sex, age, calcium intake and season at baseline did not alter the interaction. The slopes describing 6- to 12-mo change in 25(OH)D levels did not differ significantly between the two BMI groups (p = .238); however, the 6- to 12-mo change in 25(OH)D differed significantly from zero in the overweight/obese group (p = .026) but not in the normal weight group (p = .821).
The adjusted mean values of 25(OH)D at the three time points for each BMI category are shown in Figure 1. The normal weight group (triangles) had reached a stable (steady-state) 25(OH)D level by 6 mo whereas the 25(OH)D level in the overweight and obese group (closed circles) continued to rise after 6 mo. In an exploratory analysis, we subdivided the heavier group into overweight and obese subgroups. As shown in the insert in Figure 1, the delay in reaching the 12-mo 25(OH)D level appeared greater in the obese subgroup (open circles) than in the overweight subgroup (closed circles).
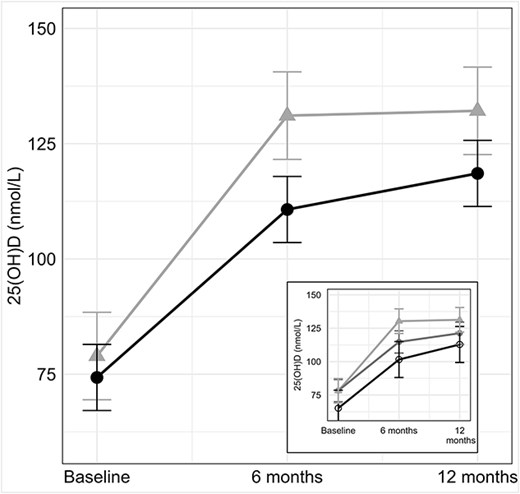
The larger figure shows the 25(OH)D levels at 0, 6 and 12 months in the normal weight (triangles) and overweight/obese (closed circles) adults. There was a significant interaction of time by BMI category (p = .0243), indicating that the change in 25(OH)D levels over time differed between the normal weight and overweight/obese groups. In the overweight/obese group, 25(OH)D levels continued to rise after 6 mo. In the smaller figure, the overweight/obese group was divided into overweight (closed circles) and obese (open circles) subgroups.
Discussion
In this cohort of generally healthy older adults who were treated daily with a modest dose of vitamin D3 and calcium, the trajectory of plasma 25(OH)D over time differed by BMI group. ln the normal weight group, the maximal 25(OH)D level, representing a steady-state level, was achieved by 6 mo. In contrast, in the overweight and obese participants, 25(OH)D levels continued to rise between 6 and 12 mo after initiating supplementation, indicating that they had not reached steady state by 6 mo. The 25(OH)D increase in the 6- to 12-mo timeframe tended to be greater in the obese than in the overweight participants, suggesting that the time required to reach steady state may be proportional to the degree of obesity. Plasma 25(OH)D levels at baseline, 6 and 12 mo in the overweight and obese group were numerically lower at each time point, with a significant difference only at 6 mo.
The finding that our normal weight adults had reached steady-state 25(OH)D levels by 6 mo is consistent with previous work of Vieth et al. who found that adults treated with doses of 1000 and 4000 IU of vitamin D3 per d reached stable 25(OH)D levels after 3 mo,8 a finding that was confirmed by Heaney et al.9 The mean weight of participants in Vieth’s study was 67 kg, a value that was not much above the mean weight of our normal weight group, 62.7 kg. The men in Heaney’s study were heavier, and had a BMI of 26.2 ± 2.4 kg/m2, which is somewhat lower than the mean BMI of our overweight and obese participants, 28.7 ± 3.2 kg/m29. Heaney identified a small increase in 25(OH)D between 2 and 4 mo (no measurement was made at 3 mo).9 Neither study assessed the impact of weight or BMI on the time required to reach plateau 25(OH)D levels. We are unaware of pharmacokinetic vitamin D studies in obese older adults, but pharmacokinetic modeling of data collected in obese children who participated in a 3-mo vitamin D intervention trial suggested that 25(OH)D levels would continue to rise for 1 yr after initiating supplementation.17 This prolonged rise in 25(OH)D level is consistent with our observation in overweight and obese older adults. The doses tested in the studies cited above8,9,17 were higher than the 700 IU/d dose we used; however, steady-state estimates are generally not dose dependent.18
After initiating vitamin D supplementation, the circulating 25(OH)D level is expected to plateau (reach steady state) after 4 or 5 half-lives.18 Jones et al. determined the half-life of 25(OH)D to be 14 d in young Gambian adults.19 Their second study yielded a similar estimate of 15 d in young British adults.18 Notably, both the young Gambian and British participants had relatively low mean BMI levels [19.1 ± 1.7 kg/m219 and 22.6 ± 2.3 kg/m2,20 respectively]. These 2-wk half-life values are compatible with the empirically derived timeframe of 3 mo required to reach a stable 25(OH)D level in normal weight adults, as observed by Vieth.8 To our knowledge, formal half-life studies have not been performed in overweight and obese adults; however, in the study of obese children cited above,17 the calculated 25(OH)D half-life ranged from 39 to 98 d, which would translate to 5.9 to 16.3 mo to reach steady-state levels. Notably, Lang et al. found that the clearance rate was inversely related to the degree of obesity in the children.17
Calcium intake may influence the 25(OH)D response to vitamin D supplementation, but the evidence is inconsistent, as pointed out by Mazahery et al.21 Bell et al. found that 2000 mg/d of supplemental calcium reduced the 25(OH)D increment in response to high dose vitamin D,22 whereas Gallagher found that 1000 mg/d of calcium increased the 25(OH)D response to vitamin D supplementation.23 A systematic review by Zittermann et al. found that overall, supplemental calcium had minimal influence on the change in 25(OH)D in response to vitamin D supplementation.3 Compared with body weight, which explained 35.4% of the variability in the 25(OH)D increment, calcium explained only 2.4%, and the net effect was to blunt the 25(OH)D increment.3 The calcium dose we used, 500 mg, is lower than that used in the above studies and unlikely to have a substantial impact on either the increment or the time required to ready a steady state 25(OH)D level.
Several mechanisms are likely involved in the extended time required to reach steady state 25(OH)D levels after initiating supplementation with vitamin D3 in overweight and obese individuals. It is established that obesity increases the vitamin D3 dose required to meet a given target 25(OH)D level. Two reported mechanisms are related to a greater distribution volume24 and potential sequestration of vitamin D in fat tissue.25 A third factor influencing the 25(OH)D response to vitamin D supplementation, the hepatic hydroxylation of vitamin D, may be involved. Until recently, the general consensus was that the hydroxylation of vitamin D to 25(OH)D in the liver was not rate limited. This concept was challenged by Roizen et al. who reported that the serum 25(OH)D level but not the vitamin D3 level was reduced in obese mice and that obesity retarded the activity of CYP2R1, the gene encoding the main liver 25-hydroxylase.10 Consistent with this, Aatsinki et al. found that high fat diet-induced obesity decreased the hepatic mRNA and protein concentration of CYP2R1 in mice.26 However, there is evidence from a study in a double knock out (of CYP2R1 and CYP27A1) mouse model that hepatic 25-hydroxylase activity was reduced substantially (by just over 50%), but not eliminated, indicating that other hepatic hydroxylases carried out the hydroxylation function.27 If inadequate 25-hydroxylase capacity in obese humans were confirmed, then use of calcifediol rather than vitamin D3 may be a useful vitamin D supplementation strategy in these individuals.
Testing overweight and obese individuals in the usual time frame of 3 mo after initiating vitamin D supplementation, or even at 6 mo, as suggested here, may give an underestimate of the steady-state 25(OH)D level and potentially lead to unneeded dose escalations. The overweight and obese sector of the global population is substantial. In the US NHANES 2017-2018 cohort, for example, 30.7% of adults, age 20-74 yr, were overweight and 42.4% were obese.28 Additional research is needed to refine the answer to the clinically important question: How long does it take overweight and obese individuals to reach a steady-state 25(OH)D level after initiating vitamin D supplementation?
Our study has strengths and limitations. The strengths are that the samples were batched for the 25(OH)D analyses and relevant variables that can affect 25(OH)D levels were carefully assessed and utilized in the analyses. It also raises awareness of a potentially significant clinical issue related to vitamin D supplementation of overweight and obese adults. The main limitation of this study is the lack of 25(OH)D measurements at 3 and 9 mo which prevents us from precisely defining the pattern of change in 25(OH)D in overweight and obese adults. Our intent is to raise awareness and to stimulate further research on a potentially important and clinically relevant aspect of vitamin D physiology. Other limitations of our study are the limited sample size and the lack of generalizability to younger populations. Finally, the 25(OH)D levels were standardized to Diasorin values rather than to an assay certified by the Vitamin D Standardization Program (VDSP) as standardized.29 Although VDSP standardization would alter the 25(OH)D levels slightly, it would not be expected to alter the timing of change in the 25(OH)D levels.
In conclusion, overweight and obese adults appear to require more time than normal weight adults to reach steady-state 25(OH)D levels after initiating vitamin D supplementation; their 25(OH)D levels were still rising after 6 mo of treatment. Further research is needed to define with more precision the impact of BMI on the timing of the 25(OH)D response vitamin D supplementation.
Author contributions
Bess Dawson-Hughes (Conceptualization, Funding acquisition, Investigation, Methodology and Original Manuscript Draft), Elsa M. Konieczynski (Data curation, Formal analysis, Data analyses, Manuscript review, Editing). and Lisa Ceglia (Review, Editing of manuscript)
Funding
This study was supported by grant AG10353 (to B.D.-H.) from the National Institutes of Health, Bethesda, MD and by the USDA Agricultural Research Service under Cooperative Agreement No. 58-8050-3-003. Any opinions, findings, conclusions, or recommendations expressed in this publication are those of the authors and do not necessarily reflect the views of the USDA or the National Institutes of Health.
Conflicts of interest
B.D.-H., E.K., and L.C. disclose no conflicts of interest related to this work.
Data availability
The data are not publicly available; however, aggregated data will be shared on reasonable request to the corresponding author.
