


Abstract
High-resolution peripheral quantitative computed tomography (HR-pQCT) has been used for in vivo 3D visualization of trabecular microstructure. Second-generation HR-pQCT (HR-pQCT II) has been shown to have good agreement with first generation HR-pQCT (HR-pQCT I). Advanced Individual Trabecula Segmentation (ITS) decomposes the trabecula network into individual plates and rods. ITS based on HR-pQCT I showed a strong correlation to ITS based on micro-computed tomography (μCT) and identified trabecular changes in metabolic bone diseases. ITS based on HR-pQCT II has new potential because of the enhanced resolution but has yet to be validated. The objective of this study was to assess the agreement between ITS based on HR-pQCT I, HR-pQCT II, and μCT to assess the capability of ITS on HR-pQCT images as a tool for studying bone structure. Freshly frozen tibia and radius bones were scanned in the distal region using HR-pQCT I at 82 μm, HR-pQCT II at 60.7 μm, and μCT at 37 μm. Images were registered, binarized, and ITS analysis was performed. Bone volume fraction (pBV/TV, rBV/TV), number density (pTb.N, rTb.N), thickness (pTb.Th, rTb.Th), and plate-to-rod (PR) ratio (pBV/rBV) of trabecular plates and rods were obtained. Paired Student’s t-tests with post hoc Bonferroni analysis were used to examine the differences. Linear regression was used to determine the correlation coefficient. The HR-pQCT I parameters were different from the μCT measurements. The HR-pQCT II parameters were different from the μCT measurements except for rTb.N, and the HR-pQCT I parameters were different from the HR-pQCT II measurements except for pTb.Th. The strong correlation between HR-pQCT II and μCT microstructural analysis (R2 = 0.55–0.94) suggests that HR-pQCT II can be used to assess changes in plate and rod microstructure and that values from HR-pQCT I can be corrected.
Introduction
High-resolution peripheral quantitative computed tomography (HR-pQCT) is an imaging modality used for in vivo 3D visualization of bone microstructure, independently of density, with minimal radiation. Trabecular and cortical regions can be imaged noninvasively and then analyzed separately. Its ability to image peripheral sites such as the distal radius and tibia in patients in vivo has recently been demonstrated.1–3 Bone microarchitecture of the trabecular and cortical regions contributes to the overall bone strength4 and is vital for assessing bone health. There has been an increase in studies using HR-pQCT to study osteoporosis and other metabolic bone diseases.5–8
The first-generation HR-pQCT (HR-pQCT I) has an isotropic voxel size of 82 μm. Its morphological and biomechanical measurements were shown to correlate strongly with gold-standard micro-computed tomography (μCT) images at 37 μm and μCT-based micro-finite element analyses.9–11 The second-generation HR-pQCT (HR-pQCT II) has an enhanced voxel size of 60.7 μm that allows for direct structural analysis of the bone microarchitecture. Trabecular morphological parameters from HR-pQCT II images were also shown to correlate strongly to μCT images.12
Additionally, Individual Trabecula Segmentation (ITS) is a robust technique used to decompose the trabecula network into individual plates and rods,13 so their volume, number, and thickness can be quantified separately. The application of ITS to HR-pQCT and μCT images has demonstrated how plate-and-rod configurations affect whole bone mechanical properties and how trabecular microstructure changes in various musculoskeletal diseases.2,14 ITS performed on HR-pQCT images of the distal radius has shown an alteration from a more plate-like to rod-like structure in osteoporotic studies.15 ITS on μCT images of the subchondral bone in osteoarthritic tibial plateaus demonstrated rod loss and plate thickening in the development of osteoarthritis.16 ITS based on HR-pQCT I- and HR-pQCT II images has new potential in musculoskeletal studies but has yet to be validated.
This study aims to assess the agreement between ITS-basedmorphological analysis on HR-pQCT I- and HR-pQCT II scans with gold-standard μCT scans of both distal radius and tibia segments. ITS-based measurements between HR-pQCT I- and HR-pQCT II images are also compared to relate bone morphology between different versions of the scanners. The results would demonstrate the capability of ITS-based analysis on HR-pQCT images as a tool in the assessment of various metabolic bone diseases.
Materials and methods
Sample preparation
Twenty-two sets of the freshly frozen left tibia (50% female) and 23 sets of left radius bones (47.8% female) were obtained from the same cadaver donors (72 ± 11 yr old) through the LifeLegacy Foundation. Specimens were scanned with X-ray and excluded from analysis if fractures were present. Distal segments (9.02 mm), corresponding to the standard scanning region for HR-pQCT, were extracted using a band saw. For the radius, this started 9.5 mm below the growth plate, and for the tibia, it was 22.5 mm below the growth plate (Figure 1). The specimens were wrapped in wet gauze and stored in plastic bags in a − 20 °C freezer and thawed before scanning. Conventional microstructural and mechanical analyses on these samples have previously been published.9,17
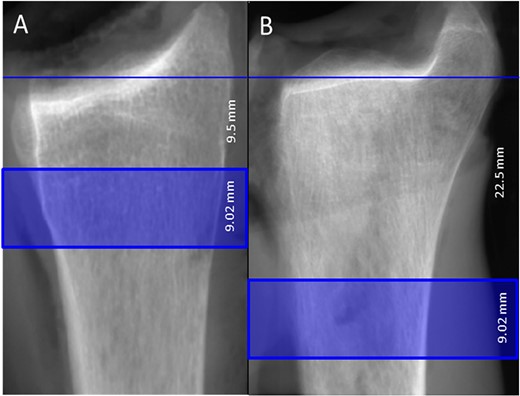
Standard scanning region (highlighted) for HR-pQCT at the distal radius (A) and tibia (B).
μCT and HR-pQCT acquisition and analysis
HR-pQCT scans (Xtreme CT I and II, Scanco Medical AG) of the distal radius and tibia segments were obtained with manufacturer settings for human participants at 82 μm and 60.7 μm with the first- and second-generation of the scanners, respectively, with manufacturer settings (60 KVp, 1 mA, 100 ms integration time). μCT scans were obtained at 25 μm isotropic voxel size (VivaCT 80, Scanco Medical AG) using ex vivo scanning settings (70 KVp, 114 μA, 700 ms integration time), and images were downscaled to 37 μm to correspond with previous studies.9
Grayscale μCT images were registered in 3D to corresponding HR-pQCT images from first- and second-generation scanners using the Scanco Image Processing Language software package. The HR-pQCT image served as the fixed image, and the μCT image was used as the moving image.18 Additionally, HR-pQCT II scans were registered to HR-pQCT I scans for comparison of ITS-based measurements between different versions of the scanner. The HR-pQCT I images served as the fixed images, and the HR-pQCT II images served as the moving images.
The manufacturer’s protocol was used to semi-automatically extract the periosteal and endosteal surface of the bone segments on the HR-pQCT images.19–21 This trabecular mask was upscaled to 37 μm to extract the corresponding trabecular region from the registered μCT and HR-pQCT image. For the HR-pQCT I images, a Laplace–Hamming filter was applied to better distinguish the edges and a global threshold using a fixed value of 40% of the maximum grayscale value to segment the images.10,11 For the HR-pQCT II and μCT images, a low-pass Gaussian filter (sigma 0.8, support 1.0) and subject-specific threshold for the distal radius and global threshold for the distal tibia were used to binarize the images based on the manufacturer recommendations.10,11
ITS-based morphological analysis
Direct voxel–based analysis on the images was performed. ITS analysis was applied to binarized HR-pQCT I, HR-pQCT II, and μCT trabecular images to determine the plate and rod microstructural parameters (Figure 2).13 This procedure has been described before, but briefly, the trabecular network was decomposed into individual plates and rods using complete volumetric decomposition. An iterative thinning procedure was used to reduce the image to a voxel-thick skeleton. Classification of the skeleton was used to separate them into surface-like or curve-like. An iterative reconstruction method was used to reconstruct the image to its original volume with trabecula classified as plates or rods from the surface-like or curve-like skeletons, respectively. Trabecular plate-and-rod morphological parameters were quantified, including bone volume fraction (BV/TV, pBV/TV, rBV/TV), axial bone volume fraction (aBV/TV), tissue fraction (pBV/BV, rBV/BV), number density (pTb.N, rTb.N [1/mm]), thickness (pTb.Th, rTb.Th [mm]), mean plate surface area (pTb.S [mm2]), mean rod length (rTb.l [mm]), rod-to-rod junction density (R-R Junc.D [1/mm3]), plate-to-rod junction density (P-R Junc.D [1/mm3]), plate-to-plate junction density (P-P Junc.D [1/mm3]), an overall plate-to-rod (PR) volume ratio (pBV/rBV), and an overall plate-to-rod (PR.N) number ratio (pTb.N/rTb.N).
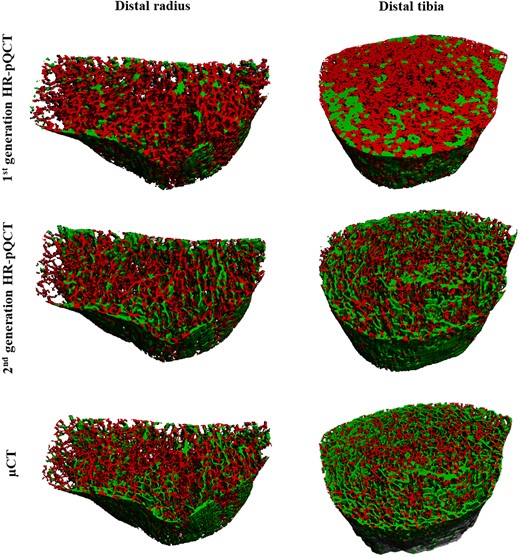
Plate and rod decomposition are shown in green and red in the distal radius and tibia in HR-pQCT images at 82 and 60.7 μm and μCT images at 37 μm.
Statistical analysis
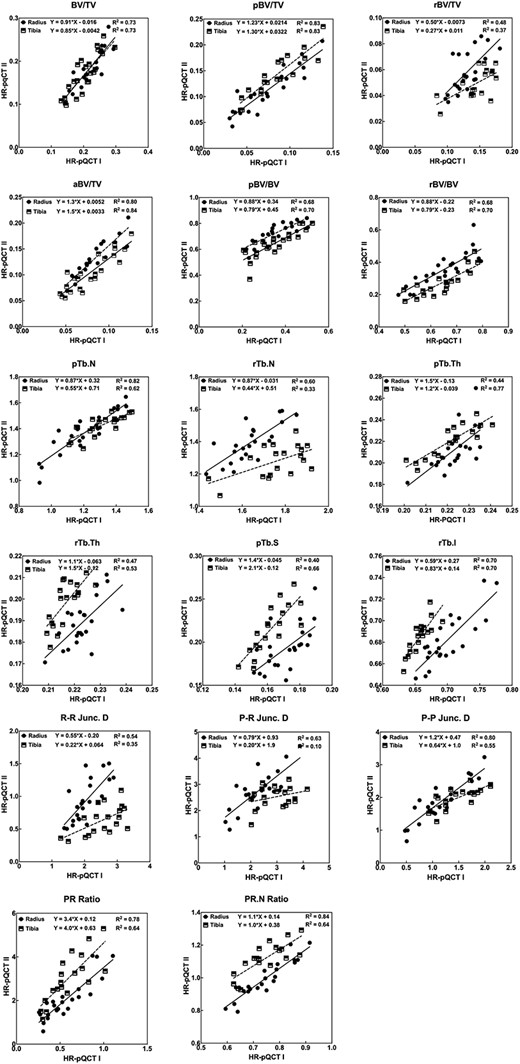
The morphological parameters based on HR-pQCT I, HR-pQCT II, and μCT images were expressed as mean and standard deviation. Plate-and-rod morphological measures from both generations of the HR-pQCT were correlated with morphological measures from μCT images. Linear regression was used to determine the correlation coefficient of morphological parameters between HR-pQCT I and μCT, HR-pQCT II and μCT, and HR-pQCT I and HR-pQCT II (Figures 3 and 4, Supplementary Figure 1, respectively). Paired Student’s t-tests with post hoc Bonferroni corrections were used to examine the difference between the 3 comparisons (P < .05).
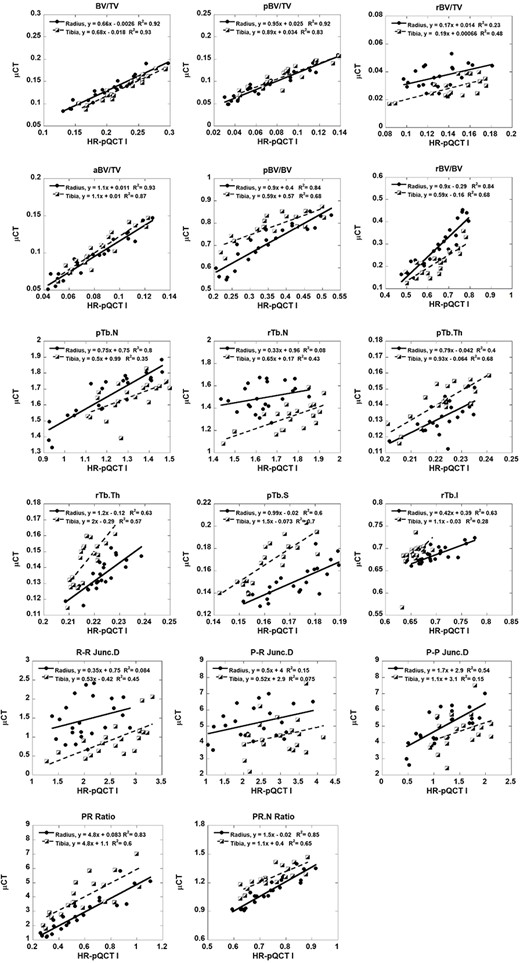
HR-pQCT I vs μCT ITS parameter correlations.
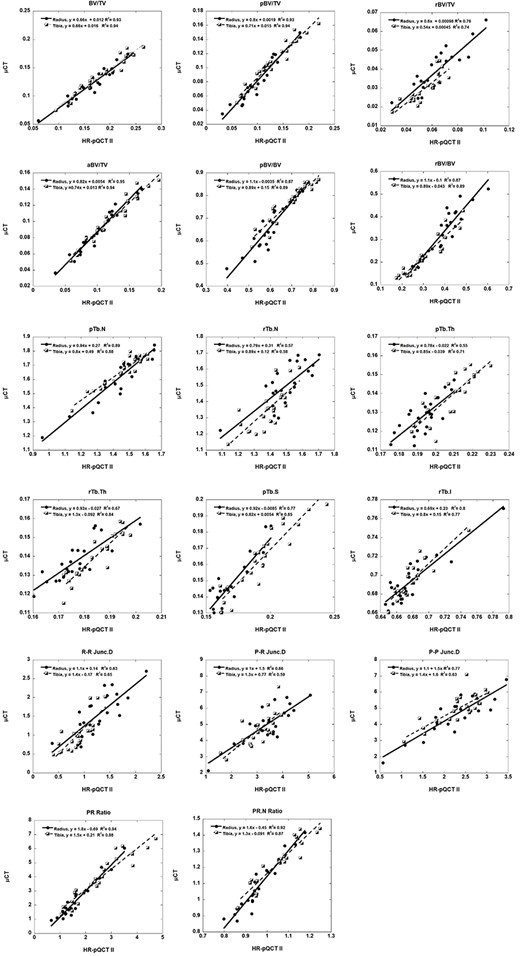
HR-pQCT II vs μCT ITS parameter correlations.
Bland–Altman plots were generated to examine the agreement between ITS-based morphological parameters in HR-pQCT I vs μCT, HR-pQCT II vs μCT, and HR-pQCT I vs HR-pQCT II (Figures 5 and 6, Supplementary Figure 2, respectively).22 The differences between morphological parameters of the imaging modalities were plotted as a function of the mean of the parameters. The linear relations of the trends were examined for significance. A correction value was calculated for the parameters where there were not statistically significant between modalities so that HR-pQCT–based measures could be linearly translated to their true value. Statistical analyses were performed by SPSS 25.0 software (SPSS Inc).
Bland Altman HR-pQCT I vs μCT.
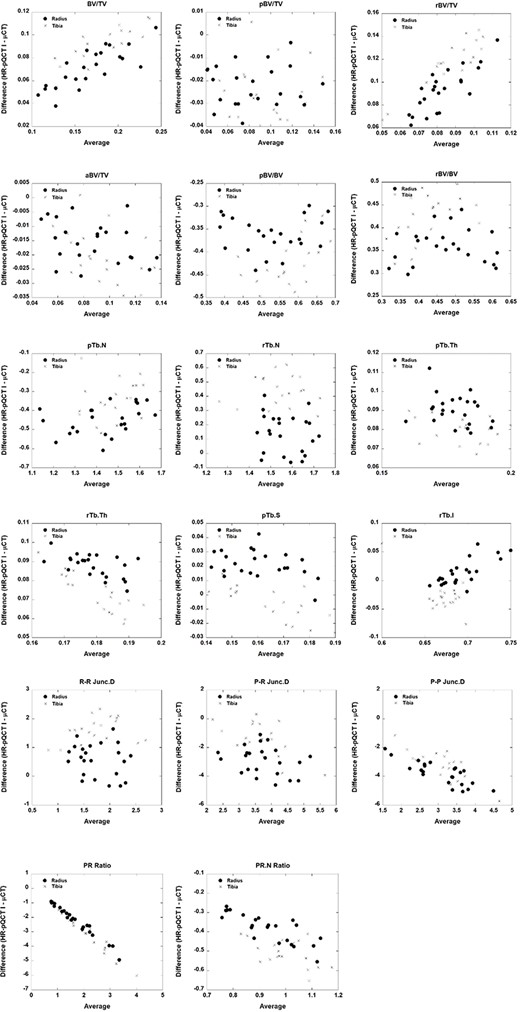
Bland Altman HR-pQCT II vs μCT.
Results
Plate and rod decomposition of the trabecular region of the radius and tibia by HR-pQCT and μCT is shown in Figure 2, with plates in green and rods in red. HR-pQCT images showed a more rod-like structure when compared to the μCT images. Qualitatively, HR-pQCT II images look more similar to μCT images than HR-pQCT I images, indicating that the improved resolution of the HR-pQCT II provides a better measure of bone morphology. The mean and standard deviation of ITS-based microstructural measurements from the HR-pQCT I and μCT images in the distal radius and tibia are shown in Table 1. Differences between measurements and correlation coefficients were determined and shown in Table 1. Comparison between HR-pQCT II and μCT measurements are shown in Table 2. Comparison between HR-pQCT I and II ITS measurements are shown in Table 3. Quantitatively, HR-pQCT images had a lower PR ratio than μCT images, corroborating the qualitative differences, as a more rod-like structure has a lower PR ratio.
HR-PQCT I vs μCT ITS morphological parameters in the distal radius and tibia with difference and correlation coefficients calculated.
| Left radius | Left tibia | |||||||||
|---|---|---|---|---|---|---|---|---|---|---|
| HR-PQCT Ic | μCTc | Absolute difference | % Difference | Coefficient of determination | HR-PQCT Ic | μCTc | Absolute difference | % Difference | Coefficient of determination | |
| Mean ± SD | Mean ± SD | HR-PQCT I—μCT [95% CI] | HR-PQCT I—μCT [95% CI] | R2 | Mean ± SD | Mean ± SD | HR-PQCT I—μCT [95% CI] | HR-PQCT I—μCT [95% CI] | R2 | |
| BV/TV | 0.203 ± 0.044 | 0.131 ± 0.030 | 0.071b [0.040, 0.103] | 54.3 [30.2, 78.4] | 0.92 | 0.228 ± 0.042 | 0.137 ± 0.029 | 0.091b [0.061, 0.122] | 66.8 [44.5, 89.1] | 0.93 |
| pBV/TV | 0.073 ± 0.032 | 0.095 ± 0.032 | −0.022b [−0.049, 0.005] | −23.1 [−51.3, 5.1] | 0.92 | 0.084 ± 0.029 | 0.108 ± 0.028 | −0.025b [−0.049, −0.001] | −22.8 [−45.0, −0.5] | 0.83 |
| rBV/TV | 0.130 ± 0.021 | 0.036 ± 0.008 | 0.093b [0.080, 0.107] | 256.7 [219.7, 293.8] | 0.23 | 0.145 ± 0.026 | 0.029 ± 0.007 | 0.116b [0.100, 0.132] | 404.0 [348.5, 459.5] | 0.47 |
| aBV/TV | 0.079 ± 0.025 | 0.095 ± 0.027 | −0.015b [−0.037, 0.007] | −16.2 [−39.7, 7.3] | 0.93 | 0.084 ± 0.021 | 0.104 ± 0.025 | −0.020b [−0.040, −0.001] | −19.6 [−38.4, −0.7] | 0.87 |
| pBV/BV | 0.347 ± 0.095 | 0.708 ± 0.094 | −0.361b [−0.441, −0.282] | −51.0 [−62.2, −39.8] | 0.84 | 0.361 ± 0.087 | 0.784 ± 0.062 | −0.423b [−0.487, −0.359] | −54.0 [−62.1, −45.8] | 0.68 |
| rBV/BV | 0.653 ± 0.095 | 0.292 ± 0.094 | 0.361b [0.282, 0.441] | 123.6 [96.3, 150.8] | 0.84 | 0.639 ± 0.087 | 0.216 ± 0.062 | 0.423b [0.359, 0.487] | 195.8 [166.3, 225.3] | 0.68 |
| pTb.N | 1.213 ± 0.171 | 1.661 ± 0.143 | −0.448b [−0.581, −0.315] | −27.0 [−35.0, −19.0] | 0.80 | 1.305 ± 0.123 | 1.647 ± 0.104 | −0.342b [−0.438, −0.246] | −20.8 [−26.6, −14.9] | 0.35 |
| rTb.N | 1.638 ± 0.105 | 1.495 ± 0.122 | 0.143b [0.047, 0.238] | 9.5 [3.1, 15.9] | 0.08 | 1.762 ± 0.130 | 1.323 ± 0.130 | 0.439b [0.330, 0.548] | 33.2 [24.9, 41.4] | 0.43 |
| pTb.Th | 0.223 ± 0.008 | 0.133 ± 0.010 | 0.090b [0.082, 0.098] | 67.7 [61.9, 73.5] | 0.40 | 0.222 ± 0.011 | 0.141 ± 0.012 | 0.080b [0.071, 0.090] | 56.9 [50.0, 63.9] | 0.67 |
| rTb.Th | 0.223 ± 0.007 | 0.135 ± 0.010 | 0.088b [0.081, 0.095] | 65.0 [59.9, 70.2] | 0.63 | 0.217 ± 0.005 | 0.143 ± 0.013 | 0.073b [0.065, 0.082] | 51.0 [45.0, 57.0] | 0.57 |
| pTb.S | 0.171 ± 0.012 | 0.150 ± 0.015 | 0.022a [0.010, 0.033] | 14.4 [6.8, 22.0] | 0.60 | 0.162 ± 0.011 | 0.168 ± 0.019 | −0.006a [−0.019, 0.007] | −3.6 [−11.5, 4.3] | 0.70 |
| rTb.l | 0.699 ± 0.034 | 0.686 ± 0.018 | 0.013b [−0.009, 0.036] | 1.9 [−1.3, 5.2] | 0.63 | 0.658 ± 0.016 | 0.686 ± 0.032 | −0.028b [−0.049, −0.007] | −4.1 [−7.2, −1.0] | 0.28 |
| R-R Junc.Dc | 2.050 ± 0.430 | 1.470 ± 0.522 | 0.580b [0.177, 0.983] | 39.5 [12.1, 66.8] | 0.08 | 2.554 ± 0.583 | 0.936 ± 0.460 | 1.617b [1.176, 2.059] | 172.7 [125.5, 219.9] | 0.45 |
| P-R Junc.Dc | 2.297 ± 0.752 | 5.181 ± 0.979 | −2.884b [−3.619, −2.149] | −55.7 [−69.8, −41.5] | 0.15 | 2.947 ± 0.651 | 4.397 ± 1.227 | −1.450b [−2.276, −0.623] | −33.0 [−51.8, −14.2] | 0.08 |
| P-P Junc.Dc | 1.185 ± 0.459 | 4.982 ± 1.082 | −3.797b [−3.013, −1.450] | −76.2 [−90.3, −62.2] | 0.54 | 1.487 ± 0.385 | 4.666 ± 1.095 | −3.179b [−3.870, −2.488] | −68.1 [−82.9, −53.3] | 0.15 |
| PR Ratio | 0.565 ± 0.245 | 2.796 ± 1.290 | −2.232b [−3.013, −1.450] | −79.8 [−107.8, −51.9] | 0.83 | 0.593 ± 0.223 | 3.986 ± 1.378 | −3.392b [−4.223, −2.562] | −85.1 [−106.0, 64.3] | 0.60 |
| PR N Ratio | 0.740 ± 0.089 | 1.120 ± 0.149 | −0.380b [−0.483, −0.277] | −33.9 [−43.1, −24.7] | 0.85 | 0.744 ± 0.081 | 1.253 ± 0.115 | −0.509b [−0.593, −0.426] | −40.6 [−47.3, −34.0] | 0.65 |
aP < .05, bP < .0001; Abbreviation: cHR-pQCT, high-resolution peripheral quantitative computed tomography; ITS, individual trabecula segmentation; μCT, micro-computed tomography; P-P Junc.D, plate-to-plate junction density; P-R Junc.D, plate-to-rod junction density; R-R Junc.D, rod-to-rod junction density.
HR-PQCT II vs μCT ITS morphological parameters in the distal radius and tibia with difference and correlation coefficients calculated.
| Left radius | Left tibia | |||||||||
|---|---|---|---|---|---|---|---|---|---|---|
| HR-PQCT IIc | μCTc | Absolute difference | % Difference | Coefficient of determination | HR-PQCT IIc | μCTc | Difference | % Difference | Coefficient of determination | |
| Mean ± SD | Mean ± SD | HR-PQCT II—μCT [95% CI] | HR-PQCT II—μCT [95% CI] | R2 | Mean ± SD | Mean ± SD | HR-PQCT II—μCT [95% CI] | HR-PQCT II—μCT [95% CI] | R2 | |
| BV/TV | 0.166 ± 0.043 | 0.122 ± 0.030 | 0.043 [0.012, 0.075]b | 35.4 [9.9, 60.9] | 0.93 | 0.185 ± 0.046 | 0.138 ± 0.031 | 0.047 [0.014, 0.081]b | 34.3 [9.9, 58.6] | 0.94 |
| pBV/TV | 0.103 ± 0.038 | 0.084 ± 0.031 | 0.019 [−0.010, 0.048]a | 22.5 [−12.1, 57.1] | 0.93 | 0.132 ± 0.044 | 0.108 ± 0.032 | 0.023 [−0.010, 0.056]b | 21.4 [−8.9, 51.7] | 0.94 |
| rBV/TV | 0.063 ± 0.017 | 0.039 ± 0.011 | 0.025 [0.013, 0.036]b | 63.4 [32.6, 94.2] | 0.76 | 0.054 ± 0.012 | 0.030 ± 0.008 | 0.024 [0.015, 0.033]b | 81.3 [51.0, 111.6] | 0.74 |
| aBV/TV | 0.099 ± 0.032 | 0.086 ± 0.027 | 0.013 [−0.012, 0.038]a | 14.9 [−13.9, 43.7] | 0.95 | 0.123 ± 0.037 | 0.104 ± 0.029 | 0.019 [−0.009, 0.048]b | 18.5 [−9.0, 46.0] | 0.94 |
| pBV/BV | 0.606 ± 0.091 | 0.668 ± 0.108 | −0.062 [−0.146, 0.022]b | −9.3 [−21.9, 3.3] | 0.87 | 0.697 ± 0.089 | 0.774 ± 0.084 | −0.076 [−0.151, −0.002]b | −9.9 [−19.5, −0.2] | 0.89 |
| rBV/BV | 0.394 ± 0.091 | 0.332 ± 0.108 | 0.062 [−0.022, 0.146]b | 18.7 [−6.6, 44.0] | 0.87 | 0.303 ± 0.089 | 0.226 ± 0.084 | 0.076 [0.002, 0.151]b | 33.8 [0.8. 66.8] | 0.89 |
| pTb.N | 1.438 ± 0.166 | 1.614 ± 0.165 | −0.176 [−0.315, −0.037]b | −10.9 [−19.5, −2.3] | 0.89 | 1.466 ± 0.129 | 1.667 ± 0.110 | −0.201 [−0.304, −0.098]b | −12.1 [−18.2, −5.9] | 0.88 |
| rTb.N | 1.495 ± 0.131 | 1.497 ± 0.137 | −0.001 [−0.114, 0.111] | −0.1 [−7.6, 7.4] | 0.57 | 1.382 ± 0.112 | 1.351 ± 0.130 | 0.031 [−0.073, 0.136]a | 2.3 [−5.4, 10.0] | 0.58 |
| pTb.Th | 0.194 ± 0.009 | 0.128 ± 0.010 | 0.065 [0.057, 0.073]b | 50.8 [44.7, 56.9] | 0.55 | 0.208 ± 0.012 | 0.139 ± 0.012 | 0.069 [0.059, 0.080]b | 50.1 [42.4, 57.8] | 0.71 |
| rTb.Th | 0.177 ± 0.009 | 0.137 ± 0.010 | 0.039 [0.031, 0.048]b | 28.7 [22.7, 34.7] | 0.67 | 0.184 ± 0.009 | 0.140 ± 0.012 | 0.044 [0.035, 0.053]b | 31.8 [25.3, 38.2] | 0.83 |
| pTb.S | 0.170 ± 0.015 | 0.148 ± 0.016 | 0.022 [0.009, 0.035]b | 14.7 [6.0, 23.3] | 0.77 | 0.194 ± 0.022 | 0.164 ± 0.020 | 0.029 [0.011, 0.048]b | 17.9 [6.9, 28.9] | 0.85 |
| rTb.l | 0.678 ± 0.032 | 0.694 ± 0.024 | −0.0016 [−0.039, 0.008]b | −2.3 [−5.7, 1.2] | 0.80 | 0.677 ± 0.021 | 0.694 ± 0.019 | −0.017 [−0.034, 0.001]b | −2.4 [−4.9, 17.1] | 0.78 |
| R-R Junc.Dc | 1.255 ± 0.401 | 1.528 ± 0.561 | −0.273 [−0.683, 0.137]b | −17.9 [−44.7, 9.0] | 0.63 | 0.875 ± 0.271 | 1.023 ± 0.456 | −0.148 [−0.471, 0.175]b | −14.5 [−46.0, 17.1] | 0.65 |
| P-R Junc.Dc | 3.426 ± 0.841 | 5.046 ± 1.084 | −1.620 [−2.437, −0.803]b | −32.1 [−48.3, −15.9] | 0.66 | 3.012 ± 0.630 | 4.611 ± 1.044 | −1.599 [−2.341, −0.857]b | −34.7 [−50.8, −18.6] | 0.59 |
| P-P Junc.Dc | 2.291 ± 0.671 | 4.650 ± 1.180 | −2.359 [−3.167, −1.552]b | −50.7 [−68.1, −33.4] | 0.77 | 2.275 ± 0.530 | 4.900 ± 0.964 | −2.625 [−3.294, −1.956]b | −53.6 [−67.2, −39.9] | 0.63 |
| PR Ratio | 1.700 ± 0.714 | 2.408 ± 1.348 | −0.708 [−1.626, 0.183]b | −30.0 [−67.5, 7.6] | 0.94 | 2.583 ± 1.035 | 3.958 ± 1.600 | −1.375 [−2.535, −0.215]b | −34.7 [−64.0, −5.4] | 0.88 |
| PR N Ratio | 0.963 ± 0.093 | 1.087 ± 0.156 | −0.124 [−0.232, −0.016]b | −11.4 [−21.4, −1.5] | 0.92 | 1.065 ± 0.105 | 1.245 ± 0.141 | −0.180 [−0.286, −0.073]b | −14.4 [−23.0, −5.9] | 0.88 |
aP < .05, bP < .0001; Abbreviations: cHR-pQCT, high-resolution peripheral quantitative computed tomography; ITS, individual trabecula segmentation; μCT, micro-computed tomography; P-P Junc.D, plate-to-plate junction density; P-R Junc.D, plate-to-rod junction density; R-R Junc.D, rod-to-rod junction density.
HR-PQCT I vs HR-PQCT II ITS morphological parameters in the distal radius and tibia with difference and correlation coefficients calculated.
| Left radius | Left tibia | |||||||||
|---|---|---|---|---|---|---|---|---|---|---|
| HR-PQCT Ic | HR-PQCT IIc | Absolute difference | % Difference | Coefficient of determination | HR-PQCT Ic | HR-PQCT IIc | Absolute Difference | % Difference | Coefficient of determination | |
| Mean ± SD | Mean ± SD | HR-PQCT I—HR-PQCT II [95% CI] | HR-PQCT I—HR-PQCT II [95% CI] | R2 | Mean ± SD | Mean ± SD | HR-PQCT I—HR-PQCT II [95% CI] | HR-PQCT I—HR-PQCT II [95% CI] | R2 | |
| BV/TV | 0.203 ± 0.044 | 0.169 ± 0.047 | 0.034b [−0.005, 0.072] | 16.6 [−2.2, 35.5] | 0.73 | 0.228 ± 0.042 | 0.181 ± 0.050 | 0.047b [0.007, 0.088] | 20.7 [3.0, 38.5] | 0.73 |
| pBV/TV | 0.073 ± 0.032 | 0.111 ± 0.043 | −0.038b [−0.070, −0.006] | −52.3 [−96.0, −8.5] | 0.83 | 0.084 ± 0.029 | 0.133 ± 0.047 | −0.049 [−0.084, −0.014]b | −58.6 [−100.1, −17.2] | 0.83 |
| rBV/TV | 0.130 ± 0.021 | 0.058 ± 0.015 | 0.072b [0.056, 0.088] | 55.4 [43.4, 67.5] | 0.48 | 0.145 ± 0.026 | 0.048 ± 0.012 | 0.096b [0.079, 0.114] | 66.5 [54.4, 78.7] | 0.37 |
| aBV/TV | 0.079 ± 0.025 | 0.105 ± 0.036 | −0.026b [−0.052, 0.000] | −32.9 [−65.8, −0.1] | 0.80 | 0.084 ± 0.021 | 0.123 ± 0.044 | −0.039b [−0.069, −0.009] | −46.6 [−83.0, −10.3] | 0.84 |
| pBV/BV | 0.347 ± 0.095 | 0.643 ± 0.101 | −0.296b [0.213, 0.379] | −85.4 [−109.3, −61.5] | 0.68 | 0.361 ± 0.087 | 0.716 ± 0.093 | −0.356b [−0.435, −0.276] | −98.5 [−120.5, −76.6] | 0.70 |
| rBV/BV | 0.653 ± 0.095 | 0.357 ± 0.0101 | 0.296b [−0.304, -0.021] | 45.3 [32.6, 58.0] | 0.68 | 0.639 ± 0.087 | 0.284 ± 0.093 | 0.356b [0.76, 0.435] | 55.6 [43.2, 68.0] | 0.70 |
| pTb.N | 1.213 ± 0.171 | 1.376 ± 0.165 | −0.162b [−0.304, −0.021] | −13.4 [−25.0, −1.7] | 0.82 | 1.305 ± 0.123 | 1.393 ± 0.128 | −0.088b [−0.198, 0.023] | −6.7 [−15.2, 1.8] | 0.62 |
| rTb.N | 1.638 ± 0.105 | 1.394 ± 0.118 | 0.244b [0.150, 0.338] | 14.9 [9.1, 20.6] | 0.60 | 1.762 ± 0.130 | 1.275 ± 0.101 | 0.487b [0.384, 0.589] | 27.6 [21.8, 33.4] | 0.33 |
| pTb.Th | 0.223 ± 0.008 | 0.212 ± 0.009 | 0.011 [−0.001, 0.023] | 4.9 [−0.6, 10.4] | 0.44 | 0.222 ± 0.011 | 0.220 ± 0.015 | 0.001a [−0.010, 0.013] | 0.6 [−4.5, 5.8] | 0.77 |
| rTb.Th | 0.223 ± 0.007 | 0.189 ± 0.011 | 0.034b [0.026, 0.042] | 15.2 [11.9, 18.6] | 0.47 | 0.217 ± 0.005 | 0.197 ± 0.011 | 0.020b [0.012, 0.027] | 9.0 [5.7, 12.4] | 0.53 |
| pTb.S | 0.171 ± 0.012 | 0.193 ± 0.026 | −0.022b [−0.039, −0.005] | −12.6 [−22.5, −2.7] | 0.40 | 0.162 ± 0.011 | 0.212 ± 0.028 | −0.050a [−0.069, −0.031] | −31.0 [−42.6, −19.3] | 0.66 |
| rTb.l | 0.699 ± 0.034 | 0.681 ± 0.024 | 0.018b [−0.007, 0.042] | 2.6 [−0.9, 6.0] | 0.70 | 0.658 ± 0.016 | 0.686 ± 0.016 | −0.029a [−0.043, −0.015] | −4.4 [−6.5, −2.2] | 0.70 |
| R-R Junc.Dc | 2.050 ± 0.430 | 0.939 ± 0.323 | 1.111b [0.791, 1.432] | 54.2 [38.6, 69.8] | 0.54 | 2.554 ± 0.583 | 0.638 ± 0.216 | 1.916b [1.528, 2.303] | 75.0 [59.8, 90.2] | 0.35 |
| P-R Junc.Dc | 2.297 ± 0.752 | 2.758 ± 0.754 | −0.461a [−1.095, 0.173] | −20.1 [−47.7, 7.5] | 0.63 | 2.947 ± 0.651 | 2.435 ± 0.485 | 0.512a [0.007, 1.017] | 17.4 [0.2, 34.5] | 0.10 |
| P-P Junc.Dc | 1.185 ± 0.459 | 1.905 ± 0.622 | −0.721b [−1.181, −0.261] | −60.8 [−99.7, −22.0] | 0.80 | 1.487 ± 0.385 | 1.898 ± 0.439 | −0.411b [−0.774, −0.048] | −27.7 [−52.1, −3.2] | 0.55 |
| PR Ratio | 0.565 ± 0.245 | 2.038 ± 0.945 | −1.473b [−2.054, −0.892] | −260.9 [−363.8, −158.0] | 0.78 | 0.593 ± 0.223 | 2.869 ± 1.165 | −2.276b [−3.015, −1.537] | −383.6 [−508.2, −259.1] | 0.64 |
| PR N Ratio | 0.740 ± 0.089 | 0.989 ± 0.112 | −0.249b [−0.334, −0.164] | −33.6 [−45.1, −22.1] | 0.84 | 0.744 ± 0.081 | 1.097 ± 0.115 | −0.353b [−0.441, −0.265] | −47.4 [−59.3, −35.6] | 0.64 |
aP< .05, bP < .0001; Abbreviations: cHR-pQCT, high-resolution peripheral quantitative computed tomography; P-P Junc.D, plate-to-plate junction density; P-R Junc.D, plate-to-rod junction density; R-R Junc.D, rod-to-rod junction density.
First-generation HR-pQCT vs micro-computed tomography
All HR-pQCT I ITS–based measurements were statistically different from μCT ITS measurements (Table 1). All parameters were strongly correlated except pTb.N, rTb.l, P-R Junc.D, and P-P Junc.D. between HR-pQCT I and μCT (R2 = 0.08–0.35) (Figure 3). BV/TV correlated the best in both the distal radius and tibia (R2 = 0.92 and 0.93, respectively). Plate-based parameters pBV/TV, pTb.N, and pTb.Th (R2 = 0.35–0.92) correlated better than rod-based parameters rBV/TV, rTb.N, and rTb.Th (R2 = 0.08–0.63). Compared to μCT, HR-pQCT I significantly overestimated BV/TV and underestimated the PR ratio by a factor of ~4.8 in the distal radius and ~6.7 in the distal tibia.
Second-generation HR-pQCT vs micro-computed tomography
All HR-pQCT II parameters were statistically different from the μCT measurements except rTb.N (Table 2). HR-pQCT II was also strongly correlated to μCT and showed an improvement from HR-pQCT I as shown in Figure 4. Second-generation pTb.N and rTb.N showed improvement in the distal radius from first-generation correlations (R2 = 0.80–0.81 and R2 = 0.08–0.58) and also demonstrated improvement in the distal tibia (R2 = 0.35–0.88 and R2 = 0.43–0.58). Rod-based parameter rBV/TV was also improved in HR-pQCT II images. rTb.Th correlated about the same in both HR-pQCT I and II images. PR ratio was also improved in HR-pQCT II images and was only underestimated by ~1.4 in the distal radius and ~ 1.5 in the distal tibia.
First-generation HR-pQCT vs second-generation HR-pQCT
All HR-pQCT I parameters were statistically different from HR-pQCT II measurements except pTb.Th (Table 3). HR-pQCT I and II images underestimated the plate parameters of pBV/TV and pTb.N, while overestimating the rod parameters of rBV/TV and rTb.N. BV/TV, pTb.Th, and rTb.Th were overestimated in both generations of HR-pQCT images compared to the μCT images. These trends were consistent when comparing the HR-pQCT II images to the HR-pQCT I images, except for pTb.Th, which was not statistically different between the 2 generations of HR-pQCT images. All parameters were moderately to strongly correlated between HR-pQCT I- and HR-pQCT II (R2 = 0.30–0.85) (Supplementary Figure 1).
Corrections from Bland–Altman plots
Table 4 highlights the parameters that were not statistically significant between HR-pQCT I and μCT. pBV/TV, aBV/TV, pBV/BV, rBV/BV, pTb.N, rTb.N, pTb.Th, and R-R Junc.D could be adjusted for both the distal radius and tibia. pTb.S could be adjusted in the radius, and rTb.l could be adjusted in the tibia. Table 5 compares HR-pQCT II and μCT, which shows that rBV/TV, aBV/TV, pBV/BV, rBV/BV, pTb.N, rTb.N, pTb.Th, pTb.S, and rTb.l could be adjusted for both the distal radius and tibia. pBV/TV and rTb.Th could only be adjusted for the radius. Table 6 shows the correction values between HR-pQCT I and II measurements to adjust between the different versions of the HR-pQCT scanner. In comparing HR-pQCT I and II, BV/TV, pBV/BV, rBV/BV, and rTb.N could be adjusted for both the distal radius and tibia. rTb.l and PR Junc.D could be adjusted for the radius and pTb.N, pTb.Th, and PP Junc.D could be adjusted for the tibia.
Correction value for first-generation HR-pQCTa–based ITS analyses to true μCTa value. HR-pQCT parameters plus correction value equal true value. Those parameters which were not shown in the table have significant linear relations in the Bland–Altman plots.
| Radius | Tibia | |||
|---|---|---|---|---|
| Correction value | P-value | Correction value | P-value | |
| pBV/TV | 0.022 | .90 | 0.025 | .82 |
| aBV/TV | 0.015 | .14 | 0.020 | .05 |
| pBV/BV | 0.361 | .84 | ||
| rBV/BV | −0.361 | .84 | ||
| pTb.N (1/mm) | 0.448 | .08 | 0.342 | .40 |
| rTb.N (1/mm) | −0.143 | .48 | 0.439 | .99 |
| pTb.Th (mm) | −0.090 | .21 | −0.080 | .40 |
| pTb.S (mm2) | −0.022 | .08 | ||
| R-R Junc.D (1/mm3)a | −0.580 | .36 | −1.617 | .20 |
| P-R Junc.D (1/mm3)a | 2.884 | .20 | ||
Abbreviations: aHR-pQCT, high-resolution peripheral quantitative computed tomography; μCT, micro-computed tomography; P-R Junc.D, plate-to-rod junction density; R-R Junc.D, rod-to-rod junction density.
Correction value for second-generation HR-pQCTa–based ITS analyses to true μCTa value. HR-pQCT parameters plus correction value equal true value. Those parameters which were not shown in the table have significant linear relations in the Bland–Altman plots.
| Radius | Tibia | |||
|---|---|---|---|---|
| Correction value | P-value | Correction value | P-value | |
| pBV/BV | −0.023 | .45 | ||
| rBV/BV | −0.024 | .45 | ||
| pTb.N (1/mm) | 0.176 | .94 | 0.201 | .05 |
| rTb.N (1/mm) | 0.001 | .75 | −0.031 | .30 |
| pTb.Th (mm) | −0.065 | .75 | −0.069 | .93 |
| rTb.Th (mm) | −0.039 | .34 | ||
| pTb.S (mm2) | −0.022 | .65 | −0.029 | .19 |
| rTb.l (mm) | 0.017 | .41 | ||
| P-R Junc.D (1/mm3)a | 1.620 | .06 | ||
Abbreviations: aHR-pQCT, high-resolution peripheral quantitative computed tomography; ITS, individual trabecula segmentation; P-R Junc.D, plate-to-rod junction density.
Correction value for first-generation HR-pQCTa–based ITSa analyses to true second-generation HR-pQCT value. HR-pQCT parameters plus correction value equal true value. Those parameters which were not shown in the table have significant linear relations in the Bland–Altman plots.
| Radius | Tibia | |||
|---|---|---|---|---|
| Correction value | P-value | Correction value | P-value | |
| BV/TV | −0.037 | .27 | −0.038 | .82 |
| pBV/BV | 0.366 | .98 | ||
| rBV/BV | −0.366 | .98 | ||
| pTb.N (1/mm) | 0.140 | .21 | 0.118 | .15 |
| rTb.N (1/mm) | −0.242 | .50 | ||
| pTb.Th (mm) | −0.011 | .51 | 0.000 | .15 |
| rTb.l (mm) | 0.024 | .11 | ||
| R-R Junc.D (1/mm3)a | −1.102 | .05 | ||
| P-R Junc.D (1/mm3)a | 0.403 | .53 | ||
| P-P Junc.D (1/mm3) | 0.493 | .89 | ||
Abbreviation: aHR-pQCT, high-resolution peripheral quantitative computed tomography; ITS, individual trabecula segmentation; P-P Junc.D, plate-to-plate junction density; P-R Junc.D, plate-to-rod junction density; R-R Junc.D, rod-to-rod junction density.
Discussion
This study evaluates the accuracy of ITS-based analysis on HR-pQCT I, HR-pQCT II, and μCT images of the distal radius and tibia. Generally, the HR-pQCT ITS parameters differed significantly from μCT ITS parameters but correlated strongly. Trabecular plate-related morphological parameters of HR-pQCT ITS were more strongly correlated than trabecular rod parameters, except for pTb.Th and rTb.Th. The strong correlation of BV/TV, pBV/TV, and rBV/TV between both HR-pQCT I and II and μCT microstructural analysis suggests that HR-pQCT can be used to assess changes in plate and rod microstructure in human participants despite the significant differences in numerical values of ITS-based measurements. These trends were consistent with a previous study where μCT images were downscaled to limited spatial resolutions to simulate HR-pQCT II images, and plate-based morphological parameters correlated strongly.23 pBV/TV and pTb.N had a stronger correlation than rBV/TV and rTb.N, suggesting that rod measurements are susceptible to noise in the lower-resolution HR-pQCT images. Significant differences in the HR-pQCT measurements could be due to partial volume effects in the lower-resolution images. HR-pQCT image voxel size (82 μm or 60.7 μm) was on the order of the thickness of an individual trabecula so those images would capture a trabecula in 1–2 voxels, whereas the smaller voxel size of the μCT image (37 μm) could capture a trabecula in 3–4 voxels. Therefore, the ITS procedure on HR-pQCT images would break up a plate-like trabecula into several, smaller rod-like trabecula during decomposition, leading to an underestimation of plate parameters and overestimation of rod parameters and a more disconnected structure. Bone can either be present or not present in a particular voxel, leading to partial volume effects and an increased trabecula thickness since thresholding cannot account for part of a voxel containing bone. This was also reflected in an overestimation of BV/TV in the HR-pQCT images, due to the overestimation of pTb.Th and rTb.Th. Binarizing the grayscale images requires a balance of choosing a threshold that captures enough trabecula to reduce the noise in the image.
The rod-based morphological parameters depended on the grayscale threshold used to examine the image. A lower threshold resulted in weaker correlations between both generations of the HR-pQCT and μCT images. Recent studies used fixed thresholds for image segmentation but were not the same between studies, even on the same scanner.24 rTb.l was also dependent on the separation of the cortical and trabecular structures. For cadaver samples with very porous cortical structure and resembling the trabecular structure, it was difficult to distinguish where the compartments should be separated. If too much cortical structure was included in the ITS analysis, the rBV/TV, rTb.N, rTb.Th and rTb.l did not correlate well. In the lower-resolution HR-pQCT I and II images, the pores in the cortical structure were harder to distinguish from the trabecular structure, as was seen in previous studies.19,24 The trabecular contours on the HR-pQCT images were adjusted in regions that were not contiguous to ensure a good correlation of the morphological parameters.
To be used on human participants, HR-pQCT measurements could be adjusted by correction values to approach true values measured by gold-standard μCT, though values would be dependent on the anatomic site since radius and tibia correlations differed. From the Bland–Altman analyses, corrected values were calculated for parameters that were determined not to have a significant difference between mean and difference. In HR-pQCT I scans, pBV/TV was underestimated, and rBV/TV was overestimated compared to gold-standard μCT scans, which would have implications in studying bone microstructure in osteoporosis and other metabolic diseases. An underestimation of pBV/TV and overestimation of rBV/TV could lead to an incorrect diagnosis of osteoporosis, emphasizing the need to correct for true values from μCT scans. HR-pQCT II scans were able to better assess pBV/TV than HR-pQCT I scans. Previous studies have shown that pBV/TV and aBV/TV are the morphological parameters most strongly correlated with bone strength.25 HR-pQCT ITS measurements of pBV/TV and aBV/TV can be reliably used to characterize morphological changes in HR-pQCT studies of humans and provide insight into bone microstructural changes related to bone quality. The validation of ITS-based morphological measurements of HR-pQCT I and II images to gold-standard μCT demonstrates the capability of ITS to be used to assess bone microstructure at a reduced resolution. The enhanced voxel size of the HR-pQCT II at 60.7 μm could provide more accurate trabecular plate and rod microstructural measurements.
HR-pQCT I scans can also be analyzed using a standard patient evaluation and μCT-based direct voxel evaluation protocol to derive morphological parameters. The former method results in a more accurate quantitative assessment of the structure but depends on the derived BV/TVd and Tb.N. These parameters are model-dependent and cannot be corrected to morphological parameters at other imaging resolutions. Direct μCT–based standard evaluation of the HR-pQCT I images resulted in overestimating the BV/TV and Tb.Th.9,10 This study used a direct voxel–based analysis and observed similar trends in BV/TV, pTb.Th and rTb.Th. Despite the numerical differences, the HR-pQCT model-independent direct voxel–based measurements were highly correlated to μCT parameters.
There are several limitations to this study. Because we scanned cadaver samples, there were no motion artifacts in the images, so it remains to be investigated how motion could affect ITS-based morphological parameters. The ITS measurements were validated for the distal radius and distal tibia separately. Even at those 2 peripheral sites, the linear regressions varied based on the plate-and-rod composition of the site. The results may not be valid for other sites, such as the vertebrae, which may be more indicative of the state of a disease like osteoporosis. The cadaver samples also came from an older population so validation with a younger population may be necessary. Despite these shortcomings, the correlation of ITS-based measurements was strong in both the HR-pQCT I and II scans at the examined sites.
In conclusion, we validated the accuracy of ITS-based morphological measurements on HR-pQCT I and II images compared to μCT images of the human distal radius and tibia. Strong correlations of both plate and rod parameters suggest that they can be distinguished in a limited spatial resolution and assessed in human participants. HR-pQCT ITS–based analysis could have new potential in musculoskeletal studies, including assessing the bone microstructure of osteoporotic patients and tracking the progression of osteoarthritis and other metabolic diseases.
Author contributions
A. Teodora Dinescu (Data curation, Formal analysis, Visualization, Writing—original draft, Writing—review and editing), Bin Zhou (Conceptualization, Data curation, Investigation, Formal analysis, Investigation, Methodology, Writing—original draft), Yizhong Jenny Hu (Data curation), Sanchita Agarwal (Conceptualization, Data curation, Investigation, Methodology, Project administration, Resources), Elizabeth Shane (Conceptualization, Funding acquisition, Resources, Project administration, Supervision), and X. Edward Guo (Conceptualization, Funding acquisition, Project administration, Resources, Software, Supervision, Writing – review and editing)
Funding
This work was supported by the National Institutes of Health R01 AR058004 grant (XEG).
Conflicts of interest
None declared.
Data availability
Data was generated and analyzed at Columbia University. Derived data is available from the corresponding author (XEG) upon request.
