


Abstract
The magnitude of bone formation and remodeling is linked to both the magnitude of strain placed on the bone and the perfusion of bone. It was previously reported that an increase in bone perfusion and bone density occurs in the femur of old rats with moderate aerobic exercise training. This study determined the acute and chronic effects of static muscle stretching on bone blood flow and remodeling. Old male Fischer 344 rats were randomized to either a naive or stretch-trained group. Static stretching of ankle flexor muscles was achieved by placement of a dorsiflexion splint on the left ankle for 30 min/d, 5d/wk for 4wk. The opposite hindlimb served as a contralateral control (nonstretched) limb. Bone blood flow was assessed during and after acute stretching in naive rats, and at rest and during exercise in stretch-trained rats. Vascular reactivity of the nutrient artery of the proximal tibia was also assessed in stretch-trained rats. MicroCT analysis was used to assess bone volume and micro-architecture of the trabecular bone of both tibias near that growth plate. In naive rats, static stretching increased blood flow to the proximal tibial metaphasis. Blood flow to the proximal tibial metaphysis during treadmill exercise was higher in the stretched limb after 4 wk of daily stretching. Daily stretching also increased tibial bone weight and increased total volume in both the proximal and distal tibial metaphyses. In the trabecular bone immediately below the proximal tibial growth plate, total volume and bone volume increased, but bone volume/total volume was unchanged and trabecular connectivity decreased. In contrast, intravascular volume increased in this region of the bone. These data suggest that blood flow to the tibia increases during bouts of static stretching of the hindlimb muscles, and that 4 wk of daily muscle stretching leads to bone remodeling and an increase in intravascular volume of the tibial bone.
Lay Summary
We tested whether daily stretching of the calf muscles altered the structure of bone and blood vessels leading to and within bone. After 4 wk of daily stretching of the calf muscles, the reactivity of the main nutrient artery leading to the tibia bone was increased, and the volume of blood vessels within the tibia bone was also increased. These increases in the blood vessel reactivity and volume were associated with greater blood flow to the tibia bone during walking exercise.
Introduction
Loss of bone mass is a major health issue associated with aging.1,2 Osteogenesis, which is critical for the maintenance of a healthy skeletal system, is coupled to angiogenic growth of blood vessels in the developing skeletal system.3 Bone is a highly vascularized tissue; the formation and maintenance of healthy bone is dependent on the bone vascular network throughout the lifespan. In contrast, declining bone blood flow to bone may be an important contributor to age-related bone loss.4 In elderly women, reduced bone mass was associated with decreased blood flow.5 Additionally, the angiogenic response during fracture healing was reduced in aged mice.6 Although these findings suggest that improvement of bone blood flow could reverse or impede age-related bone loss, therapeutic interventions designed to specifically increase blood flow to aged bone have not been heavily investigated.
Our previous work in aged rats demonstrates that moderate-intensity aerobic exercise training increases blood flow to the femur and improves endothelial function of the femoral nutrient artery, with a corresponding increase in femoral trabecular bone density.7 Although potentially effective in improving bone blood flow, aerobic exercise programs can be problematic in the elderly due to many factors such as frailty, environmental challenges, and access to equipment such as treadmills.8 Our recent work in aged rats that indicates static muscle stretching, when performed regularly for 4 wk, increases muscle blood flow during exercise, enhances endothelium-dependent vasodilation of skeletal muscle resistance arteries, and induces angiogenesis in stretched muscles.9 In addition, expression of endothelial nitric oxide synthase increased in resistance arterioles of stretched muscle and expression of vascular endothelial growth factor (VEGF) increased in stretched muscle fibers. During the development of the mammalian skeletal system, bone formation is tightly coupled to angiogenic growth of blood vessels3,10,11 and VEGF-A has been shown to be a significant regulator of blood vessel invasion, cartilage remodeling, and growth plate morphogenesis.10,12,13 Because osteogenesis is coupled to muscle strain as well as blood flow, we subsequentially investigated whether regular static muscle stretching could also affect bone blood flow and bone formation. We tested the hypothesis that muscle stretching would increase bone blood flow and bone formation and these adaptations would be localized to areas of bone near the attachments of stretched muscles. We also investigated the effects of muscle stretching on the function of nutrient arteries that enter the bone at sites near the attachment of stretched muscles.
Methods
Animals
The 20–22-mo old male Fisher 344 rats (n = 53) were obtained from the National Institute on Aging. For performance of daily stretching, rats were assigned to stretch (n = 39), naive (n = 16), or sham control (n = 8) groups. All animal procedures were approved by the Institutional Animal Care and Use Committee at the University of Florida and Florida State University and conformed to the Guide for the Care and Use of Laboratory Animals published by the National Institutes of Health (Eighth edition, 2011). Rats were housed in a temperature/light-controlled environment and given access to standard rat feed and water ad libitum.
Muscle splinting protocol
Muscle stretching was performed for 30 min, 5 d/wk for 4 wk by applying a splint to hold the ankle joint at ∼30 deg of dorsiflexion. Splints were made from Polyform as previously described.14 Muscles of the back of the lower leg: the soleus, plantaris, flexor hallucis longus, and flexor digitorum longus muscles were stretched via the splint (Figure 1). The contralateral hindlimb served as the control, nonstretched limb. For daily stretching, the rat was anesthetized briefly (<1 min) with 1.5% isoflurane, during which splint was secured to one ankle using tape. Rats were then awake but immobilized in an acrylic restrainer during the 30 min of stretching. Afterward, the splint was removed without anesthesia. Sham control rats were briefly anesthetized and immobilized in the restrainer for 30 min without a splint. Bone blood flow measurements, harvesting of bones, and vascular responses of the tibial nutrient artery were performed at least 48 h after the last bout of muscle stretching.
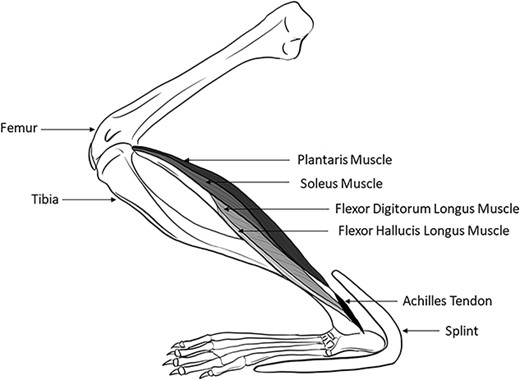
A splint that created a dorsiflexion angle of ∼30 deg was applied to one hindlimb of male Fischer 344 rats. The ankle dorsiflexion splint elongated the soleus, plantaris, flexor hallucis longus, and flexor digitorum longus.
Surgical preparation for determination of blood flow
Rats were anesthetized with 2.5% isoflurane, and a catheter filled with heparinized saline was advanced into the right carotid artery to the aortic arch. The carotid catheter was externalized at the base of the neck and secured to the skin between the shoulder blades. A second catheter, placed in the caudal tail artery and externalized at the base of the tail, was used to monitor mean arterial pressure and to obtain a reference blood sample for calculating tissue flows. After closing the incisions, the animals were given ≥4 h to recover, as previous studies demonstrated that circulatory dynamics, regional blood flow, arterial blood gases, and acid–base status are stable in the awake rat 1–6 h after gas anesthesia.15
Bone blood flow during and after acute muscle splinting
Naive rats (no daily stretching) were used to determine the effects of acute splint placement (acute stretching). Naive rats were acclimated to the splints and restrainers for 10 min/d, on 3 consecutive days. At least 48 h elapsed between the last acclimation session and blood flow assessment during/after acute splint placement (acute stretching). Catheters were implanted as described above.
At the end of the 4-h recovery period following catheter placement, rats were placed in a restrainer, and infused with radiolabeled microspheres (either 57Co or 85Sr, infused in random order) determination of resting blood flow. After measuring resting blood flow, the rats were taken out of the restrainer and briefly anesthetized with 1.5% isoflurane in order to place the splint was placed on the stretched limb, and then returned to the restrainer. Ten minutes after splint placement, the second microsphere (either 57Co or 85Sr) was infused. Following this infusion, the rat was euthanized with pentobarbital sodium (>100 mg/kg intraperitoneally).
Bone blood flow at rest and during treadmill exercise
Prior to blood flow evaluations, rats were familiarized with treadmill exercise during 3 sessions of walking (10 min/d at 15 m/min, 0° incline). On the day of blood flow evaluations, catheters were implanted as previously described. At the end of the 4-h recovery period following catheter placement, rats were placed on the treadmill and exercise was initiated (15 m/min at a 0° incline). After 3 min of total exercise time, blood was withdrawn from the caudal tail artery at 0.25 mL/min. Radiolabeled microspheres were then infused into the carotid artery catheter (infused in random order of either 57Co or 85Sr); 15 μm diameter; ∼2.5 × 10⁵ in number), as previously described.15–18 Blood withdrawal from the caudal tail artery continued for 45 s after microsphere infusion was complete. After a 30-min recovery period from exercise, infusion of the second microsphere (either 57Co or 85Sr) was performed to measure resting blood flow. After the second microsphere infusion, rats were euthanized with pentobarbital sodium (>100 mg/kg intraperitoneally).
Blood flow analysis
After euthanasia, the hindlimb muscles, foot, and both lower leg bones were dissected. Blood flow to the proximal metaphysis, distal metaphysis, and diaphysis of the tibia was determined by sectioning each part of the bone with a Dremel tool. The marrow from the diaphysis was removed and counted as a fourth region. Blood flow to the entire foot was also determined. The radioactivity level of each bone section was determined by a gamma scintillation counter. Blood withdrawals from the caudal tail artery were utilized as reference samples. Blood flow to each bone section was calculated by reference sample method and expressed in milliliters per minute per 100 g of tissue according to the following formula:
Kidney blood flows were used as an indicator of adequate mixing of microspheres; blood flow values were only considered valid if left and right kidney flows were within 15% of each other.17
Micro-CT scanning
Rats (n = 8–9) were weighed and anesthetized with 2.5% isoflurane-O2 balance and euthanized by excision of the heart. The tibia from both legs of the rats were removed, weighed, and stored in a solution of 2% paraformaldehyde until used. Tibial bone trabeculae were imaged using a high-resolution (6um voxel size) micro-CT imaging system (uCT35, Scanco Medical; Basserdorf Switzerland) with a voltage of 55 kV and a current 145 uA, allowing for a 2048 × 2048 pixel image matrix. The integration time was set to 200 ms. Noise was eliminated using a low-pass Gaussian filter (sigma = 2.2, support = 2). A lower threshold of 184 was used to binarize 3-D images of the trabecular network separated from the surrounding tissues. The region of interest, in both the proximal and distal metaphyses, was defined as the first 50 slices located 1 mm below the growth place of the rat tibia. Total bone volume and bone volume were assessed for the entire bone cross-section below the growth plate. Scans from the 50 slices were analyzed to determine total volume, bone volume, and bone volume/total volume for the entire cross-section of bone and for the area defined as trabecular bone. To assess trabecular bone, contour lines were drawn to exclude the cortical shell of the bone. Total volume and bone volume for cortical bone were equal to the values for the entire bone cross-section minus the total volume and bone volume for trabecular bone. Trabecular connectivity, trabecular thickness, trabecular number, and trabecular spacing were assessed only within the region defined as trabecular bone by contour lines.
Isolated tibial nutrient artery preparation
Rats (n = 13) were weighed and anesthetized with 3% isoflurane and euthanized by excision of the heart. The lower limb was removed at the hip joint from both the stretched and non-stretched contralateral hindlimb. The skin and foot were removed, and the limb was placed in cold (4°C) filtered physiological saline solution (PSS). The distal portion of the tibial nutrient artery, as it enters the nutrient foramen, was carefully dissected and cannulated on pipettes and pressurized to 90 cmH2O in an organ chamber that contained warm (37°C) PSS. The chamber was then placed on an inverted microscope equipped with a video camera and micrometer to measure intraluminal diameter. Vessels determined to be leak-free were equilibrated for ~1 h.
Evaluation of vasoconstrictor responsiveness
Vasoconstrictor constrictor responses to cumulative addition of the α-adrenergic agonist, phenylephrine, (PE, 1e−9 - 1e−4 M), to the vessel bath were assessed as previously described.19 Vasoconstrictor responses to PE were expressed as percent constriction according to the following formula:
Evaluation of Vasodilatory responsiveness
Vasodilatory responses to cumulative addition of the endothelium-dependent vasodilator, acetylcholine (ACh, 1e−9 - 1e−4 M), and the nitric oxide (NO) donor diethylamineNONOate (Dea-NONOate, 1e−9 - 1e−4 M), were also determined in tibial nutrient arteries as previously described.20 Vasodilatory responses were expressed as percent relaxation as calculated by the following formula:
where Db is the steady baseline diameter before adding the first dose of the specific vasodilators, Ds is the steady diameter after the addition of each dose of the vasodilators, and Dmax is the maximal inner diameter recorded under Ca2+-free conditions.
Bone decalcification and freezing
Both tibias (n = 5 rats) were fixed in 4% PFA for 24 h and then decalcified using a 14% ethylenedinitrilotetraacetic acid disodium salt dihydrate (EDTA) solution. The EDTA solution was changed every 2 d for 2 wk and the pH was balanced to 7.00–7.40 using sodium hydroxide and hydrochloric acid as needed. Tibias were cut in half (transverse plane) at the 2-wk mark to separate the distal and proximal ends.
The proximal tibias were placed in 30% sucrose/phosphate buffered saline (PBS) solution for 48 h at 4°C, and then transferred to 50% OCT/ (30% sucrose/PBS) solution for 24 h at 4°C. The proximal tibias were then frozen in OCT molds with liquid nitrogen and stored at −20°C until sectioning.21
Vascular staining and imaging
13 μm longitudinal sections were cut from the proximal metaphysis of the tibias from both stretched and nonstretched limbs beginning ∼650 μm from the lateral surface. To identify the vascular endothelium, sections were washed with PBS, and incubated with rhodamine-labeled Griffonia Simplicifolia lectin I (15 μg/mL diluted with PBS, VECTOR LABORATORIES) for 30 min at room temperature in the dark.9,22 Sections were visualized with a fluorescence microscope and images were captured with a digital CCD camera (6.3X magnification). To confirm that lectin was binding specifically to the endothelium, staining was also performed using a primary anti-VEGFR2 (vascular endothelial growth factor receptor 2) and a secondary FITC-labeled anti-IgG. DAPI staining was added to visualize nuclei throughout the tibial sections.
Analysis of vascular volume
Colocalization of lectin and VEGFR2 staining was assessed with a custom software developed with Python version 3.8.8. Colocalization between pairs of input images was determined via a normalized and rescaled sum of the image pair’s Mean Squared Error (MSE), Structural Similarity Index Measure (SSIM), and Oriented FAST Rotated Brief (ORB) score. To compute the MSE between input images, both images were resized to a standardized dimension in pixels and the pixel data from each image was converted from unsigned 8-bit integer to floating-point value. The differences in pixel intensities at each location or index within the images were squared and summed. The squared sum of the differences in pixel intensities for the image pair were divided by the total number of pixels in the image to yield MSE as follows:
To account for MSE’s inability to account for large distances between pixel intensities in the computation of colocalization, 2 additional algorithms were implemented to quantify morphological and structural changes of feature points in parallel. The SSIM23 determines similarity or colocalization between images by comparing local patterns of pixel intensities that have been normalized for luminescence and contrast. SSIM was calculated as follows:
The ORB algorithm works in 3 distinct phases: feature point extraction, create feature point descriptions, and feature point matching. The first phase of the ORB algorithm detects feature points by employing an improved version of the FAST (features from accelerated segment test) algorithm. If the pixel is significantly different from the neighborhood pixels, then select all pixels within a pre-determined radial distance outward from the detected landmark location. The ORB score is calculated by summing the gray-value differences between pixels in the detected circular region and the nearest matched feature point’s equally sized circular region. The final ORB score is the Hamming distance between each matched feature point.
Colocalization of luminescence and contrast, as well as structural similarity between input images, was proven to be the highest in Lectin and VEGFR2 stained images and the agreement in colocalization was further validated by high ORB and SSIM scores coupled with significantly lower MSE scores for all sets of images. Our Microscopy Image Similarity Analysis Program automatically determines the similarity between 2 images as a function of pixel structure, intensity, and a locality-sensitive hashing optimization of clustered features which combines, on a local scale and between features, the 2 former measures. Images with minimal MSE, the greatest SSIM, and the highest ORB score were between VEGFR2 and lectin and both stains varied significantly from the areas stained by DAPI. An isolated ORB analysis determined that the similarity between fluorescence generated with lectin staining and DAPI staining (Figure 2A, B, and D) was low compared with the similarity between fluorescence generated with lectin staining and VEGFR2 lectin staining (Figure 2A, C, and E). Composite images were created in ImageJ by overlaying them on top of each other to visually demonstrate the similarity between fluorescence generated with lectin staining and VEGFR2 staining (Figure 2E) and between lectin, DAPI, and VEGFR2 (Figure 2F).
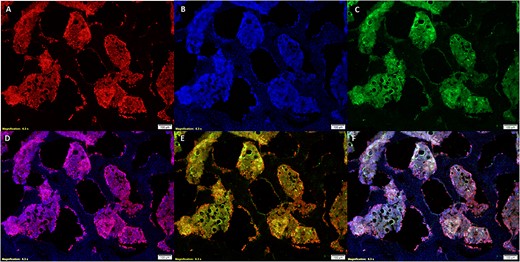
Staining with lectin (A), DAPI (B), and VEGFR2 (C) ensured there was sufficient similarity between lectin and VEGFR2 yet enough selectivity to differentiate between DAPI and lectin-stained tissue. The lectin and DAPI composite (D) demonstrates that lectin has specificity to vascular tissue and the lectin and VEGFR2 composite (E) demonstrates specificity of lectin binding to tissue expressing the VEGF2 receptor. Overlays of staining in images (A–C) are depicted in image (F).
A Morphological Data Extraction Program was developed with Python version 3.8.8 to objectively and automatically calculate vascular tissue volume occupied in each imaged proximal tibial metaphysis cross-section. Microscopy images of the bone cross sections were segmented into color-organized components with automatic OTSU thresholding. The segmented components were automatically assigned a label and morphological data was extracted for each component. Each segmented component was enclosed by a rectangle with the lowest possible area (Supplementary Figure 1). The area of vascular tissue in each rectangle was calculated in pixels2 and was converted to SI units using ImageJ to convert the length, in pixels, of a 180°-line segment drawn over a true microscopy scalebar to a corresponding value in μm. The rectangular areas were summed to find the total vascular area in each image and then this area was multiplied by the average slice thickness (13 μm) to determine the vascular volume of each cross-section. The average vascular volume from all slices was determined for the stretched and nonstretched tibia in each rat.
Statistical analysis
Differences in bone mass, blood flow, bone vascular volume, bone volume, and trabecular connectivity between stretched and nonstretched limbs were assessed by paired t-tests (SPSS). Responses of the tibial nutrient arteries to PE and ACh were evaluated using 2-way analysis of variance with SPSS (stretch and dose/time) with repeated measures (dose/time). Statistical significance was defined as P ≤ .05. In all data, n represents the number of animals. Data are shown as means ± standard error.
Results
Body weights and tibia weights did not differ between naive rats and rats that underwent sham stretching.9 Tibia weights from the stretched limbs were significantly higher than those from the nonstretched limbs (841 ± 15 mg vs 815 ± 18 mg; stretched vs non-stretched, P < .001). Tibia weight/body weight was also higher for the stretched limbs as compared with the nonstretched limbs (2.08 ± 0.05 mg/g vs 2.14 ± 0.04 mg/g; stretched vs non-stretched, P < .001). Blood pressure was not altered during acute muscle stretching as compared with blood pressure at rest. Body weight and blood pressure were not different in sham control rats when compared with rats in which one leg had undergone daily stretching.
Tibial and Hindfoot blood flow
During acute stretch, blood flow to the proximal metaphysis of the tibia was higher in the stretched limb than in the nonstretched limb (n = 7; Figure 3A). After daily application of acute stretch for 4 wk, blood flow to the proximal metaphysis of the tibia was higher in the stretched as compared with the nonstretched contralateral limb during treadmill exercise (n = 11; Figure 3B). In contrast, but similar to our previous findings in muscle,9 during acute stretch, blood flow to the hindfoot was lower in the stretched as compared with the nonstretched contralateral limb (n = 7; Figure 4A). Consistent with the notion of induction of ischemia during acute stretch (4A), release of acute stretch (within 30 s of stretch release) resulted in a reactive hyperemic response that was greater in the hindfoot in the stretched limb as compared with the nonstretched contralateral limb (n = 8; Figure 4B). After 4 wk of daily acute stretching and related stretch-induced ischemia, blood flow to the hindfoot during treadmill exercise was higher in the stretched limb as compared with the contralateral nonstretched limb (n = 10; Figure 4C). After 4 wk of muscle stretching, resting blood flow to the tibia and hindfoot was not different between the stretched and nonstretched contralateral limb (data not shown). In the distal metaphysis and diaphysis of the tibia, resting blood flow and exercise-induced blood flow were not different between the stretched and nonstretched contralateral limb after 4 wk of daily stretching (data not shown).
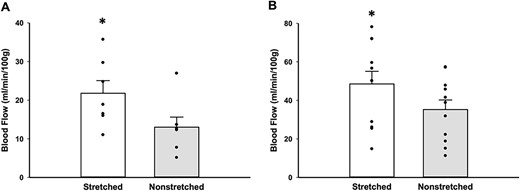
Blood flow to the proximal tibial metaphysis was measured in both stretched and nonstretched limbs during acute stretch (A) and during treadmill exercise (B) after undergoing 4 wk of daily stretching. During acute stretch, blood flow in the tibial metaphysis of the stretched limb was higher than in the tibial metaphysis of the contralateral non-stretched limb (n = 7; 21.79 ± 3.28 vs 13.01 ± 2.60 mL/min/100 g; *P < .05 stretched vs nonstretched). After 4 wk of daily stretching, blood flow in the tibial metaphysis of the stretched limb was higher than in the tibial metaphysis of the contralateral non-stretched limb during treadmill exercise (n = 11; 48.51 ± 6.55 vs 35.22 ± 4.97 mL/min/100 g; *P < .01 stretched vs nonstretched).

Blood flow to the hindfoot was measured in both stretched and nonstretched limbs during acute stretch (A), immediately upon release of acute stretch (hyperemia) (B), and during treadmill exercise (C) after undergoing 4 wk of daily stretching. Blood flow to the hindfoot was reduced during acute stretch (n = 7; 8.68 ± 1.83 vs 19.71 ± 1.83 mL/min/100 g; *P < .05 stretched vs nonstretched). After 4 wk of daily stretching, blood flow to the hindfoot of the stretched limb was higher during treadmill exercise (n = 10; 22.75 ± 4.09 vs 12.76 ± 2.41 mL/min/100 g; *P < .05 stretched vs nonstretched). The increase in blood flow that occurred immediately upon release of stretch was higher in the hindfoot of the stretched limb (n = 8; 20.03 ± 4.22 vs 13.41 ± 2.28 mL/min/100 g; *P < .05 stretched vs nonstretched).
Tibial vascular volume
Because blood flow to the proximal metaphysis of the tibia was elevated in the stretched limb during exercise, we estimated the vascular volume of this region of the bone using lectin staining of the endothelium. Co-localization of lectin and VEGFR2 staining was performed to demonstrate the specificity of endothelial staining (Figure 2A, C, and E) with lectin. Series of lectin images (13 μm thickness) were then used to calculate vascular volume in the proximal metaphysis of the tibias from the stretched and contralateral nonstretched limbs. After 4 wk of daily stretching, on average there was 67% more vascular tissue (n = 5; Figure 5G) in the proximal metaphysis of the tibia from the stretched limb (Figure 5A) as compared with that of the non-stretched limb (Figure 5D).
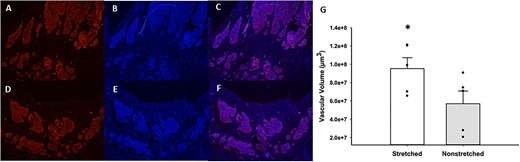
Representative images of lectin staining of sections near the growth plate of the proximal tibial metaphysis from stretched vs non-stretched limbs. The top row contains a section stained with lectin (A), DAPI (B), and lectin/DAPI overlay (C) from a stretched tibia. The bottom depicts the same staining; lectin (D), DAPI (E), and lectin/DAPI overlay (F), from a nonstretched tibia. Panel (G) illustrates the difference in vascular tissue in the proximal tibial metaphysis of stretched and nonstretched hindlimbs (n = 5 rats). Vascular volume was averaged from 14–20 sections per rat. Average vascular volume in stretched limbs was 9.53 × 107 μm3 and in nonstretched limbs was 5.701 × 107 μm3 (*P < .01 stretched vs nonstretched).
Tibial bone volume
After 4 wk of stretching, total volume in the proximal metaphysis of the tibia was higher in the stretched limb as compared with the contralateral nonstretched limb (n = 9; 6.92 ± 0.18 vs 6.18 ± 0.25 mm3; *P < .05, stretched vs nonstretched; Figure 6A); however, bone volume was similar in stretched limb and the contralateral nonstretched limb (n = 9; P = .18, stretched vs nonstretched; Figure 6B). Bone volume/total volume was lower in the stretched limb as compared with the contralateral nonstretched limb, but this decrease did not reach statistical significance (n = 9; P = .23, stretched vs nonstretched; Figure 6C). Trabecular connectivity was lower in stretched limb as compared with the contralateral nonstretched limb (Figure 6D). We estimated cortical bone from microCT analysis of the tibial proximal metaphysis below the growth plate and did not find differences in total volume (n = 9; 2.70 ± 0.76 vs 2.62 ± 0.62 mm3; P = .70, stretched vs nonstretched). Similarly, no differences in bone volume (n = 9; 1.94 ± 0.34 vs 2.05 ± 0..67 mm3; P = .62, stretched vs nonstretched) of cortical bone of the tibial proximal metaphysis below the growth plate were detected between the stretched limb and the contralateral nonstretched limb. These results suggest that the increased volume in the proximal metaphysis of the tibia, induced by 4 wk of daily stretching, occurs due to an increase in vascular tissue rather than an increase in osseous tissue. In contrast, after 4 wk of stretching, total volume and bone volume were higher in the distal metaphysis of the tibia in the stretched limb as compared with the contralateral nonstretched limb (n = 8–9 Figure 7A and B). Bone volume/total volume was similar in stretched limb and the contralateral nonstretched limb (n = 8; Figure 7C). Because blood flow was unchanged in the distal metaphysis of the tibia in the stretched limb (as compared with the nonstretched limb), we did not evaluate vascular volume in the distal metaphysis of the tibia; however, these data suggest that the increase in total volume of the distal metaphysis occurs due to an increase in osseous tissue rather than an increase in vascular tissue. It is also possible that the greater osseous response at the distal tibia may be partially explained by a difference in the strain environment in the distal tibia relative to the proximal tibia.
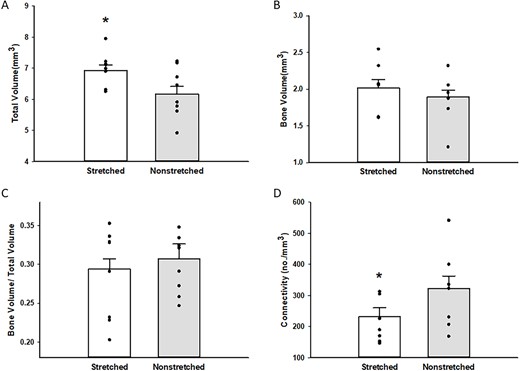
Total volume (A), bone volume (B), bone volume/total volume (C), and trabecular connectivity (D) in the proximal tibia of stretched and nonstretched hindlimbs. Total volume (A) was higher in the proximal tibia from stretched hindlimbs (n = 9; 6.92 ± 0.18 vs 6.18 ± 0.25 mm3; *P < .05 stretched vs nonstretched). Bone volume (B) was not different in the proximal tibia of stretched and nonstretched limbs (n = 9, 2.02 ± 0.11 vs 1.89 ± 0.10 mm3). Bone volume/total volume (C) was not different in the proximal tibia of stretched and nonstretched limbs (n = 9; 0.294 ± 0.013 vs 0.307 ± 0.0193; *P < .05 stretched vs nonstretched) as was trabecular connectivity (n = 8; 232.19 ± 28.46 vs nonstretched 322.94 ± 39.97, *P < .05 stretched vs nonstretched).
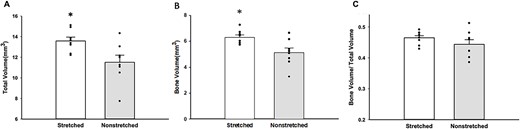
The total volume (A), bone volume (B), and bone volume/total volume (C) were measured at the distal tibia in stretched and nonstretched hindlimbs. Total volume (A) (n = 9; 13.74 ± 0.36 mm3 vs 11.63 ± 0.62 mm3; *P < .01 stretched vs nonstretched) and bone volume (B) (n = 8; 6.31 mm3 ± 0.18 vs 5.11 ± 0.37 mm3; *P < .01 stretched vs nonstretched) increased significantly in stretched limbs, whereas bone/total volume remained relatively unchanged (n = 8; 0.29 ± 0.02 vs x-=0.44 ± 0.01; stretched vs nonstretched).
Vascular function of the Tibial nutrient artery
The increase in blood flow that occurred in the proximal metaphysis of the tibia during acute stretch suggests that stretching of the muscles with origins at the proximal tibia/fibula stimulates vasodilation of the resistance arteries that supply blood to the bone. Blood vessels undergo rapid adaptation when mechanically stimulated by pressure, stretch, or shear stress24: therefore, we evaluated the vasodilatory and vasoconstrictor responses of the nutrient artery that enters the proximal metaphysis of the tibia after 4 wk of daily stretching. Endothelium-dependent vasodilation to ACh was significantly higher in the tibial nutrient artery of the stretched limb as compared with the nonstretched limb (n = 13; Figure 8A). Vasoconstrictor responses to PE were also increased in the tibial nutrient artery of the stretched limb as compared with the nonstretched limb (n = 13; Figure 8B). Endothelium-independent vasodilation to the NO donor, Dea-NONOate, was not changed in the stretched limb as compared with the non-stretched limb (n = 10; P = .21, stretched vs nonstretched).
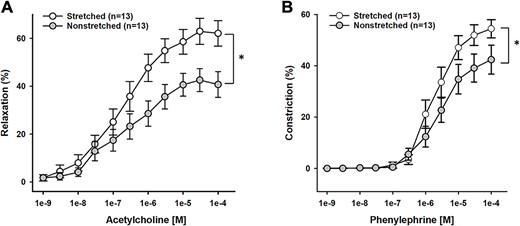
Reactivity of the tibial nutrient artery (TNA) stretched and nonstretched hindlimbs (n = 13) to acetylcholine (A) and phenylephrine (B). Endothelium-mediated dilation to acetylcholine was greater in TNA of stretched limbs as compared with TNA from nonstretched limbs (*P < .01). Phenylephrine-induced constriction was greater in TNA from stretched limbs as compared with TNA from nonstretched limbs (*P < .05).
Discussion
The main finding of this study is that 4 wk of daily stretching of the calf muscles in aged rats increases blood flow to the proximal tibia during exercise. Additionally, 4 wk of daily stretching increased vascular volume of the proximal tibia and increased reactivity of the tibial nutrient artery. Furthermore, we report here that blood flow to the proximal tibia increased during acute stretching bouts. All together, these results suggest that 4 wk of daily stretching, with the concomitant increase in blood flow that occurs during each daily stretching bout, leads to improved bone perfusion during exercise. These results suggest that muscular stretching could be used to improve bone vascularity and for the maintenance of healthy bone throughout the lifespan.
Bones change with advancing age; age-related changes in bone are evident in whole bone morphology and in the microarchitecture of bone.1,25 Similarly, although the bone vasculature changes with age, modeling and remodeling of bone is linked to the bone microcirculation across the lifespan.6,17 Although skeletal blood flow declines with age,4 our current data indicate that 4 wk of muscular stretching stimulates an increase in the vascular volume of the tibia of aged rats (Figure 5). We used lectin staining to show that the vascular volume increased in the tibia of the stretched limb, and we validated the specificity of our lectin staining by performing parallel staining with VEGFR2. VEGF signaling plays a key role in regulating the angiogenic process26,27 and its coupling to osteogenesis.13,28–31 Although distinct subtypes of capillaries and endothelial cells have been identified in bone,32 all are associated with VEGF signaling. Our staining likely identified capillary subtypes, including type H and type L capillaries, sinusoids, and areas of marrow since blood cells and immune cells express surface receptors that are capable of binding lectins.32,33 However, we also identified areas within the tibial metaphysis that stained with DAPI, but not lectin, indicating that lectin staining was not non-specific for all cell types within the bone (Figure 2). Further studies will be needed to determine the precise cellular makeup of the tissues that were stained by lectin; however, all the lectin-positive tissue is likely to be involved in the angiogenic response induced by stretching.
Using radioactive microspheres, we measured blood flow to the tibia during acute stretch in conscious rats, and found that blood flow to the proximal tibial metaphysis was increased significantly in the stretched limb as compared with the non-stretched limb. The microspheres were infused in the aortic arch, and since adequate mixing of the microspheres was verified by similar flows in the right and left kidneys, we could conclude that the increase in blood flow to the stretched tibial metaphysis was related to a local change in vascular resistance induced during stretch. Localized hyperemia, induced during acute stretching, potentially underlies the vasculogenesis that occurs over 4 wk of daily stretching. Ramasamy et al. examined the mechanism by which blood flow effects angiogenesis and osteogenesis within long bones.33 These investigators reported a vascular pattern in which arterial blood enters the long bone at the metaphyses as well as at the inner surface of compact bone, and flows through type H capillaries (previously shown to couple angiogenesis and osteogenesis at the growth plate29,31) into a highly branched sinusoidal vasculature that drains by a vein in the center of the diaphysis. Imaging of the region next to the growth plate showed type H capillaries interconnected with loop-like arches connected to bud-shaped protrusions with filipodia that connected to the surrounding chondrocyte matrix. The bud-shaped structures expressed mechanosensitive receptors, Pecam/CD31, and the Notch receptor, Dll4. In addition to demonstrating an increase in blood flow to the proximal tibial metaphysis, we have now shown that 4 wk of muscular stretching increases endothelium-dependent dilation of the tibial nutrient artery that directly feeds into the proximal tibial metaphysis. This finding suggests that stretching of the limb induces vasodilation of the tibial nutrient artery, contributing to the increase in blood flow during stretching, and increased blood flow to the proximal tibial metaphysis measured during exercise in the stretched limb.
In previous work, we reported that endurance training for 10–12 wk enhanced endothelium-dependent vasodilation of the femoral nutrient artery and increased trabecular bone volume in the femur of aged rats.7 During treadmill exercise, blood flow to the proximal metaphysis of the femur increased by ∼30% (from resting), and we reasoned that adaptations of the bone and bone vasculature were driven, at least in part, by the increased blood flow that occurred during daily bouts of treadmill exercise over 10 wk. Here, we report that during an acute bout of muscle stretching, blood flow to the proximal metaphysis of the tibia increased by ∼27%. Thus, the blood flow response to treadmill exercise and stretching appears similar in the proximal metaphysis of the femur and tibia. As in previous work, we report here an increase in endothelium-dependent vasodilation of the tibial nutrient artery after 4 wk of daily stretch training. In contrast, we did not find an increase in bone volume after 4 wk of stretching. Considered together, these data suggest that although muscular stretching increased blood flow to bone, other mechanisms must also contribute to treadmill training-induced adaptation of bone. In particular, treadmill training creates ground reaction forces against gravity that would not occur with stretch training, and these might be a stimulus for bone formation in addition to increased blood flow. Additionally, another study reports that men who participated in exercise programs ranging from 3 mo to 4 y, with an average of 13 mo, showed improved bone mineral densities.34 Although we did not find an increase in bone volume, we do report here that 4 wk of daily stretching increased vascular volume within trabecular bone. The increase in vascular volume that occurred in response to 4 wk of stretching may precede an increase in bone volume, and a longer period of muscular stretch training could result in an increase in bone volume.
In skeletal muscle, there is evidence that stretching, with associated lengthening of sarcomeres, induces angiogenesis.35–37 We have previously reported that daily stretching increased endothelium-dependent dilation of resistance arterioles and induced angiogenesis in the soleus muscle of aged rats, contributing to increased blood flow to the soleus muscle during treadmill exercise.9 In contrast to the increase in blood flow that occurred in the tibia during acute stretching, blood flow was reduced by ∼40% in muscles (soleus, plantaris, flexor digitorum longus, and flexor hallucis longus) that experienced acute stretch during ankle dorsiflexion. Thus, blood flow was acutely decreased when muscles were elongated. Kindig and Poole 38 reported that red blood cell velocity and flux decrease in capillaries as muscle sarcomere length increases. Reduction of capillary blood flow in stretched muscle likely results from narrowing of capillary diameter.38–40 Using near-infrared spectroscopy, Kruse et al. 41,42 found an increase in deoxygenated hemoglobin in stretched human muscle. We now report that blood flow to the hindfoot was also reduced during acute muscle stretching, and that daily muscle stretching for 4 wk increased blood flow to the hindfoot during treadmill exercise. Although we have not assessed capillarity or protein expression in the hindfoot, our results suggest that the ischemia induced during daily stretching bouts stimulates adaptations of the microvasculature in the hindfoot, leading to increased blood flow during exercise.
In our previous study of aged rats, daily stretching increased protein levels of hypoxia inducible factor-1α (HIF-1α) in the soleus muscle.9 Milkiewicz et al.43 reported that prolonged stretch of skeletal muscle increased HIF-1α and HIF-2α protein in capillaries. In osteoblasts, mechanical stress has been reported to promote expression of HIF-1α though activation of mitogen-activated protein kinase signaling 23. Additionally, in bone, endothelium-mediated activation of HIF-1α signaling promotes angiogenesis and related osteogenesis.29 We also found that 4 wk of daily stretching increased expression of VEGF-A in soleus muscle.9 An intimate connection has been reported between angiogenesis and osteogenesis in a number of studies,11,12,29,44 both during bone development11,29–31 and during fracture repair,11,45 and increased expression/stabilization of HIF-1α,46 VEGF,30 and notch signaling31 have been demonstrated to contribute to angiogenesis and connected osteogenesis in modeling and remodeling of bone. Further work will be needed to determine whether the increase in vascular volume within the stretched tibia is linked to increased expression of HIF-1α, VEGF or notch ligands.
In addition to reporting stretch-induced angiogenesis, we also found previously that daily stretching induced hypertrophy of the soleus and plantaris muscles.9 Although we have not evaluated the effects of stretching on contractile strength of the soleus or plantaris, it seems likely the reported hypertrophy is linked to greater muscular strength. Related cross-talk between stronger muscles and bone, both due to exercise-induced forces and due to anabolic effects, could also contribute, indirectly, to the adaptations in bone reported here. Future work would be needed to establish if stretching of muscle also induces bone adaptation through increased muscular contractions and heightened bone metabolism.
Limitations
We studied the effects of muscular stretch training only in old rats. We do not know if this stretching intervention would produce similar changes in the vasculature of bone in young rats. It is possible that the effects of muscular stretching would only produce a significant change in bone vasculature that has already been compromised by old age. Alternatively, it is possible that the vasculature of young, healthy bone would demonstrate a robust adaptation to daily stretching. Similarly, we studied only male rats. Estrogen is an important regulator of bone metabolism.47 Estrogen enhances endothelium-dependent vasodilation in blood vessels supplying bone48 and ovariectomy induces a reduction of type H capillaries within bone49 . The effects of muscular stretching may differ in aged female rats in which circulating estrogen is reduced. Alternatively, muscular stretching could provide a compensatory means of increasing blood flow to bone in aged females with low estrogen and related endothelial dysfunction in bone nutrient arteries. Future work should include investigation of female rats.
We also did not consider that stretching may alter the material properties of bone. Material properties, in addition to bone volume and size, contribute to bone strength, and we did not examine these important parameters. Future studies of bone histology and/or mechanical testing of bone may reveal that daily stretching of muscles also alters the mechanical properties of bone, leading to improved bone strength in old bones.
Conclusion
We report here that acute stretching of the calf muscles increased blood flow to the tibial metaphysis in old rats. This acute increase in blood flow to the tibia, when induced by daily stretching, may induce angiogenesis within the bone, since 4 wk of daily stretching resulted in an increase in vascular volume within the tibial metaphysis and an increase in blood flow to the tibial metaphysis during treadmill exercise. In addition, 4 wk of stretching increased endothelium-dependent vasodilation of the tibial nutrient artery, which may contribute to the increase in tibial blood flow during exercise. Altogether, these findings suggest that muscular stretching could be used to improve bone perfusion and promote bone health in advanced age.
Acknowledgments
The authors acknowledge Josh Kukus from the Florida State University College of Health and Human Sciences for technical support.
Author contributions
Julia Eazer (Investigation, Writing—original draft, Methodology, Validation, Visualization, Writing—review & editing, Formal analysis, Data curation), Mina Barsoum (Investigation, Methodology, Formal analysis, Data curation, Writing—review & editing), Cole Smith (Investigation, Data curation, Formal analysis, Methodology, Validation, Writing—review & editing), Kazuki Hotta (Conceptualization, Investigation, Writing—review & editing, Methodology, Formal analysis, Data curation), Brad Behnke (Investigation, Conceptualization, Writing—review & editing, Data curation, Resources), Christina Holmes (Investigation, Writing—review & editing, Methodology, Validation), Jacob Caldwell (Investigation, Data curation, Supervision), Payal Ghosh (Investigation, Methodology, Writing—review & editing), Emily Reid-Foley (Investigation, Writing—review & editing, Data curation), Hyerim Park (Investigation, Methodology, Formal analysis), and Michael Delp (Resources, Writing—review & editing), Judy Muller-Delp (Conceptualization, Investigation, Funding acquisition, Writing—original draft, Methodology, Writing—review & editing, Formal analysis, Project administration, Data curation, Supervision, Resources). Substantial contributions to study conception and design: K.H., B.B., C.H., and J.M.D. Substantial contributions to the acquisition of data: J.E., M.B., K.H., B.B., C.H., J.C., P.G., E.R.F., H.P., and J.M.D. Sub-stantial contributions to analysis and interpretation of data: J.E., M.B., C.S., K.H., H.P., M.D., and J.M.D. Drafting the article or revising it critically for important intellectual content: J.E.,M.B.,C.S.,K.H.,C.H., P.G., M.D., and J.M.D. Final approval of the version of the article to be published: J.E., M.B., C.S., K.H., B.B., C.H., J.C., P.G., E.R.F., H.P., M.D., and J.M.D.
Funding
This study was funded by grants from the National Institute of Health (R21AG044858 and R15AG055029).
Conflicts of interest
None declared.
Data availability
The data that support the findings of this study are available from the corresponding author, JMD, upon request.
