


Abstract
Osteoporosis, characterized by low BMD, is a highly heritable metabolic bone disorder. Although single nucleotide variations (SNVs) have been extensively studied, they explain only a fraction of BMD heritability. Although genomic structural variations (SVs) are large-scale genomic alterations that contribute to genetic diversity in shaping phenotypic variations, the role of SVs in osteoporosis susceptibility remains poorly understood. This study aims to identify and prioritize genes that harbor BMD-related SVs. We performed whole genome sequencing on 4982 subjects from the Louisiana Osteoporosis Study. To obtain high-confidence SVs, the detection of SVs was performed using an ensemble approach. The SVs were tested for association with BMD variation at the hip (HIP), femoral neck (FNK), and lumbar spine (SPN), respectively. Additionally, we conducted co-occurrence analysis using multi-omics approaches to prioritize the identified genes based on their functional importance. Stratification was employed to explore the sex- and ethnicity-specific effects. We identified significant SV-BMD associations: 125 for FNK-BMD, 99 for SPN-BMD, and 83 for HIP-BMD. We observed SVs that were commonly associated with both FNK and HIP BMDs in our combined and stratified analyses. These SVs explain 13.3% to 19.1% of BMD variation. Novel bone-related genes emerged, including LINC02370, ZNF family genes, and ZDHHC family genes. Additionally, FMN2, carrying BMD-related deletions, showed associations with FNK or HIP BMDs, with sex-specific effects. The co-occurrence analysis prioritized an RNA gene LINC00494 and ZNF family genes positively associated with BMDs at different skeletal sites. Two potential causal genes, IBSP and SPP1, for osteoporosis were also identified. Our study uncovers new insights into genetic factors influencing BMD through SV analysis. We highlight BMD-related SVs, revealing a mix of shared and specific genetic influences across skeletal sites and gender or ethnicity. These findings suggest potential roles in osteoporosis pathophysiology, opening avenues for further research and therapeutic targets.
Introduction
Osteoporosis, characterized by low BMD and deteriorated bone microarchitecture, is an age-related metabolic bone disease associated with an increased vulnerability to low-impact fractures. BMD is affected by a combination of lifestyle factors, including exercise, nutrition, and the aging process, along with genetic factors. These genetic factors are estimated to contribute to 50%–80% of the overall phenotypic variation in BMD.1 However, genetic studies of osteoporosis have been extensively focused on single nucleotide variants (SNVs)2,3 and have shown that only 1.9% to 20% of the explained variance can be attributed to SNVs in various bone sites.4
Genomic structural variants (SVs), defined as genetic variants exceeding 50 base pairs (bp) in length, have emerged as significant sources of diversity across various species. The SVs, such as deletions, duplications, insertions, inversions, etc., often play pivotal roles in shaping phenotypic variations, driving evolutionary processes, or contributing to the development of heritable complex diseases.5 Numerous pieces of evidence have shed more light on the significance of SVs on the genetic basis of osteoporosis, particularly through studies on small SVs, such as copy number variations.6 For example, Hirsch et al.7 recently demonstrated that large SVs residing in regulatory regions, such as enhancers and promoters, as well as long non-coding RNAs, can modulate the expression of osteoporosis-related genes. Partial deletions in the HDAC9 gene were found to contribute to the transcriptional regulation of the neighboring craniofacial gene TWIST1 and induced a smaller skull size in their mouse model.7 Despite these discoveries, the full spectrum of SVs capable of influencing BMD has not been well investigated.
This study aimed to comprehensively identify SVs associated with BMD and investigate their concordance with prior genome-wide association studies (GWASs), transcriptome-wide association studies (TWAS), and epigenome findings in the context of bone-related traits. The discovery of SVs associated with BMD may illuminate the mechanisms governing BMD regulation and susceptibility to bone-related conditions and unveil new therapeutic targets for osteoporosis.
Materials and methods
Study samples
All the study subjects were from the ongoing Louisiana Osteoporosis Study (LOS), which aims to build a large sample pool and database (>18 000 subjects of various ethnicities accumulated so far since 2011) for investigating genetic and nongenetic determinants of osteoporosis and other musculoskeletal diseases in Southern Louisiana.8 The inclusion and exclusion criteria have been described in our previous studies.8 We used sex and ethnicity stratified random sampling to select 4982 unrelated subjects (2875 white and 2107 African American) from the entire LOS cohort. We excluded individuals with the following preexisting conditions that may influence bone mass variation: (1) serious residual effects from cerebral vascular disease, (2) diabetes mellitus, except for easily controlled, non-insulin-dependent cases, (3) chronic renal failure, (4) chronic liver failure, (5) chronic lung disease, (6) alcohol abuse, (7) corticosteroid or anticonvulsant therapy for >6 months duration, (8) evidence of other metabolic (e.g. hyperthyroidism) or inherited bone disease, (9) rheumatoid arthritis, except for minor cases that involve only hand joint and wrist, (10) collagen disorders, and (11) chronic gastrointestinal diseases. All participants signed an informed-consent document before any data collection, and the study was approved by the Tulane University Institutional Review Board and was in accordance with the principles of the Helsinki Declaration.
Clinical measurements
A comprehensive questionnaire was used to collect subject information such as age, gender, ethnicity, medical/medication history, diet habits, and other lifestyle factors, such as exercise and smoking status.8 Weight and height were measured with participants wearing light indoor clothing, with emptied pockets, and without shoes and socks, utilizing a daily calibrated balanced beam scale and stadiometer, respectively. Different skeletal-site BMDs for each subject were measured using a DXA machine (Hologic QDR-4500 Discovery DXA scanner, Hologic Inc.) by trained and certified research staff. The machine was calibrated daily using a phantom scan for quality assurance, and the accuracy of BMD measurement was assessed by the coefficient of variation for repeated measurements, ensuring that the CV remained below 0.6% for spine (SPN), total hip (HIP), and femoral neck (FNK) BMD. DXA-derived BMD measurements of the FNK, SPN, and HIP were used as phenotypes in the following analyses.
Whole genome sequencing
A total of 4982 participants who had complete questionnaire survey information and valid anthropometric and DXA measurements with blood-derived DNA undergoing WGS were analyzed. Strict quality control was taken for removing duplications and unqualified samples. The laboratory protocols have been previously described.2 Briefly, we performed WGS of the qualified DNA samples at an average read depth of 22X using a BGISEQ-500 sequencer (BGI Americas Corporation) to generate end pair of DNA fragments of 350 bp reads. The aligned and cleaned data of each sample were mapped to the human reference genome (GRCh38/hg38) using the Burrows–Wheeler Aligner software9 following the best practices workflows for variant analysis with the Genome Analysis Toolkit (GATK) to ensure accurate variant calling.10 Genomic variations including SNPs and small insertions/deletions were detected by the HaplotypeCaller of GATK, and the variant quality score recalibration method was applied to obtain high-confidence variant calls.10 PLINK was used to manage variance call files and compute the top 20 principal components with the default parameter setting for each sample.11
Structural variant identification
The workflow is illustrated in Figure 1. To obtain a more comprehensive and/or accurate SV callset, the detection of SVs was performed using an ensemble approach that involved 3 distinct SV callers: Breakdancer for read-pair base calling, Pindel for split-read base calling, and CNVnator for read-depth base calling.12 Each SV caller was applied to the aligned genome sequences to identify SVs within the samples. This study encompassed the investigation of 4 distinct types of SVs: deletions (DEL), duplications (DUP), insertions (INS), and inversions (INV). To consolidate the SV detection results, SV calls generated by each caller were integrated using MetaSV.12 The SVs identified by at least 2 methods were considered SVs with high-confidence and used in the subsequent analyses. Last, SV callings generated by each caller were combined across samples through the utilization of the SURVIVOR tool with the default parameters.13 This approach allowed us to enhance the accuracy and reliability of SV detection by capitalizing on the strengths of multiple SV callers and ensuring a robust assessment of SVs across the samples. The annotation of SVs was conducted employing the AnnotSV tool (Version 3.0.7)14 to investigate the potential pathogenic SVs based on The American College of Medical Genetics and Genomics (ACMG) ranking class.15 The detailed parameters for each tool are listed in Information S1.

Bioinformatics pipeline for the SVs detection, association, and annotation.
Association analysis
Utilizing the “lm” function from R version 4.0, we conducted a linear regression analysis to test the associations between each SV and the examined traits: FNK, SPN, and HIP BMD. Incorporating age, sex, and the top 5 genetic principal components from the overall cohort as covariates, we effectively mitigated potential confounding influences. A false discovery rate (FDR) correction was implemented to address the issue of multiple comparisons. Associations with FDR q-values of ≤0.05 were regarded as statistically significant. To facilitate an exhaustive exploration of potential subgroup effects, we conducted stratification analyses employing an identical procedure. Our focus encompassed sex- and ethnicity-specific subgroups, wherein the association study was also complemented with the appropriate covariate adjustment.
Co-occurrence analysis of bone-related SV in GWAS, TWAS, and Epigenome
Given the current limited understanding of the functionality of BMD-related SVs, we have embarked on a pioneering exploration of bone-related SVs, utilizing genomic positions derived from various previous omics studies. Our validation strategy involves aligning our findings with existing omics studies in the field of bone-related research. Genes displaying overlapping patterns will be given priority for further in-depth investigation. First, we employed a TWAS—gene prioritization approach—to identify trait-associated genes whose expressional levels re regulated by significant variants. TWAS models genetic regulation using a reference panel that includes genetic components and gene expression data. These models, with regulatory weights, estimate gene expression in larger GWAS cohorts and compute associations to establish gene-trait association and regulatory links. We used webTWAS tool,16 which compiles TWAS-discovered gene-disease associations from published GWAS summary statistics, to identify potential causal genes in a tissue-specific context related to osteoporosis. The co-occurrence analysis involves examining the identified bone-related SV regions within an upstream and downstream 250 kb window of the genes detected by webTWAS for bone-related genes. This approach provided valuable insights into the tissue specificity of gene-trait associations. Second, our investigation extended to the GWAS catalog,17 where we scrutinized variants associated with 11 bone-related traits (Information S1), focusing on those with p-values ≤ |$1\ast{10}^{-10}$|. Gwasrapidd R package was used to query bone-related SNPs from the GWAS catalog.18 By doing so, we identified genomic loci where the identified SVs intersect with or are closely located to relevant variants (± 250 kb), shedding light on potential shared genetic underpinnings. Furthermore, to unravel the regulatory potential of the identified SVs, we leveraged epigenomic data from the ROADMAP Epigenome Project19 across multiple cell types, including osteoblasts, CD14+ monocytes, mesenchymal stem cells (MSCs), chondrocytes, and myoblasts. This enabled us to annotate regions of potential interest, such as promoters and enhancers, which may indicate the functional importance of bone-related SVs. Lastly, enrichment analyses employing both gene ontology (GO) and biological pathway through clusterProfiler were executed to identify significant (FDR q-value ≤ 0.05) biological functions attributed to the genes related to BMD-associated SVs. Finally, the counts for each overlapped annotation with bone-related SVs were used to prioritize them for further discussion of their importance.
Results
SV discovery
In this study, we performed WGS for 4982 subjects, including 2875 white subjects and 2107 African American subjects, with a balanced gender distribution both in the total sample and within the ethnicity subgroups (Table 1). The average age of the participants is 39.20 yr (SD = 11.24).
Characteristic of whole genome sequencing study participants in Tulane Louisiana Osteoporosis Study (LOS).
| Overall | Stratified by gender | Stratified by ethnicity | |||||
|---|---|---|---|---|---|---|---|
| Characteristic | Female | Male | p-value | African American | White | p-value | |
| N (%) | 4982 | 2504 (50.26) | 2478 (49.74) | 2107 (42.29) | 2875 (57.71) | ||
| Gender = Male (%) | 2478 (49.74) | 1122 (53.25) | 1356 (47.17) | ||||
| Ethnicity = White (%) | 2875 (57.71) | 1519 (60.66) | 1356 (54.72) | ||||
| Age, yr (mean (SD)) | 39.20 (11.24) | 40.09 (13.14) | 38.31 (8.84) | <.001 | 39.63 (9.53) | 38.89 (12.34) | .022 |
| Weight, kg (mean (SD)) | 79.75 (20.11) | 75.72 (21.04) | 83.83 (18.24) | <.001 | 84.62 (21.50) | 76.19 (18.22) | <.001 |
| Femoral neck BMD (g/cm2) | 0.87 (0.21) | 0.84 (0.19) | 0.91 (0.23) | <.001 | 0.93 (0.21) | 0.83 (0.21) | <.001 |
| Lumbar spine BMD (g/cm2) | 1.06 (0.16) | 1.05 (0.16) | 1.07 (0.15) | <.001 | 1.10 (0.16) | 1.03 (0.15) | <.001 |
| Total hip BMD (g/cm2) | 1.01 (0.18) | 0.97 (0.19) | 1.04 (0.17) | <.001 | 1.06 (0.17) | 0.97 (0.18) | <.001 |
Abbreviation: BMD: Bone mineral density; The characteristics of study subjects were compared between genders/ethnicities using the t-test for continuous variables.
We identified a total of 31304 unique high-confidence SVs, comprising 25 873 deletions, 2532 duplications, 2827 inversions, and 72 insertions. Detailed information on these SV calls can be found in Table S1. Interestingly, the African American group exhibited a higher frequency of deletions (n = 23 858) compared to the white group (n = 18 571). In terms of gender differences, we observed a remarkable similarity in SV counts between males (n = 23 540) and females (n = 23 485). The lengths of deletions showed a bimodal distribution, with the majority being less than 1 KB or 10 KB. In contrast, duplications and inversions tended to be longer, with most exceeding 1 KB (Figure S1).
We categorized SVs into 5 standard classes based on the ACMG recommendations and consensus (see Figure S2). Strikingly, more than 78% of the identified SVs across the entire cohort were characterized as having an unknown significance. This finding underscores a critical gap in our understanding, indicating a lack of conclusive or consistent evidence regarding the implications of molecular alterations in disease contexts. In contrast, only 11% of the SVs received classification as benign variants.
Association between SVs and BMDs
Figure 2 visually represents the intricate web of associations between SVs and BMDs for overall and stratification analyses. We discovered a total of 125 SV-BMD associations for FNK-BMD, 99 for SPN-BMD, and 83 for HIP-BMD, all of which exhibited a q-value of ≤0.05, signifying their statistical significance. More than 70% of the identified BMD-related SVs across the entire cohort were characterized as having an unknown significance (Figure 3). Notably, none of the identified SVs demonstrated simultaneous associations with all the 3 distinct BMD traits (FNK-BMD, SPN-BMD, and HIP-BMD). However, our results indicate 87 nominally significant SVs associated with all BMD phenotypes in our overall sample analysis (p-value <.05). These counts vary, with 74 in African Americans, 28 in Whites, 53 in males, and 99 in females in our subgroup analyses. Additionally, more than 50% of the SV-BMD associations overlapped between the results for FNK-BMD and HIP-BMD, as confirmed through analyses conducted for both combined and sex/ethnicity-specific datasets.
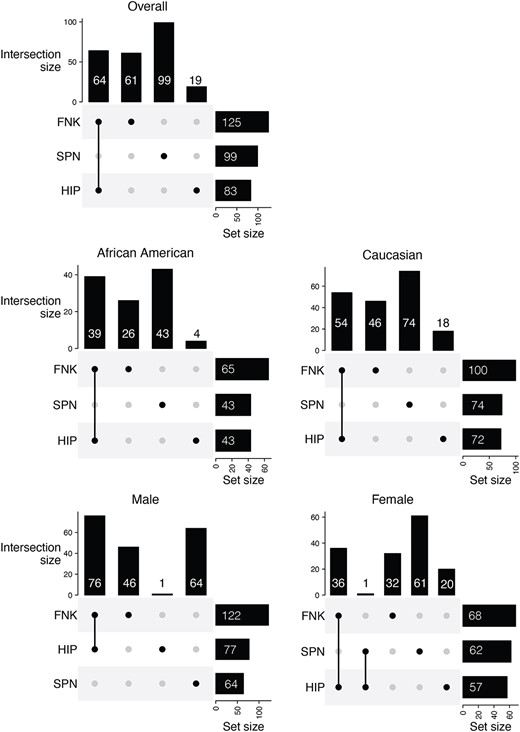
UpSet plot for BMD association tests with FDR |$\le$| 0.05. The plot visualizes the significant associations between structural variations (SVs) and BMD across 3 skeletal sites: Femoral neck (FNK), hip (HIP), and lumbar spine (SPN) for the overall samples or subgroups. The intersections indicate the common associations among different BMD sites. The vertical bars represent the number of significant associations for each unique combination of BMD sites, while the horizontal bars show the total number of significant associations for each individual BMD site. This visualization helps identify unique and shared genetic associations across different bone regions.
Interestingly, we observed a higher number of SVs associated with FNK-BMD in comparison to associations with HIP-BMD and SPN-BMD in both combined and sex/ethnicity specific analyses (Data S1). This finding underscores the potential relevance of SVs associated with FNK in understanding variations in BMDs. Furthermore, the effect sizes identified in the combined samples varied within the following ranges: −0.04 to 2.99 for FNK-BMD, 0.06 to 1.82 for HIP-BMD, and −0.35 to 1.36 for SPN-BMD (Table S2). The combined group analysis reveals that HIP BMD exhibits the highest mean R-squared (R2) value of bone-related SVs (mean = 14.1%, range = 13.3%-19.1%) (Table S3). Upon subgroup examination, the white subgroup’s SPN site demonstrates the lowest R2 value (mean = 2.91%, range = 2.09%-7.3%), indicative of comparatively reduced model efficacy. Notably, the female subgroup displays substantial R2 values at FNK and HIP (Mean = 15.5%, range = 12.8%-32.1%), surpassing those observed in the male subgroup (Highest mean = 10.2% for HIP). This discrepancy underscores potential gender-related disparities in model predictiveness concerning FNK. Among these BMD-related SVs, over 70% of those associated with FNK-BMD, along with 71% for HIP-BMD and 82% for SPN-BMD, are characterized as having an unknown significance. All results are listed in Data S1 for all association analyses, and Data S2 contains results specific to ethnicity or gender.
Co-occurrence analysis of bone-related SV in GWAS, TWAS, and Epigenome
We incorporated a total of 6363 bone-related SNPs sourced from the GWAS catalog, which were mapped to 5763 genes (Table S4). Notably, these previously reported bone-related GWAS SNPs exhibited significant overlaps or proximity to FNK-related SVs by 42% and to HIP or SPN-related SVs by 46% (Table S5 and Figure S3).
During our investigation using the webTWAS database, we identified 12 SVs that did not map to any known genes, alongside 9 unique SVs that could be confidently mapped to genes, including FMN2, KRT77, LINC02341, PKP4, PMPCA, PWRN1, PWRN2, PWRN3, and ROCK2. Remarkably, PKP4 had previously been implicated in osteoporosis risk based on its genomic position.16 The remaining genes were found to be closely located to the 24 genes previously identified in the osteoporosis TWAS.16 The FMN2 and LINC02341 genes, carrying sex/ethnicity-specific SVs, have been shown to be positively associated with BMDs.16,20 All detailed results are provided in Data S3.
One noteworthy finding was the positive association of a deletion SV (12_49175601_49184059_DEL_1) with LS BMD across all the combined sample group, in white, and male-specific subgroups. This SV was in close proximity to the PRKAG1 gene and has been suggested as a potential causal factor for osteoporosis.16 Additionally, an inversion SV (4_87926009_87935790_INV_1) was found to be closely located to IBSP and SPP1 in joint tissue analysis, suggesting these genes may also play a role in osteoporosis risk.
In the ROADMAP epigenome data, we identified a significant overlap between the BMD-related SVs and enhancers/promoters (Figures S4 and S5), encompassing 1033 elements on chromosome 7 and 958 elements on chromosome 19, out of a total of 7290 elements identified on autosomes. This overlap extended across various cell types, including CD14+ monocytes, chondrocytes, MSCs, myoblasts, and osteoblasts. Specifically, we observed that 959 enhancer/promoters among all the cell types on chromosome 7 overlapped with inversion SVs, while on chromosome 19, 726 elements overlapped with deletion SVs, and 232 were associated with inversion SVs. Similar patterns were observed in sex- and ethnicity-specific analyses, which are detailed in Data S4. Integrating all these omics annotations with our bone-related SV, the top 10 annotated BMD-related genes included FMN2, LINC00494, ZNF468, ZNF320, ZNF28, CFAP46, LINC02370, TPPP, ZDHHC11, and ZDHHC11B (Figure 4). All results are provided in the relevant sections of the Supplemental Material (Figures S6–S9).
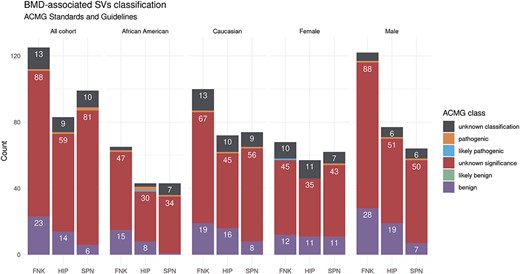
BMD-related SV ACMG classification in the LOS study. A bar graph summarizes the count of BMD-related SVs with the ACMG classification across different bone sites and study groups. The majority of the identified SVs in the femoral neck (FNK), hip (HIP), and lumbar spine (SPN) for the overall samples or sex/ethnicity-specific groups are of unknown significance to human health.
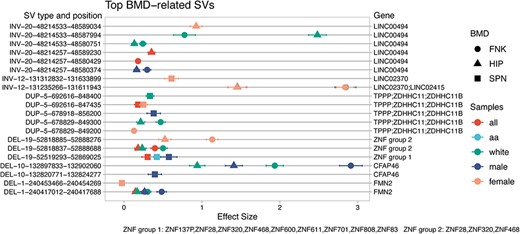
Top 10 omics annotated BMD-related SVs and their corresponding genes. The top BMD-related SVs were prioritized based on the counts of omics annotations from co-occurrence analyses in GWAS, TWAS, and Epigenome. The figure illustrates the top 10 genes associated with these SVs. The x-axis shows the effect size of the association with BMD. The left y-axis indicates the SV type (deletions (DEL), duplications (DUP), and inversions (INV)), chromosome position, and the start and end positions according to the human genome HG38 version. The right y-axis lists the genes associated with the corresponding SVs. Different shapes represent various BMD traits (femoral neck (FNK), Hip (HIP), and lumbar spine (SPN)), and different colors indicate sample groups (all, white, African American (aa), male, female).
Furthermore, GO and pathway analysis revealed an enrichment of BMD-related SVs in the domain of molecular functions, with 106 significant GO molecular terms observed (FDR q-value ≤0.05; Table S6). Notably, the analysis highlights distinct patterns within different population groups, particularly emphasizing the findings in African Americans, who exhibited a higher number of results of GO terms and pathways compared to other subgroups. Specifically, we identified 83 enriched GO terms (Figure 5) and 17 pathways from KEGG in the African American subgroup (Figure 6). We found that Hip-BMD-related SVs in females did not exhibit significant enrichments in either GO terms or KEGG pathways following FDR corrections for multiple comparisons.
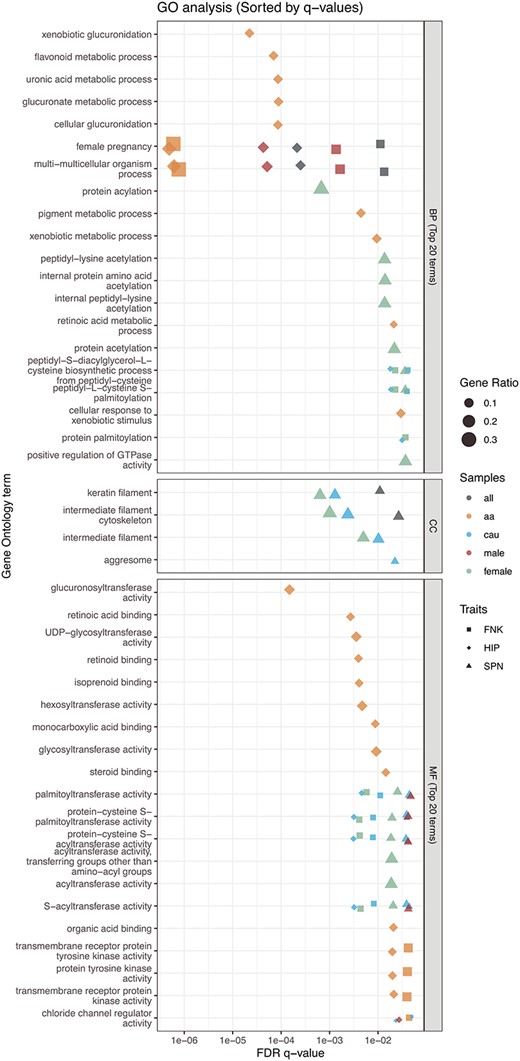
Top 20 terms for GO enrichment analysis. The biological functions of BMD-related genes were analyzed using gene ontology (GO). The advanced bubble plot illustrates the significance of GO enrichment items for BMD-related genes across 3 functional groups: biological process (BP), cellular component (CC), and molecular function (MF). The x-axis represents the false discovery rate (FDR q-value), and the y-axis represents the GO terms. This analysis highlights key biological functions and processes associated with BMD in the femoral neck (FNK), hip (HIP), and lumbar spine (SPN) across different overall or sex/ethnicity-specific groups. “a” refers to African American, and “cau” refers to Caucasian/White populations.
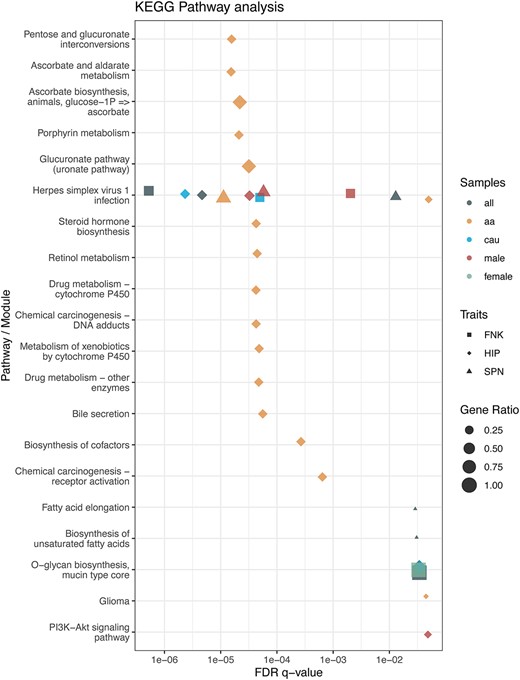
KEGG pathway analysis. The biological functions of BMD-related genes were examined using KEGG pathway enrichment analysis. The advanced bubble plot depicts the significance of KEGG enrichment terms for BMD-related genes across various pathways or biological modules. The x-axis indicates the false discovery rate (FDR q-value), while the y-axis lists the KEGG pathways. This analysis identifies key biological pathways linked to BMD in the femoral neck (FNK), hip (HIP), and lumbar spine (SPN) across different groups, including overall or specific sex/ethnicity groups. “aa” refers to African American, and “cau” refers to Caucasian/White populations.
Discussion
Genomic SV is a major source of genetic diversity in the human genome that contributes to phenotypic heterogeneity.21 However, despite the extensive investigation of genetic correlations with BMD to elucidate potential biological mechanisms underlying osteoporosis,2,3 there is still a lack of studies focusing on SVs in relation to BMD. This study represents the first genome-wide SV association analysis for BMD in a large population-based sample of both white and African American subjects, with combined as well as sex-specific analyses.
With a genomic coverage of ~22X, we identified 31 304 unique high-confidence SVs, including 25 873 deletions, 2532 duplications, 2827 inversions, and 72 insertions, among 4982 White and African American genomes. This number is smaller than that reported in 4 previous studies5: genomeAD-SV (SV count (n) = 433 371; 32× sequence coverage), the 1000 Genomes Project (n = 68 818; 7× sequence coverage), the Genome of the Netherlands Project (n = 67 357; 13× sequence coverage), and the Genotype-Tissue Expression Project (n = 23 602; 50× sequence coverage). The variation in the quantity of observed SV calls can be attributed to differences in sequencing depth, detection algorithms, and filtering criteria. We generated only 4 types of SVs, in contrast to the 7 types reported in the previous studies, primarily due to algorithm limitations in SV-calling methods in our study. However, the distribution of the length of SVs in our dataset is similar to the previous findings, mainly comprising rare SVs with variations of approximately 1 kb in size. The genome locations of these SVs are predominantly found near the centromere or telomere regions (Figure S3),22 and a mounting body of evidence underscores their significance in human diseases, serving as origins of genomic instability or reservoirs of haplotypes containing causal mutations.5
The variance explained by SVs for BMD traits in our study surpasses that reported in previous genetic studies of osteoporosis. In our study, the minimum estimate of variance explained by SVs is 2%, reaching up to 32.1%. Previous studies, which predominantly focused on SNVs,2,3 demonstrated that SNVs account for only 1.9% to 20% of the variance in BMD across various bone sites.4 This may suggest that the effects of SVs on BMD are larger than those of SNVs, which have many small effects that contribute to the trait. However, earlier studies have highlighted the substantial genetic heritability of BMD, with correlations between BMD measurements ranging from 0.5 to 0.79 (R2: 25% to 62%) across different samples.23 These findings indicate that there is still significant scope for exploring additional genetic factors influencing BMD.
Our research extended to a comprehensive co-occurrence analysis of bone-related SVs within GWAS, TWAS, and epigenomic datasets. Among the top 10 prioritized genes, we discovered 9 novel genes potentially associated with the BMDs: LINC00494, ZNF468, ZNF320, ZNF28, CFAP46, LINC02370, TPPP, ZDHHC11, and ZDHHC11B. Previously, none of these genes had been linked to BMD or osteoporosis in GWAS databases. Our study also revealed a gender-specific effect of SV. For example, FMN2, which carries BMD-related deletions, exhibits a positive association with the FNK or HIP BMDs in the combined group as well as in white and male subgroups, as observed in previous studies.16 However, it has been observed that FMN2 carries deletions (DEL001390SUR) specific to females, demonstrating a negative association with SPN BMD.
We also observed that the SVs identified did not show concurrent associations with all 3 BMD traits under investigation. This could be due to our use of a stringent FDR q-value threshold; concurrent associations might be found if a nominal P-value threshold was used instead (Figure S10). Nevertheless, a significant overlap in SV-BMD associations was observed between FNK-BMD and HIP-BMD in both combined and subgroup datasets. The discrepancy in these findings might be attributable to variations in trabecular bone mass at distinct skeletal sites, suggesting that BMD at various skeletal sites is influenced by a combination of common and distinct genetic and environmental factors.24,25 The LS is primarily composed of trabecular bone,26 supporting the upper body’s weight and maintaining flexibility, whereas the hip and femur neck bone sites consist mainly of cortical bone.27 Trabecular bone is characterized by high metabolic activity and rapid turnover compared to cortical bone.27 This accelerated bone formation and remodeling ultimately leads to increased bone density.28 Through GO and pathway annotations (Figure S11), we discovered that bone-related genes may be involved in similar GO terms or biological pathways, providing additional supportive evidence for the notion that bone-related genes’ similar biological functions may be implicated in comparable biological processes in the FNK and HIP skeletal sites. This may help elucidate the site-specific differences in BMDs.
Delving deeper into specific genetic findings, our study highlights an RNA gene, LINC00494 (long intergenic non-protein coding RNA 494), which carries 6 unique inversions and exhibits positive associations with FNK and HIP BMD in both combined and stratified analyses. Although few studies have demonstrated the relationship between BMD and LINC00494, SNP variants in LINC00494 were found to be positively associated with body height29 or lower risk of smoking initiation.30 The 6 inversions (INV0017053SUR, INV0017060SUR, INV009700SUR, INV009705SUR, INV0012184SUR, INV0012314SUR) were found in a previous study31 and overlapped with topologically associating domains (TADs) (ENCODE accession ID: ENCFF603GAT). It is known that the disruption of TADs caused by SVs may reshape the boundary regions and alter the gene expression.32 Therefore, further investigation of these inversions may provide valuable insights into the intricate regulatory mechanisms governing BMD and osteoporosis susceptibility.
Zinc-finger proteins (ZNFs), with diverse molecular functions and finger-like DNA-binding domains, are pivotal in cellular processes, acting as recruiters of chromatin modifiers, co-factors, or structural proteins involved in migration and invasion.33 ZNFs significantly contribute to tissue development, differentiation, and the pathogenesis of diseases like neurodegeneration, skin disorders, and diabetes.33 We identified 6 large-scale deletions (DEL0013690SUR, DEL0013604SUR, DEL007746SUR, DEL009929SUR, DEL009750SUR, and DEL009879SUR) with an average length of 135405.22 kb, collectively encompassing 26 ZNF genes. Notably, all these deletions exhibited positive associations with all BMD measurements in the combined samples. In our stratification analysis, the positive associations were observed in both SPN and HIP measurements in the white-only female cohort, as well as in SPN BMD for the male-only and African American -only cohorts. Furthermore, we observed that 2 ZNF genes, namely ZNF28 and ZNF320, co-occurred with previously identified GWAS signals. The SNVs in ZNF28 have been found to be positively associated with gut microbiota (Lactobacillus).34 Previous mouse model and clinical trial studies discovered a beneficial impact of Lactobacillus reuteri that effectively mitigated osteoclast deficiency, enhanced osteoblast activity, and consequently, prevented the loss of trabecular bone in the femur and spine.34 The variations in these regions may affect bone health.
Structural variants, which frequently impact multiple neighboring genes, constitute a significant contributor to variations in gene expression within the human genome.31 We demonstrated that numerus BMD-associated SVs overlap or are in close proximity to potential bone-related genes from views of genomics, transcriptomics and biological functions. For example, the PKP4 gene, which carries DEL0011080SUR positively associated with SPN-BMD in the female-specific cohort, has been associated with osteogenesis in the minor salivary gland.16 However, its function in bone cells is not evident and requires further study.35 Additionally, our webTWAS analysis suggested that PRKAG1 gene (ENSG00000181929.11; 12_49175601_49184059_DEL) may act as a potential causal factor for osteoporosis in esophagus mucosa tissue.16 Furthermore, 2 other potential causal genes, carrying an INV, are known to be associated with osteoporosis. The IBSP gene is a protein-coding gene and a major structural protein of the bone matrix,36 while SPP1 has also been identified as a predictor of the risk of osteoporosis and fractures.37
The co-occurrence analysis with ROADMAP has shown that large-scale inversions overlapped with ZNF gene family members (ZNF12, ZNF316, ZNF853) are also found to overlap with enhancers or promoters in osteoblasts, CD14+ monocytes, MSCs, chondrocytes, and myoblasts. Notably, the inversions (INV0026631SUR, INV0015087SUR, and INV0019005SUR) positively associated with FNK or HIP BMDs are overlapped with PMS2, a critical component of DNA repair and maintenance.38 Although the insertions in PMS2 suggests potential benefits of BMDs, it is important to note that the malfunction of the PMS2 gene may lead to ovarian cancer.39 Ovarian cancer can indirectly impact bone health by potentially reducing estrogen production, which, in turn, can affect bone protection.40 Another interesting discovery is that we found many deletions that overlapped with enhancers/promoters in osteoblasts, CD14+ monocytes, and MSCs were also associated with osteoporosis-related genes, including DEL0015044SUR and DEL0019117SUR in FOXK141 and DEL0027652SUR, DEL0020140SUR, and DEL0019938SUR in MAGI2.42
The functional annotations from GO and pathway enrichment analyses reveal the involvement of bone-related genes and their corresponding biological mechanisms. In the GO analysis, the identified BMD-related genes are significantly enriched in protein palmitoylation activity, which includes palmitoyl transferase activity, protein-cysteine S-palmitoyltransferase activity, protein-cysteine S-acyltransferase activity, and S-acyltransferase activity. Protein palmitoylation is a reversible post-translational lipid modification involved in various physiological and pathological processes.43 A recent study has demonstrated that inhibiting palmitoylation effectively protects against estrogen deficiency-induced bone loss and bone resorption in ovariectomized mice,44 suggesting the therapeutic potential of targeting palmitoylation in osteoporosis. Mechanistically, this treatment modulates key regulatory factors while maintaining the activation of osteoclastogenic pathways induced by RANKL.44 In terms of biological processes, multicellular organism processes and female pregnancy were also identified in the combined and stratified samples. This provides evidence that the identified bone-related genes may play a role in cell proliferation, cell specialization, cell interaction, and cell movement for bone remodeling, as well as in hormonal influence on maintaining bone density.
The pathway analysis indicated that the ZNF family genes are enriched in the Herpes simplex virus 1 infection pathway. The results may complement or resonate with findings from several previous studies.45,46 For example, patients with herpes zoster have a higher risk of developing osteoporosis.45,46 Herpes zoster can trigger chronic inflammation, and the cellular immune response provoked by the zoster virus results in neuronal inflammation and destruction.47 This inflammation may also contribute to the development of risk factors such as anorexia, weight loss, and osteoporosis.46 Further investigation of genomic structural variations may provide more insight into the effect of chronic inflammatory diseases on bone metabolism.
The strength of this study lies in the utilization of a large, multiethnic sample and an ensemble SV-calling approach to generate high-confidence SVs. This approach has allowed us to provide novel results that elucidate the relationships between osteoporosis and large-scale structural variations. The external validation annotations from other omics sources provide additional confirmation of the potential bone-related genes that may influence bone density. However, several limitations should be considered when interpreting our findings. First, due to the lack of available independent WGS samples with BMD phenotype information, we utilized GWAS, TWAS, and epigenome bone-related annotations to prioritize the SVs and as partial validations. Second, it is well-known that the results of SV calling can be affected by factors such as the WGS platform and its calling algorithms.48 The use of long-reads and deep coverage may provide more accurate SV calling. In this study, we employed ensemble approaches to enhance our SV calling and generate high-confidence SVs, thereby reducing the risk of false interpretation of the results.48
Conclusion
This study highlights the significance of genomic structural variations in BMD and systematically prioritized the identified risk genes and genome regions, including several that offer new prospects as candidate genes associated with osteoporosis. We expect that our outcomes will inspire forthcoming studies designed to substantiate the biological relevance of these genomic regions through functional validation experiments.
Acknowledgments
We would like to acknowledge the contributions of all LOS participants, as well as all the members from the Tulane Center for Biomedical Informatics and Genomics, for their support behind the scenes.
Authors contribution
Kuan-Jui Su (Conceptualization, Data curation, Formal analysis, Investigation, Writing—original draft, Writing—review & editing), Chuan Qiu (Data curation, Project administration), Jonathan Greenbaum (Conceptualization, Data curation, Writing—review & editing), Xiao Zhang (Methodology, Resources, Validation, Writing—review & editing), Anqi Liu (Data curation, Writing—review & editing), Yong Liu (Data curation, Writing—review & editing), Zhe Luo (Data curation, Project administration, Resources), Shashank Sajjan Mungasavalli Gnanesh (Data curation), Qing Tian (Data curation, Project administration, Resources), Lan-Juan Zhao (Data curation, Project administration), Hui Shen (Conceptualization, Funding acquisition, Resources, Writing—review & editing), and Hong-Wen Deng (Conceptualization, Funding acquisition, Resources, Supervision, Writing—review & editing).
Funding
This research was benefited by the partial support by grants from the National Institutes of Health ( P20GM109036, R01AR069055, U19AG055373, R01AG061917).
Conflicts of interest
The authors declare no competing interests.
Data availability
The raw WGS data that support the findings of this study are available from the corresponding author upon reasonable request. The population-level SV data that support the findings of this study are openly available in Mendeley Data with DOI: 10.17632/d6dn5tv3bk.1.
Ethics approval
This research study involving human subjects complied with the ethical principles outlined in the World Medical Association Declaration of Helsinki—Ethical Principles for Medical Research Involving Human Subjects. Institutional approval from Tulane Institutional Review Board was obtained prior to the commencement of the study. The research adhered to the guidelines and regulations set forth by the overseeing body. Written informed consent was obtained from all participants, and measures were taken to ensure the privacy and confidentiality of the subjects. No information that may identify individual human subjects will be published as part of this manuscript.
