


ABSTRACT
Type 2 diabetes (T2D) has negative effects on skeletal health. A proposed mechanism of diabetic bone disease connects hyperlipidemia to increased bone marrow adiposity and decreased bone quality. Previous research on Type 1 diabetes reported positive associations between serum lipid levels and marrow adiposity, but no data exist for T2D. In addition, marrow adiposity is sex‐dependent in healthy populations, but sex has not been addressed adequately in previous reports of marrow adiposity in T2D. The purpose of this study was to quantify associations of marrow adiposity and composition with T2D status, serum lipid levels, and sex. T2D patients and normoglycemic controls (n = 39/37) were included. Single‐voxel magnetic resonance spectroscopy (MRS) was performed at the spine and tibia. Quantitative MRS outcomes of marrow adiposity and composition were calculated. Linear regression models were used to compare MRS outcomes among groups and to evaluate associations of MRS outcomes with serum lipid levels. All analyses were performed on sex‐stratified subgroups. Total, unsaturated, and saturated fat content at the spine were lower in T2D participants compared to controls in age‐adjusted models; these differences were significant in men but not in women. In our study cohort, total cholesterol, low‐density lipoprotein (LDL), and high‐density lipoprotein (HDL) were lower in T2D participants compared to controls. Adjustment for LDL, HDL, and statin use attenuated the association of T2D status with unsaturated fat but not saturated fat in men. Further analysis confirmed significant associations between serum lipid levels and MRS outcomes. Specifically, we found a positive association between LDL cholesterol and total marrow fat in the male T2D group and a negative association between HDL and total marrow fat in the female T2D group. In conclusion, our results suggest that marrow adiposity and composition are associated with lipid levels as well as T2D status, and these relationships are sex‐specific. © 2023 American Society for Bone and Mineral Research (ASBMR).
Introduction
Type 2 diabetes (T2D) is a chronic metabolic disorder and a major public health concern. While in past decades research focused on the cardiovascular, renal, and retinal complications of T2D, more recent studies have identified clinically significant negative skeletal effects of T2D.(1,2) Patients with T2D experience 40% to 70% higher fracture incidence compared to nondiabetic people at various skeletal sites, particularly at the lower extremities.(3‐5) However, bone mineral density (BMD), widely used in the assessment of bone quality and fracture risk, is normal or even elevated in T2D patients. This demonstrates that traditional quantitative methods of bone assessment fail to evaluate fracture risk accurately in the setting of T2D. Further, these traditional methods of bone assessment cannot provide insight into the biological mechanisms driving the increased fracture risk in T2D.
An inverse relationship between marrow adiposity and bone quality is increasingly recognized across a spectrum of conditions. In aging and obesity, increased marrow adiposity is correlated with osteoporosis and increased fracture risk.(6‐9) Increased marrow adiposity coupled with decreased bone quality has also been documented in caloric restriction and anorexia.(10) The sparse literature describing marrow adiposity in T2D, however, is inconsistent. Sheu et al. found increased spine marrow adiposity in men with diabetes compared to men without diabetes.(11) In a smaller study including both men and women with severe obesity, Yu et al. similarly found increased spine marrow adiposity in those with diabetes.(12) In contrast, three studies of women found no significant differences in spine marrow adiposity between participants with diabetes and those without.(13‐15) In the single publication reporting marrow adiposity at peripheral sites in T2D, Kim et al. reported slightly lower marrow adiposity at the tibia in women with T2D compared to controls.(15)
Magnetic resonance spectroscopy (MRS) is a noninvasive, in vivo technique that is widely used to quantify marrow adiposity and can additionally be used to assess the composition of bone marrow adipose tissue (BMAT), including levels of lipid saturation.(16) Saturated and unsaturated marrow lipid levels have distinct relationships with bone density and fracture outcomes(16) and therefore are important to measure, in addition to total marrow adiposity.(16) As for total marrow adiposity, however, the literature describing BMAT composition in T2D is sparse and inconsistent. However, there are indications that BMAT composition is altered in T2D, specifically that the levels of lipid saturation are higher(13) and levels of lipid unsaturation are lower.(12,14) These findings are important and possibly clinically significant because they can be indicative of the type of marrow adipose tissue present: regulated BMAT (rBMAT) or constitutive BMAT (cBMAT). With different lipid saturation profiles and possibly different functions,(17‐20) they might also explain increased fracture risk.
While previous research suggested that both bone quality and marrow adiposity were altered in T2D, the mechanisms remain unclear. A proposed mechanism of increased marrow adiposity and decreased bone mass is through hyperlipidemia, which promotes marrow adipogenesis through the activation of PPARγ.(21) Preferential differentiation from common precursors toward adipocyte lineage may reduce osteoblastogenesis, thereby decreasing bone quality. Although no data exist on the relationship between serum lipid levels and marrow adiposity in humans with T2D, Slade et al. reported a positive association between serum lipid levels and marrow adiposity in humans with Type 1 diabetes (T1D).(22) This correlation has also been documented in people without diabetes.(23) Evaluating the relationship between hyperlipidemia and marrow adiposity in T2D may reveal biological mechanisms driving bone and marrow changes in T2D, which result in increased bone fragility.
Previous publications presented contradictory data regarding the association of bone marrow adiposity with T2D, but none reported sex‐stratified analyses. This may be an important knowledge gap because it has been established that marrow adiposity is sex‐dependent in healthy populations.(24,25) Specifically, Griffith et al. found that marrow adiposity was 10% higher in healthy females compared to males, controlling for BMD, in participants over 65 years old. These results underscore the importance of sex‐stratified analyses in the evaluation of BMAT alterations in T2D.
The purpose of this study was to quantify and compare bone marrow adiposity and composition in older male and female T2D patients compared to normoglycemic controls at the spine and distal tibia. Relationships between serum lipids and bone marrow adiposity and composition markers were also evaluated. We hypothesized that (1) T2D patients would have increased bone marrow adiposity compared to controls, (2) these relationships would be sex‐specific, and (3) there would be strong positive associations between serum lipid levels and marrow adiposity in T2D.
Methods
Study participants
Men and postmenopausal women aged 50–70 years with and without T2D were recruited from University of California San Francisco (UCSF) and community health clinics. Participants with T2D had been diagnosed at least 3 years prior. Diagnosis was defined by the American Diabetes Association: either receipt of pharmacological treatment for 3 or more years or hemoglobin A1c (HbA1c) of ≥6.5 for 3 or more years in the case of no pharmacological treatment (diet control). Normoglycemic control participants were frequency matched on age (5‐year groups), sex, and body mass index (BMI) categories (normal, overweight, and obese).
All potential participants were screened by dual‐energy X‐ray absorptiometry (DXA), and only those with a DXA T‐score between 0 and −2.5 were included. In addition, health and medication history information of all potential participants was collected using a questionnaire. Potential participants satisfying any of the following criteria were excluded: (1) history of metabolic bone disease other than osteoporosis; (2) chronic gastrointestinal disease, renal, or hepatic impairment (known cirrhosis or if transaminase levels threefold above normal limit); (3) use of medications known to impact bone and mineral metabolism, including use of a bisphosphonate or teriparatide in the last year or for >12 months ever, current calcitonin, prednisone >5 mg daily or the equivalent glucocorticoid for >10 days in the last 3 months, current thiazolidinedione, or thyroid hormone replacement with current thyroid stimulating hormone <0.1 mIU/L; (4) perimenopausal status; and (5) contraindications to X‐ray or magnetic resonance imaging (MRI). The study protocol was approved by the UCSF Committee on Human Research, and each participant provided written consent before enrollment.
Laboratory analyses
Blood was drawn after an overnight fast, and the following blood tests were performed at a Clinical Laboratory Improvement Amendments–certified clinical laboratory: serum glucose, creatinine, HbA1c, calcium, 25‐hydroxyvitamin D, triglycerides (TG), total cholesterol (TC), high‐density lipoprotein (HDL), and low‐density lipoprotein (LDL) cholesterol.
Data acquisition
DXA scans were performed on a single DXA scanner (Horizon A; Hologic, Marlborough, MA, USA). Areal BMD (aBMD) values were acquired at the spine (L1 to L4) and proximal femur (neck and total femur region). T‐scores were calculated based on National Health and Nutrition Examination Survey gender‐matched reference data. MRI scans of the spine and distal tibia were performed on a 3T whole‐body scanner (MR750w, GE Healthcare, Waukesha, WI, USA) using an in‐table spine coil and a 16‐channel flex coil (In‐Vivo Corporation, Gainesville, FL, USA) with auto channel selection. Before performing MRS, a sagittal T2‐weighted fast spin echo (FSE) sequence (TR/TE = 4500/68 ms, bandwidth = ±31.25 kHz/pixel; flip angle = 142° [vertebral] or 111° [distal tibia]; field of view = 24 mm [vertebral] or 16 mm [distal tibia], slice thickness = 5 mm) was performed for visual inspection of bone fractures and lesions as well as for prescription of the MRS acquisition box. Single‐voxel MRS data were acquired using the Stimulated Echo Acquisition Mode (STEAM) method with the following sequence parameters: TR/TE = 3000/20 ms (vertebral) or 3000/30 ms (distal tibia); bandwidth = 5 kHz; data point = 4096. For vertebral scans, a volume of interest (VOI: 15 × 12 × 12 mm) was located in the center of each of the vertebral bodies L3 and L4. For distal tibia scans, the single voxel (15 × 10 × 10 mm) was placed with the center 34.5 mm proximal to the joint line (Fig. 1).
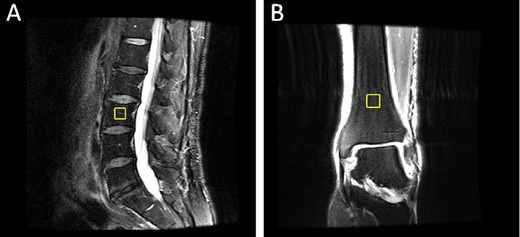
Example MRS VOI: (a)spine (sagittal view), and (b) distal tibia (coronal view).
MRS data analysis
Prior to MRS data analysis, FSE images were reviewed by a radiologist (TML) to identify fractures or marrow lesions overlapping the MRS voxel. Spine T2 scans were visually inspected for marrow lesions, including Modic lesions or Schmorl's nodes. These were detected based on signal intensity on T2 and on structural abnormalities. Data from voxels overlapping bone marrow abnormalities were excluded. MRS data were analyzed using in‐house software based on previous work.(26,27) Data from each individual channel were processed with frequency and phase corrections. Because peak amplitude may differ among channels, directly averaging all channels may conceal peak contrast. To avoid this, we calculated a combined signal by performing weight averaging on all channels with the amplitude of the 1.3 ppm peak rather than using a fixed weighting. After calculating this combined weight‐averaged signal, smoothing (line broadening = 15) was applied on the combined signal to reduce noise.
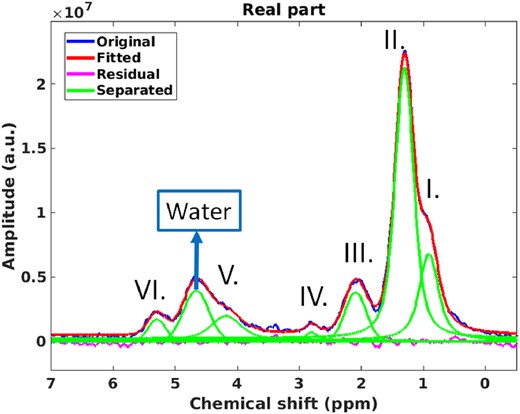
Example MRS spine spectrum: original spectrum (blue), individual fitted peaks (green), their combined spectrum (red), and the fitting residual (pink). Roman numerals represent the peaks corresponding to olefinic peaks.
Statistics
Demographic, laboratory test, and DXA parameters were compared using unpaired two‐sample t tests. Generalized estimating equations (GEEs) accounting for multiple measurements per person (L3, L4) were used to assess the relationships between T2D status and vertebral MRS outcomes. Linear regression was used to assess the relationships between T2D and tibia MRS outcomes. Standardized beta coefficients were used to evaluate the associations of spine MRS outcomes with serum lipids (total cholesterol, LDL, HDL, and TG). The ratio of total cholesterol to HDL, a lipid biomarker that describes the proportion of “non‐HDL” lipids that is commonly used as a marker of cardiovascular disease risk, was also calculated to evaluate its association with MRS outcomes. All analyses were performed on sex‐stratified subgroups and adjusted for age, given the associations of sex and age with BMAT metrics documented in previously published studies.(24,25) Models were further adjusted for statin use, which is associated with serum lipid levels and may impact marrow adiposity. Furthermore, additional adjustment for TFC was performed on the association of UFC and SFC to serum lipids to evaluate associations of UFC and SFC with serum lipids independent of TFC. A p value of less than 0.05 was considered statistically significant. Analyses were performed using STATA version 16 software (StataCorp LP, College Station, TX, USA).
Results
Demographics and laboratory assessments
In total, 39 T2D patients and 40 controls were recruited for this study. Three controls were excluded due to prediabetes (based on HbA1c), so 37 controls remained in this study (Table 1). Data from one L3 MRS scan (control) and five L4 MRS scans (three controls and two T2D patients) were excluded due to overlap with bone marrow abnormalities identified on the sagittal fat‐suppressed FSE images. Data from 10 tibia MRS scans (two controls and eight T2D patients) were excluded because of incorrect MRS VOI placement.
Participant characteristics
| Male | Female | |||||
| Control | T2D | Control | T2D | Control | T2D | |
| text-decoration:underline | ||||||
| n | 37 | 39 | 16 | 18 | 21 | 21 |
| Age (years) | 62.0 ± 5.4 | 61.7 ± 5.6 | 60.9 ± 5.1 | 59.7 ± 5.7 | 62.9 ± 5.5 | 63.4 ± 4.9 |
| Race | ||||||
| White | 26 | 22 | 12 | 13 | 14 | 9 |
| Asian | 9 | 12 | 4 | 3 | 5 | 9 |
| Black | 1 | 4 | 0 | 2 | 1 | 2 |
| Islander | 0 | 1 | 0 | 0 | 0 | 1 |
| Not reported | 1 | 0 | 0 | 0 | 1 | 0 |
| BMI (kg/m2) | 25.1 ± 3.9 | 28.0 ± 4.1a | 26.2 ± 4.0 | 27.7 ± 3.5 | 24.3 ± 3.8 | 28.3 ± 4.7c |
| Antilipidemic medication | 7 | 24a | 4 | 9 | 3 | 15c |
| Insulin therapy | 8 | 0 | 8 | |||
| T2D duration (years) | 11.4 ± 7.5 | 9.9 ± 8.0 | 12.6 ± 7.0 | |||
| text-decoration:underline | ||||||
| HbA1c (%) | 5.4 ± 0.2 | 7.2 ± 1.5a | 5.4 ± 0.2 | 6.8 ± 1.0b | 5.3 ± 0.3 | 7.5 ± 1.7c |
| Fasting glucose (mg/dl) | 90.0 ± 16.8 | 138.1 ± 52.0a | 90.9 ± 23.8 | 124.6 ± 34.7b | 90.8 ± 9.1 | 149.7 ± 61.7c |
| Total cholesterol (mg/dl) | 211.7 ± 45.1 | 157.1 ± 38.0a | 191.6 ± 52.5 | 146.3 ± 34.3b | 227.0 ± 32.0b | 166.3 ± 39.4c |
| LDL (mg/dl) | 122.7 ± 35.2 | 83.5 ± 30.9a | 114.8 ± 45.0 | 78.8 ± 27.1b | 128.7 ± 25.0 | 87.5 ± 34.0c |
| HDL (mg/dl) | 69.4 ± 22.0 | 49.3 ± 14.5a | 56.3 ± 13.6 | 43.0 ± 9.5b | 79.4 ± 22.1b | 54.8 ± 16.0c,d |
| Triglycerides (mg/dl) | 94.8 ± 48.0 | 148.8 ± 66.8a | 102.8 ± 45.4 | 153.8 ± 73.9b | 88.7 ± 50.1 | 144.5 ± 61.6c |
| Calcium | 9.4 ± 0.3 | 9.5 ± 0.3 | 9.4 ± 0.2 | 9.5 ± 0.3 | 9.5 ± 0.3 | 9.5 ± 0.3 |
| Vitamin D | 33.2 ± 9.7 | 29.4 ± 11.9 | 31.3 ± 10.5 | 29.6 ± 12.3 | 34.7 ± 9.0 | 29.1 ± 11.9 |
| Serum creatinine (mg/dl) | 0.81 ± 0.20 | 0.88 ± 0.25 | 0.94 ± 0.13 | 1.04 ± 0.26 | 0.70 ± 0.18b | 0.75 ± 0.12d |
| text-decoration:underline | ||||||
| Spine BMD (g/cm2) | 1.0 ± 0.1 | 1.0 ± 0.1 | 1.0 ± 0.1 | 1.0 ± 0.1 | 1.0 ± 0.2 | 1.0 ± 0.1 |
| Spine T‐score | −0.7 ± 1.6 | −0.6 ± 0.9 | −0.6 ± 1.1 | −0.8 ± 0.8 | −0.7 ± 1.4 | −0.5 ± 1.0 |
| Osteopenic | 30 | 28 | 12 | 13 | 18 | 15 |
Data shown as counts or mean ± SD. p values calculated for two‐sided unpaired t tests. Bold font highlights statistical significance compared with the other group.
BMD = bone mineral density; BMI = body mass index; HbA1c = hemoglobin A1c; HDL = high‐density lipoprotein; LDL = low‐density lipoprotein; T2D = Type 2 diabetes.
Statistical significance (p < 0.05) compared with control group.
Statistical significance (p < 0.05) compared with male control group.
Statistical significance (p < 0.05) compared with female control group.
Statistical significance (p < 0.05) compared with male T2D group.
BMI, HbA1c, fasting glucose, and TG were significantly higher in T2D participants than in the control group. Total cholesterol, LDL, and HDL were significantly lower in T2D participants than in the control group. No differences between groups were detected in sex, age, race, calcium or vitamin D levels, spine BMD, or T‐scores. Participants in both groups were on current antilipidemic medication, but the number of participants on current antilipidemic medications was higher in the T2D group. Among these participants on antilipidemic medication, all but two T2D participants used statins. No history of clinical osteoporotic fracture was reported in either group.
In the comparison of the serum lipid levels between sexes, total cholesterol levels were higher in female than male participants within the control group (total cholesterol: p = 0.02; Table 1). HDL levels were higher in female than male participants within both control and T2D groups (HDL: control: p = 0.0004; T2D: p = 0.008). LDL, fasting glucose, and HbA1C were not statistically different between sexes within either control or T2D groups (Table 1).
In the subgroup of participants not using antilipidemic medications (n = 15 T2D and 30 controls), total cholesterol, LDL, and HDL were significantly lower, and TG were significantly higher in T2D participants compared to the control group (Supplemental Table S1). For those participants on antilipidemic medication, a similar pattern was observed, although the differences between T2D and control groups were not statistically significant.
MRS BMAT biomarkers
At the spine, all BMAT biomarkers were significantly lower in male T2D patients compared to male controls in an age‐adjusted model (Table 2A; age‐adjusted TFC: T2D = 76.6 ± 1.2%, control = 81.7 ± 1.4%, p = 0.006; UFC: T2D = 2.6 ± 0.2%, control = 3.4 ± 0.2%, p = 0.004; SFC: T2D = 38.8 ± 1.0%, control = 42.4 ± 1.2%, p = 0.02). To explore the impact of serum lipids on the relationship between T2D and BMAT biomarkers, we added adjustments for LDL and HDL to the model. For male participants, after adjustment for HDL and LDL, associations of T2D with TFC and T2D with UFC were attenuated and no longer statistically significant. No effect was observed on the association of T2D with SFC (Table 2B; age‐, LDL‐, and HDL‐adjusted SFC: T2D = 38.8 ± 1.0%, control = 42.4 ± 1.3%, p = 0.04). For male participants, further adjustment for statin use had little effect on the associations of T2D with BMAT biomarkers. In females, no significant differences in spine BMAT biomarkers were found between participants with T2D and controls.
Spine BMAT composition biomarkers with adjustment for age
| BMAT markers | Male | Female | ||||||||
| Control (n = 16) | T2D (n = 18) | p value | β coefficient | 95% CI of difference | Control (n = 21) | T2D (n = 21) | p value | β coefficient | 95% CI of difference | |
| TFC (%) | 81.7 ± 1.4 | 76.6 ± 1.2 | 0.006 | −5.12 | (−8.76, −1.47) | 81.4 ± 1.7 | 81.0 ± 1.5 | 0.85 | −0.43 | (−4.75, 3.90) |
| UFC (%) | 3.4 ± 0.2 | 2.6 ± 0.2 | 0.004 | −0.74 | (−1.24, −0.24) | 3.1 ± 0.3 | 3.0 ± 0.1 | 0.74 | −0.11 | (−0.78, 0.55) |
| SFC (%) | 42.4 ± 1.2 | 38.8 ± 1.0 | 0.022 | −3.54 | (−6.58, −0.50) | 41.0 ± 1.6 | 42.3 ± 1.2 | 0.52 | 1.28 | (−2.57, 5.12) |
Data shown as adjusted mean ± SE.
BMAT = bone marrow adipose tissue; SFC = saturated fat content; T2D = Type 2 diabetes; TFC = total fat content; UFC = unsaturated fat content.
Spine BMAT composition biomarkers with adjustment for age, HDL, and LDL
| BMAT markers | Male | Female | ||||||||
| Control (n = 16) | T2D (n = 18) | p value | β coefficient | 95% CI of difference | Control (n = 21) | T2D (n = 21) | p‐value | β coefficient | 95% CI of difference | |
| TFC (%) | 81.2 ± 1.7 | 77.0 ± 1.1 | 0.05 | −4.19 | (−8.45, 0.08) | 82.3 ± 1.9 | 80.0 ± 2.0 | 0.48 | −2.24 | (−8.45, 3.98) |
| UFC (%) | 3.2 ± 0.2 | 2.8 ± 0.2 | 0.20 | −0.33 | (−0.84, 0.17) | 2.9 ± 0.2 | 3.2 ± 0.3 | 0.37 | 0.28 | (−0.33, 0.88) |
| SFC (%) | 42.4 ± 1.3 | 38.8 ± 1.0 | 0.04 | −3.55 | (−6.92, −0.17) | 41.6 ± 1.6 | 41.8 ± 1.7 | 0.93 | 0.23 | (−4.97, 5.42) |
Data shown as adjusted mean ± SE.
BMAT = bone marrow adipose tissue; HDL = high‐density lipoprotein; LDL = low‐density lipoprotein; SFC = saturated fat content; T2D = Type 2 diabetes; TFC = total fat content; UFC = unsaturated fat content.
At the tibia, no significant differences were found for any BMAT biomarker comparisons between T2D participants and controls, for either males or females (Supplemental Tables S2 and S3).
Associations between spine serum lipid and BMAT biomarkers
In male T2D participants, significant positive associations of LDL and TC/HDL levels with TFC were found: TFC increased by 2.34% and 1.77% for every 1 SD increase in LDL and TC/HDL, respectively (Table 3).
In female T2D participants, significant negative associations between HDL levels and TFC were found: TFC decreased by 3.23% for every 1 SD increase in HDL.
In male control participants, significant positive associations of TC/HDL and TG levels with SFC were found: SFC increased by 0.87% and 1.34% for every 1 SD increase in TC/HDL and TG (Table 3).
In female control participants, a significant positive association between HDL and SFC and a significant negative association between TC/HDL and SFC were found: SFC increased by 1.77% and decreased by 3.33% for every 1 SD increase in HDL and TC/HDL, respectively.
Additional adjustment for BMI did not change any results of the BMAT biomarker versus lipids analyses (data not shown).
Discussion
In this study, we applied MRS and a novel spectrum fitting technique to quantify marrow adiposity and composition in T2D participants and non‐T2D controls. Lower total fat content as well as lower unsaturated and saturated fat content at the spine was found in T2D participants compared to controls in age‐adjusted models; these differences were significant in men but not in women. In our study cohort, total cholesterol, LDL, and HDL were lower in T2D participants compared to controls. Adjustment for LDL and HDL attenuated the association between T2D status and unsaturated marrow fat but had little effect on the association between T2D and saturated marrow fat. These associations were not affected by statin use. Further analysis confirmed significant associations between serum lipid levels and BMAT biomarkers. Taken together, our results suggest that bone marrow adiposity and composition are influenced by serum lipid levels as well as T2D status, and these relationships are sex‐specific.
Several studies have evaluated bone marrow composition in T2D patients using MRS; however, the methods and results of those previous studies are inconsistent due to differences in sample sizes, cohort demographics, MRS protocols, and BMAT quantification methods. Studies including only females found no differences in marrow adiposity between T2D patients and controls.(13‐15) Those including men or mixed‐sex cohorts reported increased adiposity in T2D.(11,12) In our sex‐stratified analyses, we found no differences in BMAT biomarkers between female T2D patients and female controls, consistent with prior findings. However, in contrast to prior publications, all BMAT biomarkers were significantly lower in male T2D patients than male controls. We hypothesized that the clinical characteristics of our participants contributed to lower BMAT biomarkers in male T2D patients. In particular, serum levels of total cholesterol, LDL, and HDL were significantly lower in our T2D patients than in the controls. Although a greater proportion of T2D patients were receiving antilipidemic medication, we found that lipid levels were lower in the T2D patients even when restricting our analysis to participants who were not on antilipidemic medication. To understand the association of T2D status with BMAT parameters independent of serum lipid levels, we added LDL and HDL to our model and found that this additional adjustment substantially lessened the association of T2D status with UFC. We additionally adjusted for statins, which were used by 62% of T2D participants and only 19% of controls. In this cohort, statin use was associated with T2D status. Statin use is also associated with lower lipid levels. Whether statin use has a direct effect on marrow adiposity is unknown. In our data, statin use did not confound the relationships between T2D status and BMAT biomarkers, as shown in Tables 2A, 2B and 2C, suggesting that statins do not have a direct effect on marrow but only an indirect effect through lipid levels (Supplemental Table S4). However, our study was neither designed nor powered to specifically address this question.
Spine BMAT composition biomarkers with adjustment for age, HDL, LDL, and statin use
| BMAT markers | Male | Female | ||||||||
| Control (n = 16) | T2D (n = 18) | p value | β coefficient | 95% CI of difference | Control (n = 21) | T2D (n = 21) | p value | β coefficient | 95% CI of difference | |
| TFC (%) | 81.4 ± 1.6 | 76.9 ± 1.1 | 0.04 | −4.49 | (−8.70, −0.27) | 82.3 ± 2.0 | 80.0 ± 2.1 | 0.48 | −2.33 | (−8.84, 4.18) |
| UFC (%) | 3.1 ± 0.1 | 2.8 ± 0.2 | 0.21 | −0.31 | (−0.80, 0.17) | 2.9 ± 0.2 | 3.2 ± 0.3 | 0.41 | 0.27 | (−0.37, 0.90) |
| SFC (%) | 42.5 ± 1.2 | 38.8 ± 1.0 | 0.03 | −3.70 | (−7.02, −0.39) | 41.6 ± 1.6 | 41.7 ± 1.7 | 0.98 | 0.08 | (−5.22, 5.38) |
BMAT = bone marrow adipose tissue; HDL = high‐density lipoprotein; LDL = low‐density lipoprotein; SFC = saturated fat content; T2D = Type 2 diabetes; TFC = total fat content; UFC = unsaturated fat content.
Associations between serum lipid levels and BMAT biomarkers
| BMAT biomarkers | ||||
| TFC adjusted for age, statin use | UFC adjusted for age, TFC, statin use | SFC adjusted for age, TFC, statin use | ||
| Male control | TC | 2.333 | −0.038 | 0.789 |
| LDL | 1.811 | −0.058 | 0.813 | |
| HDL | 1.932 | 0.073 | −0.549 | |
| TC/HDL | −0.252 | −0.054 | 0.873* | |
| TG | 0.527 | −0.036 | 1.822** | |
| Male T2D | TC | 2.208 | 0.291 | −1.136 |
| LDL | 2.337* | 0.233 | −0.977 | |
| HDL | −1.946 | 0.304 | −1.494 | |
| TC/HDL | 1.770** | 0.055 | −0.074 | |
| TG | 1.123 | 0.049 | −0.0300 | |
| Female Control | TC | 0.697 | 0.426 | −0.505 |
| LDL | 1.632 | 0.612 | −2.762 | |
| HDL | −0.650 | −0.032 | 1.767** | |
| TC/HDL | 0.934 | 0.090 | −3.328** | |
| TG | 1.138 | 0.146 | −2.108 | |
| Female T2D | TC | −0.464 | 0.176 | 0.484 |
| LDL | 1.029 | 0.132 | 0.644 | |
| HDL | −3.233** | 0.148 | 0.470 | |
| TC/HDL | 3.390 | −0.143 | −0.375 | |
| TG | 2.124 | −0.178 | −1.283 | |
Data shown as standardized beta coefficients in linear regression models, which describes change in outcome (BMAT biomarker; %) for one SD increase in predictor (serum lipid level).
HDL = high‐density lipoprotein; LDL = low‐density lipoprotein; SFC = saturated fat content; TC = total cholesterol; TFC = total fat content; TG = triglycerides; UFC = unsaturated fat content.
p < 0.05.
p < 0.01.
Hyperlipidemia has been proposed to be mechanistically related to alterations in marrow adiposity and bone density. Hyperlipidemia promotes marrow adipogenesis through the activation of PPARγ.(21) Preferential differentiation of common precursor cells toward the adipocyte lineage may reduce osteoblastogenesis, thereby decreasing bone quality. In addition to inhibiting osteoblast differentiation, LDL may increase osteoclast differentiation and activity, while HDL may help to alleviate these effects.(28‐30) Therefore, high cholesterol, in particular high LDL, can cause imbalance in the regulation of bone formation and resorption, resulting in bone quality decrease.(31,32) While no previous data exist on the relationship between serum lipid levels and marrow adiposity in humans with T2D, Slade et al. reported a positive association between serum cholesterol level and marrow adiposity in humans with T1D.(22) This correlation has also been documented in people without diabetes.(23) Our results demonstrate significant associations of serum lipids with BMAT biomarkers of marrow adiposity in T2D. Specifically we found (1) in the male T2D group, significant positive associations of LDL and TC/HDL levels with total marrow fat content and (2) in the female T2D group, a significant negative association between HDL and total marrow fat content. These findings support a proposed mechanistic model whereby increased LDL and decreased HDL both contribute to increased marrow adiposity, which in turn results in decreased osteoblastogenesis, increased osteoclastogenesis, and reduced bone quality. A significant association between LDL and marrow adiposity was not found in female T2D patients, suggesting that the major factor causing T2D pathological bone quality reduction may be different between sexes. In contrast to these findings in the T2D patients, in female controls we found a significant positive association between HDL and saturated fat content. This contradictory finding could suggest that T2D disrupts healthy relationships between lipid levels and marrow adipose composition. Further investigation is required to clarify this.
Compared to previously published marrow adipose composition results, total fat content values for the participants of this study were relatively high. A possible reason for higher TFC in our study is the advanced age of our cohort (50 to 70 years old), which correlates with higher marrow fat.(25) In addition, participant BMD was low with a high proportion of osteopenic T‐scores, which also correlates with higher marrow adiposity. Finally, comparison of marrow adiposity values among studies using varying MRS acquisition and analysis protocols is problematic. Point resolved spectroscopy (PRESS) MRS acquisition mode was widely used in previously published research, which differs from the STEAM acquisition used in this study. The shift to STEAM acquisition was motivated by research documenting that fat quantification is inconsistent using PRESS acquisition.(33,34) Further, differences in analytic approaches, including model fitting and variable definitions, may influence the absolute values of fat content calculated in each study.
MRS at the tibia showed no significant differences in BMAT outcomes between T2D and control participants. However, significant concerns about data quality at the tibial spectroscopy site limit the interpretability of these results. Compared to the spine, tibia bone marrow has higher adiposity, and therefore the water peak of the tibia spectrum is relatively small compared to the olefinic peaks. This will introduce errors because the fitting technique requires accurate water peak data. In addition, the width of olefinic peaks in the tibia spectra were smaller than in the vertebral spectra. These factors contributed to poor peak fitting performance in the tibia (Supplemental Figure S1). Further improvement of MRS acquisition and quantification techniques is necessary to increase the accuracy of peak fitting at the tibia; we do not recommend using current techniques for the analysis of marrow composition at the tibia.
This study has several strengths. It is the largest study to date reporting marrow adiposity in both male and female participants with T2D and the first study to report sex‐stratified results and show sex‐specific associations between T2D status and BMAT markers of adiposity and composition. The study is also the first to assess associations between serum lipids and BMAT markers in T2D, which may be key to a mechanistic understanding of the impact of T2D on marrow adiposity and bone health. However, the study also has several limitations. First, the cross‐sectional study design limited our ability to determine causality. Second, while larger than any previous report of BMAT parameters in T2D men and women, the sample size was modest. Third, we did not include other potentially important clinical factors like adjudicated fracture history or T2D duration in our statistical models. The study design and small sample size prohibited these additional analyses. Finally, our participants had a relatively short T2D duration and well‐controlled disease and therefore may not represent the high fracture risk T2D population in general. Instead, our results may be representative of associations among T2D status, serum lipid levels, and bone marrow adiposity composition in early‐stage diabetic bone disease.
In conclusion, we utilized MRS to quantify marrow adiposity in participants with T2D and in normoglycemic controls. In males, the quantitative spine BMAT biomarkers total, unsaturated, and saturated fat content were lower in T2D participants. In females, no differences in BMAT biomarkers were detected based on T2D status. Adjustment for LDL and HDL attenuated the association of T2D status with unsaturated marrow adiposity in males. Further analysis demonstrated significant and sex‐specific associations between serum lipid levels and BMAT biomarkers. Taken together, our results suggest that bone marrow adiposity alterations in T2D are sex‐specific and dependent on serum lipid levels.
Author Contributions
Po‐hung Wu: Methodology; formal analysis; visualization; writing – original draft; writing – review and editing. Gabby Joseph: Formal analysis. Isra Saeed: Data curation. Amir M. Pirmoazen: Data curation. Katie Kenny: Data curation. Tiffany Y. Kim: Writing – review and editing. Anne L. Schafer: Writing – review and editing. Ann V. Schwartz: Conceptualization; writing – review and editing. Xiaojuan Li: Methodology; software. Thomas M. Link: Conceptualization; supervision. Galateia J. Kazakia: Funding acquisition; project administration; supervision; conceptualization; methodology; writing – review and editing.
Acknowledgments
The authors would like to thank Thelma Munoz for recruiting participants and Vahid Ravanfar and Heather Daniel for MRS scanning. This study was supported by the funding of the National Institutes of Health (NIH): NIH/NIAMS R01 AR069670, NIH/NIAMS R01 AR076159, NIH/NIAMS P30 AR075055 and NIH/NIDDK NORC P30 DK098722, as well as the funding of UCSF Academic Senate Committee on Research.
Data Availability Statement
The data that support the findings of this study are available from the corresponding author upon reasonable request.
