


Abstract
Postnatally, severe vitamin D deficiency commonly results in rickets as well as potential defects in tooth mineralization. The effects of milder deficiency on oral health outcomes later in life are still unclear. This study used micro–computed tomography (μCT), energy dispersive X‐ray analysis (EDX), and Raman spectroscopy to investigate mineral density, total density, and elemental composition of enamel and dentine in 63 exfoliated primary incisors from participants with known 25‐hydroxyvitamin D levels (25‐OHD) at birth. No differences in mineralization and chemical composition using μCT and EDX analysis were observed irrespective of 25‐OHD status. Subtle structural differences were observed via Raman spectroscopy, with more crystalline enamel observed in those with sufficient 25‐OHD at birth. Although subtle, the differences seen suggest further attention should be given to children with known milder levels of vitamin D deficiency in early life. © 2023 The Authors. Journal of Bone and Mineral Research published by Wiley Periodicals LLC on behalf of American Society for Bone and Mineral Research (ASBMR).
Introduction
Although fetal vitamin D and calcitriol play a less prominent role in fetal mineral metabolism, in postnatal life, vitamin D and parathyroid hormone become increasingly important in the regulation of calcium metabolism and mineralization.[1,2,] This is important, because vitamin D deficiency as measured by 25‐hydroxyvitamin D (25‐OHD) status is common with rates up to 48% in mothers during pregnancy (fetal‐maternal correlation coefficient 0.8–0.9),[2,] and 76% in infants up to 5 months of age.[3‐5,] Although severe deficiency can cause the mineralization defects of rickets in children and osteomalacia in adults,[6,] the impact of milder degrees of deficiency perinatally and in early childhood remain largely unknown and are subject to considerable debate.[7,8]
Because teeth are an easily accessible potential proxy for bone health, they may allow a unique opportunity to investigate the more subtle potential mineralization defects associated with 25‐OHD deficiency in early life.[9,10,] This is particularly so as initial mineralization of primary teeth begins from the fourth month of intrauterine life, and for the permanent dentition from birth, and is complete by mid‐childhood for most children.[9,11‐13] Enamel by weight is a 96% inorganic structure made up mostly of calcium (Ca) and phosphate (PO43−) in the form of hydroxyapatite.[14,15] The remaining components consist of water, proteins, and plasma.
Investigations into dental development and health also carry importance given poor oral health is a major public health problem, with strong links between poor oral health and subsequent wider health outcomes and quality of life.[16,17,] However, dental health is complex and dynamic over the lifespan, with many factors contributing to dental well‐being. Importantly, for studies examining developmental enamel formation and mineralization, once mineralization is complete, developmental hypomineralization and/or hypoplastic defects can no longer occur. However, post eruption, demineralization can occur, and topical exposure to fluoride, calcium and phosphate in the saliva can promote homeostasis through surface mineralization, and this continues throughout life. However, post‐eruptive damage does not alter the underlying hydroxyapatite structure laid down during dental development.[10,14,18]
Multiple instruments can be used to assess the mineral density and elemental composition of teeth. micro–computed tomography (μCT) is a nondestructive and noninvasive X‐ray technique that can be used to assess mineral density of tooth tissues.[19,] Energy dispersive X‐ray analysis (EDX) coupled with a scanning electron microscope (SEM) can be used to map and qualitatively/quantitatively analyze several elements within a dental sample, providing information on the concentration of elements such as calcium and phosphorous.[20,] Raman spectroscopy is a rapid and nondestructive technique that can identify compositional differences in the organic and inorganic components of a tooth, based on vibrational modes of specific protein, carbonate, and phosphate molecules.[21,22,] When coupled with microscopic setups, chemical information can be obtained from specific areas and yield insight into compositional changes observed in normal and anomalous dental tissues.[21,23‐26] Low‐frequency Raman (LFR) spectroscopy further adds to the information gained with its ability to detect intermolecular vibrations which are sensitive to the crystal organization.[25,27,28]
This study aimed to investigate the relationship between infant cord blood 25‐OHD, as a marker of perinatal/early infancy status, on mineral density, elemental and chemical composition of enamel and dentine of exfoliated primary teeth, using μCT, EDX, and Raman spectroscopy analyses.
Materials and Methods
This study analyzed 63 exfoliated lower primary central incisors collected from a subset of 63 children who were previously enrolled in an observational study undertaken by co‐author Wheeler et al.[3,] and a subsequent follow‐up dental study at age 6 years.[29,30,] For investigation of 25‐OHD status, placental cord blood 25‐OHD levels were assessed using isotope‐dilution liquid chromatography (LC)–tandem mass spectrometry (MS) as fully described in the previous trial,[7,] and preceding longitudinal study.[3,] Vitamin D sufficiency, insufficiency, and deficiency were defined as serum 25‐OHD concentrations of >50 nmol/L, 30–50 nmol/L, and <30 nmol/L, respectively, as per established guidelines.[31]
Institutional review board and informed consent statement
The study was conducted according to the guidelines of the Declaration of Helsinki, and approved by the University of Otago Human Ethics Committee (Health), New Zealand, 31 January 2018, Reference number H18/001. Informed consent/assent was obtained from all parent and child participants involved with the study.
μCT scanning
Exfoliated teeth were cleaned with ethanol and μCT scanned alongside phantoms of known density which allows the estimation of mineral concentration and total density of enamel and dentine.[32,] Samples were scanned using a Skyscan 1172 Micro‐CT desktop system, and X‐rays were generated at 100 kV, 100 μA, and 10 W.[19] After reconstruction, greyscale levels were measured with a region of interest (ROI) of 20×20 pixels in three locations in enamel, and in inner and outer dentine using Skyscan CTAn (CTAn, version 1.5.0; Skyscan, Aartselaar, Belgium). Reconstructed μCT volumes consisted of virtual slices with 17‐μm resolution, and greyscale levels were measured every 10 slices.
Following μCT scanning, teeth were embedded in epoxy resin and sectioned buccal‐lingually in two halves with a MOD13 diamond‐wafered blade in a Accutom‐50 high‐speed saw (Struers, Copenhagen, Denmark) under water irrigation. The cut surfaces were polished in a TegraPol‐21 polisher (Struers) with SiC paper (1200–4000 grit) and ultrasonically cleaned in water. One half of each sample was used for EDX analysis, and the other half for Raman spectroscopy.[20]
EDX
Following 10‐nm surface carbon coating (Q150T Quantum), elemental maps for the distribution of major elements in the enamel, outer dentine and inner dentine were determined using a Zeiss Sigma VP FEG‐SEM (Carl Zeiss Inc, Oberkochen, Germany). The analytical settings used were 15 kV accelerating voltage, 120 μm aperture size, 8.5 mm working distance, and magnification of ×75. A Cobalt standard was used to calibrate the instrument. Elemental maps were produced showing the distribution of major and minor elements in hydroxyapatite (phosphorus pentoxide [P2O5], calcium oxide [CaO], fluorine, chlorine, sodium, magnesium, and strontium) in selected areas consisting of enamel, and outer and inner dentine.[20] Areas containing impurities and cracks were avoided. Maps were obtained on the labial surface of all specimens at pulp horn tip height. Scanning time was set to 10 min for each sample. Data was processed using Aztec software (Oxford Instruments NanoAnalysis, Oxfordshire, UK).
LFR spectroscopy
Raman spectra were collected using a custom‐built system described previously.[25] Data were collected in a line mapping arrangement where samples were mounted on a three‐axis stage comprised of three UTS100CC linear motorized platforms (Newport Corp. Irvine, CA, USA) and an ESP301‐3G 3‐axis controller (Newport Corp.). Spectra for Raman line maps were collected over the selected areas for the sectioned dental samples with a point‐by‐point arrangement using a 2‐μm step size and 15‐mW laser power. Each spectrum was averaged from 15 scans with an integration time of 1 s for each scan. Data were collected toward the upper side of the samples, to exclude the pulp region from the analysis.
Spectral analysis was carried out using SpectraGryph 1.2.14,[33,] The Unscrambler X 10.4 (CAMO, Oslo, Norway) and Orange Canvas 3.17 (University of Ljubljana, Ljubljana, Slovenia).[34,] Peak ratio analysis was used to identify the dentine‐enamel junction (DEJ) zone, the dentine and enamel domains, and guide the selection of 100 representative spectra for each of the dental domains. Twenty‐seven dental samples were evenly separated in three groups relative to their 25‐OHD levels: deficient (≤30 mmol/L), insufficient (30–50 mmol/L), and sufficient (≥50 mmol/L). Principal component analysis (PCA) was conducted across enamel, dentine and DEJ domains using similar methods to those previously described.[25,35,] Each of these domains then underwent subsequent classification model development using partial least squares–discriminant analysis (PLS‐DA) and support vector machines (SVM).[35‐37] An in‐depth description of the Raman analysis process is described in Supporting Information S1.
Statistical analysis and data management
25‐OHD levels at birth were compared with mean mineral density and total density, and CaO and P2O5 wt% in enamel and dentine at outer (below DEJ) and inner (near pulp) dentine locations. Raman spectra from different zones of the teeth (enamel, dentine and the enamel‐dentine junction) were used to develop predictive classification models (PLS‐DA and SVM classification) using birth 25‐OHD levels.
Data were processed and analyzed using StataSE Version 17.0 software. Descriptive statistics were produced, and distributions checked. Nonparametric Kruskal‐Wallis and Mann‐Whitney tests were used to test for statistical significance between groups. Scatterplots were used to visualize gradients between 25‐OHD levels versus (i) mineral and total density, and (ii) calcium oxide and phosphorus pentoxide concentrations in tooth tissues. Linear regression modeling was used to investigate whether these continuous outcomes were associated with 25‐OHD concentrations. Differences with p < 0.05 were deemed statistically significant.
Results
Characteristics of study participants
There were 63 participants in the study (see Table 1), with a similar percentage of males (49%) and females (51%), and most identified as NZ European (92%). There was an even representation of participants who were 25‐OHD deficient (33%), insufficient (37%), and sufficient (30%). 25‐OHD concentrations ranged from 13.9 nmol/L to 98.8 nmol/L. Two participants received non‐fluoridated drinking “tank” water in the first 6 years of life, while the remaining relied on reticulated water supplies with fluoride adjusted up to 1 ppm. None of the donated primary incisors had clinically evident qualitative diffuse hypomineralization opacities (typical presentation for fluorosis), or quantitative hypoplastic defects, and none had active carious lesions.
Participant Characteristics by 25 Hydroxy‐Vitamin D Status at Birth
| Characteristics | Deficienta n (%) | Insufficienta n (%) | Sufficienta n (%) | Total (col %) |
| Total (row %) | 21 (33) | 23 (37) | 19 (30) | 63 (100) |
| Sex | ||||
| Male | 9 (43) | 10 (43) | 12 (63) | 31 (49) |
| Female | 12 (57) | 13 (57) | 7 (37) | 32 (51) |
| Ethnicity | ||||
| NZ European | 20 (95) | 19 (82) | 19 (100) | 58 (92) |
| NZ Māori | 1 (5) | 3 (13) | 0 (0) | 4 (6) |
| Other | 0 (0) | 1 (4) | 0 (0) | 1 (2) |
| 25‐OHD | ||||
| nmol/L, mean (SD) | 22.1 (4.7) | 40.2 (6.5) | 66.4 (14.5) | 42.1 (20.0) |
| nmol/L, range | 13.9 to 29.1 | 30.4 to 50 | 50.4 to 98.8 | 13.9 to 98.8 |
25 Hydroxy‐vitamin D groups categorized as deficient <30 nmol/L, insufficient 30–50 nmol/L, sufficient >50 nmol/L.
μCT analyses
Potential associations between mineral and total density of enamel, inner dentine, and outer dentine, and cord blood 25‐OHD levels were explored using scatterplot graphs and linear regression modeling (Fig. 1A,B). A large amount of scatter of values was present across all tissue types, and r2 values ranging from 0.011 to 0.045 were observed. A fitted linear regression line showed a slight positive gradient in mineral density across the three tooth tissues (enamel, inner and outer dentine) with higher 25‐OHD levels, and this was more obvious in enamel, although not statistically significant (p ≥ 0.05). No statistically significant differences were observed among 25‐OHD deficiency, insufficiency, and sufficiency groups.
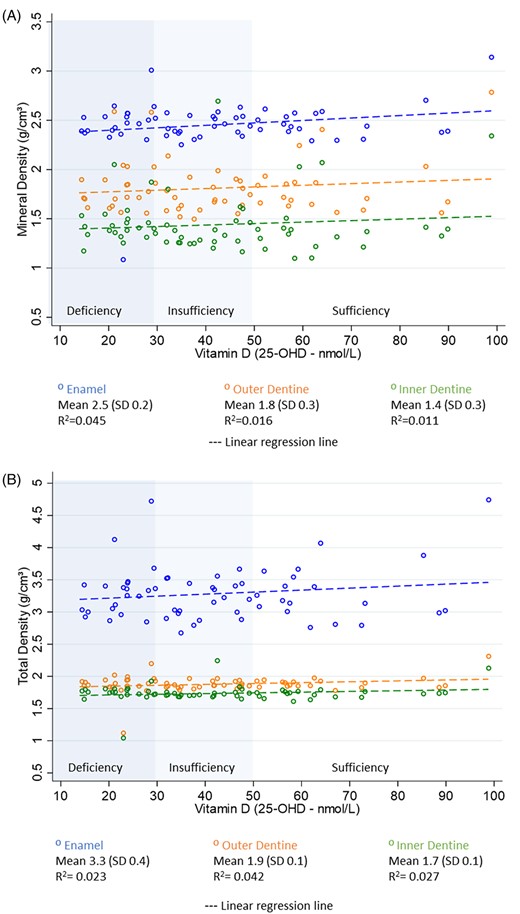
Scatterplots with linear regression line. (A) Mineral density by 25‐OHD levels at birth. (B) Total density by 25‐OHD levels at birth.
Overall, mean mineral density (MD) and total density (TD) were highest in enamel (MD 2.45 g/cm3 SD 0.23; TD 3.28 g/cm3 SD 0.41), followed by outer dentine (MD 1.81 g/cm3 SD 0.26; TD 1.88 g/cm3 SD 0.13) and inner dentine (MD 1.43 g/cm3 SD 0.20; TD 1.7 g/cm3 SD 0.13). The mineral density value was observed in enamel, with one sample classified as deficient in 25‐OHD at birth having an MD of 1.08 g/cm3. The participant with the highest 25‐OHD concentration (98.8 nmol/L) also had the highest mineral density in enamel (3.16 g/cm3), outer dentine (2.34 g/cm3), and inner dentine (2.25 g/cm3). Less scatter of values was observed for total density in both outer and inner dentine, and no associations were apparent.
EDX analysis
Mean CaO wt% in enamel, outer dentine, and inner dentine was 53.81 (SD 1.56), 51.40 (SD 3.12), and 51.18 (SD 3.12), respectively; and mean P2O5 wt % was 44.39 (SD 1.5), 43.84 (SD 2.9), and 44.4 (SD 2.3), respectively (Fig. 2A,B). Four samples with the lowest CaO (<45 wt%) and P2O5 (<40 wt%) in enamel and outer dentine were from participants classified as either 25‐OHD deficient or insufficient (<50 nmol/L) at birth; however, in general, CaO wt% in outer and inner dentine did not change in relation to 25‐OHD levels. No participants who were sufficient in 25‐OHD (>50nmo/L) had CaO wt% below 47%, or P2O5 wt% below 45% in any of the tooth location areas. Linear regression did not identify significant differences in either CaO wt% or P2O5 wt% in enamel, outer dentine, or inner dentine by 25‐OHD at birth.
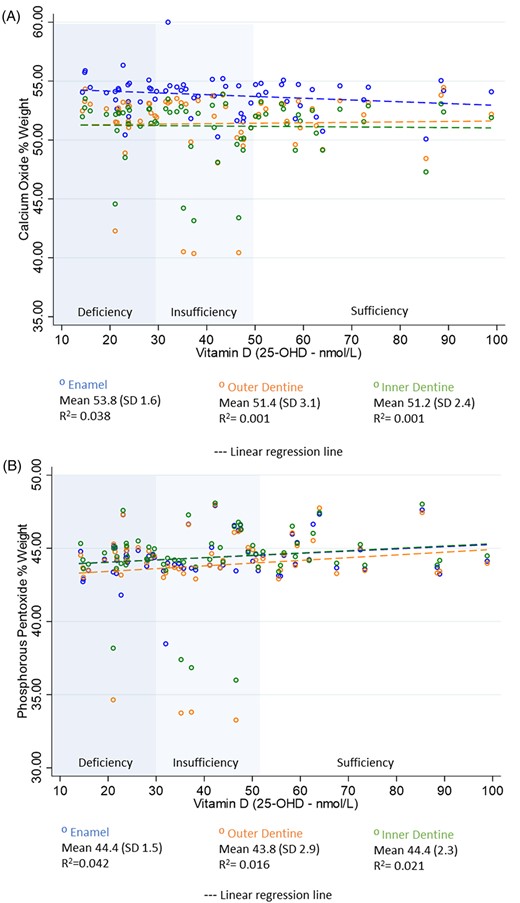
Scatterplots with linear regression line. (A) Calcium oxide wt% by 25‐OHD levels at birth. (B) Phosphorous pentoxide wt% by 25‐OHD levels at birth.
Raman spectroscopy
Representative Raman spectra for various characteristic dental domains are shown in Fig. 3. In the LFR domain (<300 cm−1), the differences were represented as changes in the appearance/shape of the broad vibrational density of states (VDOS) feature that is indicative of structural order and disorder.[27,] Dentine included a substantial amount of protein and organic material within its matrix as indicated by the amide I and III bands at ~1655 and ~1260 cm−1, and deformation band at ~1450 cm−1, respectively.[24]
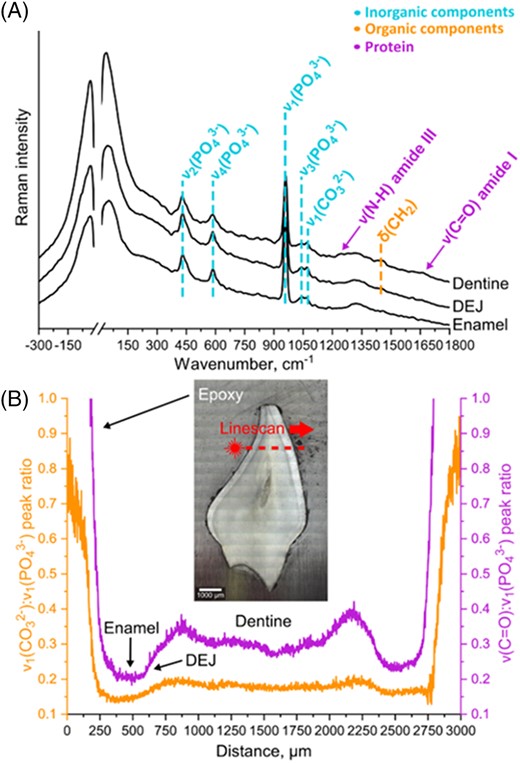
(A) Representative Raman spectra of different dental domains and (B) subsequent peak ratio analysis of linescan data collected for a specific dental sample. The sample photo represents a visual reference for the area that was analyzed during the LFR line measurements with a step size of 2 μm.
Using peak ratio analysis, it was possible to identify the dentine‐enamel junction (DEJ) zone, the dentine and enamel domains. Each of these domains was subject to multivariate analysis, and full details are available in Supporting Information 2 (S2). In summary, samples from participants who had sufficient 25‐OHD at birth appeared to have more crystalline enamel than those with insufficient or deficient 25‐OHD levels.
A PLS‐DA model for sufficient versus deficient or insufficient 25‐OHD is shown in Fig. 4. Participants with sufficient 25‐OHD levels were differentiated from the deficient and insufficient samples, and this was evident by the comparison of statistical parameters across all PLS‐DA models that displayed suboptimal characteristics for the other groups, with deficient and insufficient groups tending to misclassify as each other Tables S2.1–S2.2 (S2).
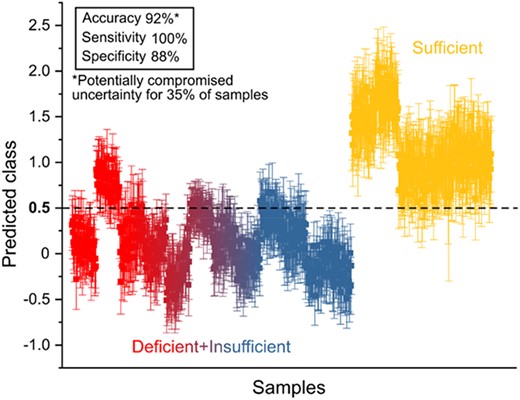
PLS‐DA model for enamel domains showing discrimination of test‐set samples with sufficient levels of vitamin D from rest of the data.
The use of linear and nonlinear kernel two‐class SVM models showed an ability to classify the data for identification of teeth associated with sufficient levels of 25‐OHD, with test set accuracy, sensitivity, and specificity of over 80%, 67%, and 63%, respectively; which were far greater than for the other sample groups.
PLS‐DA was used to develop multivariate classification models to correlate cord blood classifications against the spectral signatures from the associated tooth samples. The accuracy, sensitivity, and specificity of the individual models are presented in Table 2. Accuracy in the enamel domain between those who were categorized as sufficient in 25‐OHD at birth, and those who were insufficient or deficient was 92%.
Model Performance for the Discrimination of different Dental Samples Relative to their Vitamin D metaData using PLS‐DA.
| Dental domains | ||||||||||||||||||
| PLS‐DA model | Enamel | Dentine‐enamel junction (DEJ) | Dentine | |||||||||||||||
| Accuracy % | Sensitivity % | Specificity % | Accuracy % | Sensitivity % | Specificity % | Accuracy % | Sensitivity % | Specificity % | ||||||||||
| Ma | Tb | M | T | M | T | M | T | M | T | M | T | M | T | M | T | M | T | |
| Sufficient vs. others | 88 | 92 (0.35)c | 72 | 100 | 96 | 88 | 88 | 90 (0.60) | 74 | 93 | 95 | 89 | 88 | 91 (0.53) | 73 | 100 | 96 | 87 |
| Insufficient vs. others | 83 | 56 (0.82) | 72 | 27 | 88 | 71 | 83 | 45 (0.81) | 73 | 24 | 88 | 55 | 83 | 41 (0.66) | 72 | 2 | 89 | 61 |
| Deficient vs. others | 88 | 58 (0.51) | 79 | 45 | 93 | 64 | 82 | 53 (0.59) | 67 | 4 | 89 | 78 | 86 | 47 (0.61) | 76 | 3 | 90 | 69 |
Abbreviations: M, model data; T, training set data.
Model or training set data.
Test set data.
Ratio of the samples with potentially compromised uncertainty for the predicted values of the test set relative to the criteria for distinguishing certain class.
The optimum number of latent factors was selected based on the rational inspection of the loadings plots as well as full cross‐validation results. In all scenarios, six factors were necessary to resolve all meaningful spectral variance. PLS‐DA for more than two classes requires sequential approach (i.e., “one against all” strategy), where each model is evaluated separately.
The multi‐class SVM models Figures (S2.1–S2.5) showed poorer performance than the PLS‐DA (accuracy 92%), with SVM accuracy being close to random distribution (33%) and not exceeding 56%. So that while there was a greater disparity for teeth linked to sufficient levels of 25‐OHD when compared to other samples, in general, the findings from SVM models were not reliable.
Discussion
This study investigated the relationship between cord blood 25‐OHD levels and mineral density, total density, and elemental composition of enamel and dentine in primary incisors using μCT, EDX, and Raman spectroscopy. No associations were identified when analyzing mineral density, total density, and elemental composition data in relation to 25‐OHD concentrations. Although EDX analysis did not identify associations between elemental composition and 25‐OHD, samples with the four lowest CaO (<45 wt%) and P2O5 (<40 wt%) wt% were from participants classified as either 25‐OHD–deficient or 25‐OHD–insufficient at birth, and no participants who were sufficient in 25‐OHD had low CaO or P2O5 wt% in any of the tooth location areas. Raman spectroscopy analysis identified that samples from participants with sufficient 25‐OHD levels showed structural differences when compared with those classified as insufficient or deficient at birth. The differences were subtle but appear to be associated with the hydroxyapatite component, with slightly higher crystallinity in samples with sufficient 25‐OHD at birth.
Severe 25‐OHD deficiency during early life can result in rickets and dental defects including enamel hypoplasia.[38‐41,] However, the consequences of lesser degrees of deficiency perinatally and in early childhood are less well understood. The lack of additional evidence has led to considerable debate and lack of clarity around the importance of maintaining normal 25‐OHD levels during pregnancy, lactation, and early childhood. These life stages are interconnected as infant cord and maternal 25‐OHD status are highly correlated and vitamin D is poorly secreted into breast milk and as previously described; large maternal doses of vitamin D are required in lactating mothers to achieve adequate 25‐OHD status in their infants.[7,42]
It is unclear what defines a minimally important difference in elemental composition, mineral density and cord blood 25‐OHD levels, as there have been few studies that have had access to exfoliated teeth from participants, as well as 25‐OHD levels at birth. Post‐hoc analysis of trial data does support a role for vitamin D in dental health, with associations seen between high‐dose perinatal vitamin D supplementation and reduced developmental enamel defects,[43,] in addition to data on bone mineral density, and tooth mineralization defects in rarer forms of rickets.[44,45,] Numerous studies have investigated severe 25‐OHD deficiency and its relationship with tooth mineralization defects. However, this present study was unique in that perinatal 25‐OHD status from cord blood had been recorded and data were available. This is important because the enamel of primary teeth is mineralizing during pregnancy and shortly following birth.[46,] This appears to be the first study to use μCT, EDX, and Raman spectroscopy to investigate the effects of 25‐OHD deficiency on tooth mineralization, as most previous studies have relied on clinical observations to characterize the mineralization status of teeth.[39,] Many studies have identified clinically that those with insufficient vitamin D have an increased risk of dental caries.[29,47,48] It is possible that there is an association between decreased enamel integrity and crystallinity in those with low 25‐OHD at birth, and a higher caries risk. This potential association needs to be investigated further.
The changes in crystallinity identified using Raman spectroscopy were most easily observed in the enamel and dentine‐enamel junction (DEJ) domains. The PLS‐DA analysis (Fig. S2.5) shows that the main phosphate band (960 cm−1) was broader and somewhat shifted in the samples classified insufficient or deficient pointing to a reduced crystallinity in the hydroxyapatite.[28,49‐56] Furthermore, the low wavenumber bands (<30 cm−1), attributed to disorder in the apatite structure, were more intense and the bands associated with crystallinity (130 and 240 cm−1) were weaker.[28,56,] These spectral differences are more easily detected in enamel and DEJ over dentine because of the higher mineral levels in these tissues.[9,14,15]
Mineral density values between tissues were consistent with what is expected, with other studies reporting enamel MD ranging from 2.3 and 2.8 g/cm3.[57‐61,] Determining whether data for each tissue type are within expected parameters for mineral density or chemical structure of a tooth is complex, as there is a high range of natural variation between individuals. Mean mineral density and concentration values can differ considerably depending on many factors, including (but not limited to) tooth type, location, age of the tooth, presence of dental caries or enamel defects, whether the tooth is primary or permanent, and instruments used.[62,63,] What is understood, however, is that mineral density, CaO wt% and P2O5 wt% decrease from outer enamel to dentine. A study by Cuy et al.[64] used nanoindentation mapping of human molar teeth, and identified a mean CaO wt% of 51.73% in outer enamel and 43.83% in dentine, and mean P2O5 wt% of 40.96% in outer enamel, and 34.99% in dentine. For primary incisors in this study, mean CaO wt% and P2O5 wt% within enamel and dentine were within the expected range, except for four samples with CaO <45 wt% and P2O5 < 40 wt% in enamel and outer dentine regions. These samples were from participants classified as either 25‐OHD–deficient or 25‐OHD–insufficient (<50 nmol/L) at birth; however, no statistically significant differences were observed.
It is important to consider the strengths and limitations of this study. Primary lower central incisors were utilized in this study, as they were the first teeth to exfoliate, and therefore were readily available. The enamel of primary second molars, along with first permanent molars and permanent incisors begins to mineralize from birth, which aligns with the cord blood 25‐OHD concentrations previously reported in this cohort.[3,46,] Approximately 5%–6% of New Zealand children present with clinically evident mineralization defects in the enamel of the primary second molars, and are at increased risk of having affected first permanent molars and/or incisors.[46,65] Future research that investigates exfoliated primary second molars in relation to cord 25‐OHD concentrations may be useful.
The use of laboratory tools to analyze human dental tissues has become more common, and understanding the limitations of these instruments is important when deciding which are most appropriate for a study. Because μCT is a nondestructive technique, analysis using other destructive laboratory techniques can still occur with the same specimen. μCT is useful for relaying information on mineral and total density of a tissue; however, it does not provide in‐depth analysis of chemical composition. On the other hand, EDX has detection limits for bulk materials at around 0.1 wt%, and therefore cannot detect trace elements.[66] In this study, the investigators focused on the major components of calcium oxide and phosphorous pentoxide estimations only. Other minor components such as fluorine, sodium oxide, chlorine, magnesium, and strontium were not investigated. Most members of this cohort relied on reticulated water supplies with fluoride adjusted up to 1 ppm in the first 6 years of life. All participants were using a fluoridated toothpaste from the eruption of their first tooth, and while this would have had a topical effect, would not have resulted in changes in enamel composition. None of the donated primary incisor teeth showed evidence of having fluorosis, and this was to be expected as enamel formation for these teeth was completed in the months following birth.
Although EDX analysis is only able to detect inorganic components in the samples, Raman spectroscopy can also identify changes in organic constituents such as proteins and collagen, as well as providing insight into the inorganic constituents and crystallinity of the tissues.[21‐25] A main strength of this study is the availability of 25‐OHD levels at birth, and the use of all three laboratory techniques to enable a comprehensive analysis of tooth samples.
Our study showed subtle apparent structural differences between different sample types in regard to 25‐OHD levels using Raman spectroscopy, with enamel of higher crystalline content observed in the group with sufficient 25‐OHD at birth. Further exploration with a larger sample size may help strengthen the case for vitamin D supplementation during pregnancy to improve bone development and the quality of dental enamel in children.
Conclusion
μCT and EDX analyses did not detect differences in mineralization or chemical composition related to participants' 25‐OHD levels at birth. Raman spectroscopy did reveal subtle structural differences between different sample types, with enamel with a more crystalline content observed in the group with sufficient 25‐OHD at birth. This difference was best exemplified in the enamel and dentine‐enamel junction domains, and although subtle, the differences seen using Raman spectroscopy suggest further attention needs to be given to the potential effects of milder degrees of 25‐OHD deficiency in early life on dental enamel development. Future research using exfoliated primary second molars would be of interest. These teeth have similar mineralization times to permanent first molars and incisors, are known to be more susceptible to mineralization defects, and may provide further information on the effects of different levels of 25‐OHD at birth on tooth development.
Author Contributions
DM Beckett: Conceptualization; investigation; funding acquisition; writing – original draft; methodology; writing – review and editing; formal analysis; project administration; data curation; visualization; validation. S Vaz Viegas: Investigation; writing – review and editing; formal analysis; methodology; validation. JM Broadbent: Investigation; methodology; writing – review and editing; formal analysis; project administration; data curation; supervision. BJ Wheeler: Conceptualization; investigation; supervision; project administration; writing – review and editing; funding acquisition; visualization. K Bērziņš: Investigation; writing – review and editing; methodology; formal analysis; data curation; visualization; validation. S.J Fraser‐Miller: Investigation; writing – review and editing; formal analysis; visualization; methodology; validation; data curation. K.C. Gordon: Investigation; methodology; validation; visualization; writing – review and editing; formal analysis. BK Drummond: Conceptualization; funding acquisition; investigation; methodology; writing – review and editing; project administration. EK Mahoney: Investigation; validation; writing – review and editing; project administration. C Loch: Conceptualization; investigation; funding acquisition; methodology; validation; visualization; writing – review and editing; project administration; supervision; data curation; formal analysis.
Acknowledgments
We acknowledge the participants who donated an exfoliated primary tooth, and their parents, as well as funding from the Otago Medical Research Foundation (Laurenson Award LA383) and the Healthcare Otago Charitable Trust. Thanks are also extended to OMNI (University of Otago) for technical assistance and facilities for Micro‐CT imaging and EDX testing. Open access publishing facilitated by University of Otago, as part of the Wiley ‐ University of Otago agreement via the Council of Australian University Librarians.
Disclosures
The authors declare no conflicts of interest.
Peer Review
The peer review history for this article is available at https://www.webofscience.com/api/gateway/wos/peer-review/10.1002/jbmr.4928.
Data Availability Statement
The data that support the findings of this study are available on request from the corresponding author. The data are not publicly available due to privacy or ethical restrictions.
