


ABSTRACT
As epigenetic regulators of gene expression, circulating micro‐RiboNucleic Acids (miRNAs) have been described in several bone diseases as potential prognostic markers. The aim of our study was to identify circulating miRNAs potentially associated with the severity of osteogenesis imperfecta (OI) in three steps. We have screened by RNA sequencing for the miRNAs that were differentially expressed in sera of a small group of OI patients versus controls and then conducted a validation phase by RT‐qPCR analysis of sera of a larger patient population. In the first phase of miROI, we found 79 miRNAs that were significantly differentially expressed. We therefore selected 19 of them as the most relevant. In the second phase, we were able to validate the significant overexpression of 8 miRNAs in the larger OI group. Finally, we looked for a relationship between the level of variation of the validated miRNAs and the clinical characteristics of OI. We found a significant difference in the expression of two microRNAs in those patients with dentinogenesis imperfecta. After reviewing the literature, we found 6 of the 8 miRNAs already known to have a direct action on bone homeostasis. Furthermore, the use of a miRNA‐gene interaction prediction model revealed a 100% probability of interaction between 2 of the 8 confirmed miRNAs and COL1A1 and/or COL1A2. This is the first study to establish the miRNA signature in OI, showing a significant modification of miRNA expression potentially involved in the regulation of genes involved in the physiopathology of OI. © 2023 The Authors. Journal of Bone and Mineral Research published by Wiley Periodicals LLC on behalf of American Society for Bone and Mineral Research (ASBMR).
Introduction
Osteogenesis imperfecta (OI) is a heterogeneous group of rare hereditary connective tissue diseases that cause bone matrix damage, leading to fragility and deformity.[1,2,] The prevalence of the disease is estimated to be 1 in 10,000. It is the most common hereditary connective tissue disorder.[3,4,] In about 85% of affected patients, OI is due to one or more pathogenic variants in one of the two genes encoding the α1 and α2 chains of type 1 procollagen, COL1A1, and COL1A2, respectively. Their mode of inheritance is autosomal dominant. This results in either the decrease in type 1 collagen synthesis or the structure deterioration, leading to quantitative or qualitative defects in type 1 collagen. It seems that quantitative damage is associated with the least severe OI, whereas qualitative damage is preferentially associated with the most debilitating forms of OI. The position of the mutation in the nucleotide chain is also an important factor, with less severe damage when the mutations are located at the N‐terminal side and more often lethal damage for those located at the C‐terminal.[2,] Finally, there are certain crucial regions, the ligand‐binding regions (MLBRs), for the functional use of collagen in the matrix.[5‐7,] Over the last 15 years, at least 20 novel variant genes responsible for 15% of the remaining cases of OI have been discovered, affecting bone mineralization, posttranslational modifications of type 1 collagen, collagen processing and cross‐linking, and osteoblast differentiation and function. These discoveries have led to the identification of different modes of transmission for these forms of OI, mainly autosomal recessive or more rarely X‐linked.[2,8,9]
Despite the progress made to identify the different types of mutations involved in the disease, the relationship between the types of variants and the severity of the clinical condition remains uncertain. There is a lack of correlation between genetics and the variability of extra‐osseous manifestations of OI that impact the severity and the prognosis, such as deafness, cardiovascular disease, hyperlaxity, scoliosis, dentinogenesis imperfecta, and ophthalmologic impairments.[10,] Gene expression is also strongly modulated by epigenetic regulations, leading to characteristic gene expression profiles linked to clinical outcomes. Changes in the expression of micro‐RiboNucleic Acids (miRNAs), which are endogenous regulators of transcription, may explain, at least partly, phenotypic variability.[11]
MiRNAs are short (18–25 nucleotides), non‐coding, single‐stranded RNAs and key epigenetic regulators of many physiological and pathophysiological processes by regulating gene expression.[11,] It is estimated that more than 60% of human protein‐coding genes have a binding affinity for miRNAs, which is generally conserved in most mammalian species.[12,] In bone, miRNAs have been shown to play an essential role in the regulation of osteoblastogenesis, osteoclastogenesis, mesenchymal stem cell differentiation, and more generally osteogenesis and bone homeostasis.[13,14,] Studying the regulation of miRNA expression and their activity in disease opens the way toward potential therapies by their specific targeting at tissues sites using synthetic small RNAs that mimic or antagonize endogenous miRNAs and restore or inhibit their functions, respectively.[15,16,] Abnormal miRNA level and activity have been consistently reported in bone marrow and matrix, mesenchymal stem cells, osteoblasts, and osteoclasts and in blood‐release of several bone‐related diseases such as osteoporosis, ectopic calcification, fibrous dysplasia of bone, and bone metastasis.[17‐21,] For example, miR‐100 is upregulated in bone tissue and osteoporotic osteoblasts and osteoclasts in osteoporosis.[22]
Such associations of the miRNA levels with the bone‐related gene expression and the clinical presentation of OI would help to decipher the pathophysiological process of the disease. Therefore, we have conducted the miROI study to assess whether certain circulating miRNAs could be dysregulated in OI patients compared with matched controls, whether this dysregulation is involved in the pathophysiology of the disease and might be associated with the disease severity.
Materials and Methods
The study has been conducted in three steps. We first carried out a screening phase by next‐generation sequencing (NGS) to determine the differential expression of all miRNAs in the serum of 10 OI patients and 10 controls subjects. We then performed a validation phase by RT‐qPCR analysis of the miRNAs selected from the screening phase in a larger collection of sera. Finally, we investigated the potential association of the miRNA differential expression and clinicopathological characteristics in our group of OI patients.
Recruitment
OI patients were recruited for the miROI study from October 2019 until October 2021. The recruitment was performed either during hospitalization or during consultation in the reference center for bone diseases at the Edouard Herriot University Hospital in Lyon, France (OSCAR network). Patients had to meet the following inclusion criteria: men and women older than 18 years, carrying a COL1A1 or COL1A2 mutation, with a diagnosis of OI type 1 or type 3 according to the Sillence classification previously established by a rheumatologist expert in bone diseases.[23] Non‐inclusion criteria included long‐term glucocorticoid treatment (>3 months), ongoing anti‐osteoporotic treatment, the presence of inflammatory disease, uncontrolled hypo/hyperthyroidism or hypo/hyperparathyroidism, active cancer in the last 2 years, malabsorption, the presence of benign bone tumors and other bone diseases, pregnancy or breastfeeding, shortcomings in understanding French language that could prevent informed consent, and judicial protection measure. Written informed consent was obtained from each participant. For the screening phase, we recruited 10 OI patients and 48 patients were included in the validation phase.
Controls were healthy individuals matched for age (by 5‐year age group), sex, and body mass index (BMI, by 2 kg/m2 group), recruited from the OFELY, MODAM, and STRAMBO population cohorts at INSERM UMR 1033 (Lyon, France).[24‐27] OFELY (Os des Femmes de Lyon) is a prospective cohort of 1089 healthy women aged 31 to 89 years, recruited in 1992 and 1993 to study the determinants of bone fragility. MODAM (Mother Daughter Microarchitecture) is a case–control study from May 2010 until February 2012. STRAMBO (the Bone Structure of Aging Men) is a cohort of 1169 healthy men between 20 and 85 years old, recruited between 2006 and 2016 in Lyon. The participant distribution and the study design are displayed in Figure 1.
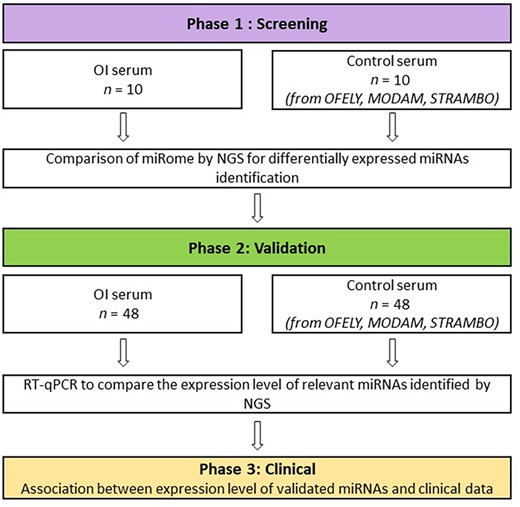
Flowchart of the miROI study. The initial screening phase identified potential miRNAs that were quantified in larger groups of subjects in the validation phase to investigate the potential associations of circulating miRNAs with the disease phenotype in the clinical phase.
The study was approved by a French ethics committee (CPP Ile‐de‐France VI, registration N°2019‐A00521‐56) and conducted in accordance with the French national ethical directives and with the ethical standards of the revised Helsinki Declaration. It was registered on ClinicalTrials.gov (NCT T04009733).
Blood sample collection
Blood samples were preferentially collected in the morning after an overnight fast, centrifuged at 2000g at 4°C within 1 hour of collection for serum preparation, aliquoted, and stored at −80°C until analysis. Macroscopic visual analysis of the blood samples was performed to assess the quality of the serum, including the presence of hemolysis and fibrin clotting.
Collection of clinical and biological data
Clinical information was collected both by a clinical questionnaire filled in by the physician with the patient and by a SF‐36 quality‐of‐life questionnaire completed by the patient herself/himself.[28] Patients’ clinical data were obtained from their standardized electronic medical records (from 2009 to today, DPI Easily). The Sillence Classification and the assessment of the disease severity were made by a rheumatologist of the reference center for rare bone diseases.
The analysis of OI miRNome by next‐generation sequencing
The screening phase was performed to compare the serum miRNA profile (miRNome) between OI patients and control subjects. For this purpose, we carried out the miRNome analysis in serum of 10 OI patients versus 10 matched controls by NGS after total RNA extraction, library preparation, and quantification, followed by the miRNA sequencing (Illumina [San Diego, CA, USA] platform; Qiagen Genomic Services, Germantown, MD, USA). Total RNA (5 μL) extracted from serum by the miRNeasy serum/plasma kit (Qiagen) was used for the preparation of miRNA‐NGS libraries, by the QIAseq miRNA library kit (Qiagen). First, a ligation was performed on the mature miRNA to add an adaptor polyA sequence to the 3′‐OH end followed by ligation of an adaptor sequence to 5′‐PO4 end by an ATP ligase. Mature single‐stranded miRNAs containing a specific nucleotide sequence, the unique molecular index (UMI), were obtained. A reverse transcription (RT) reaction generated the cDNA containing the UMI, which allowed the library identification after sequencing. After amplification by a 22‐cycle PCR, the cDNA was incubated with QMN beads (QIAseq miRNA NGS beads), washed, and eluted from the beads by RNase/DNase‐free water. Each library was then amplified using the Qiaseq miRNA index kit. Before this, a fraction enriched in miRNAs was isolated by agarose gel electrophoresis and subjected to quality control on the Bioanalyzer 2100 (Agilent, Santa Clara, CA, USA). After a final quantification by PCR, the libraries obtained from the different samples were pooled at equimolar concentration to generate the clusters on the flow cell surface before sequencing on a NextSeq500 sequencer (Illumina). The data collected in the form of “reads” were subjected to read quality control and corrected for library amplification bias before alignment with the mature miRNA sequences referenced in miRBase‐20 and with the GRCh38 human genome.[29‐32] After demultiplexing the raw reads, the data were expressed as count. The data were normalized by dividing the count of a specific miRNA by the total count number in a sample and multiplied by 106 and then by the trimmed mean of M‐values (TMM) methods. The expression level of the miRNAs was expressed in TPMs (tags per million reads) and then compared by the ratio of TPMs between the groups. This ratio was then transformed into relative data by calculating the Log2(Fold change) (LogFC).
The analysis of miRNAs by RT‐qPCR
Total RNA was extracted from 200 μL of serum with the Nucleospin miRNA plasma kit (Macherey‐Nagel, Düren, Germany) according to the manufacturer's recommendations. Samples were thawed on ice and centrifuged at 3000g for 5 minutes. Lysis buffer containing 1 μL of glycogen as RNA carrier and a synthetic spike‐in control RNA (cel‐miR‐39‐3p) as exogenous control were added to the serum (4 μL of 0.1 nmol/L dilution). After cell lysis, protein precipitation, and washes, RNA was eluted from a silica microcolumn with 40 μL of water without RNAse/DNAse and stored at −80°C. The miRNAs were quantified using the TaqMan Advanced miRNA technology (Applied Biosystems, Thermo Fisher Scientific, Waltham, MA, USA). Quantification of miRNAs expressed at low copy number was improved by 14 cycles of cDNA amplification in a 2X TaqMan PreAmp master mix containing Megaplex PreAmp primers. The miRNAs were subjected to RT to prepare cDNA from 2 μL of total RNA using a TaqMan Advanced miRNA synthesis kit. The qPCR amplification was performed on 1:20 dilution of cDNA obtained by miRNA‐Amplification reaction on 5 μL of the RT samples, using the 2X Fast Advanced Master Mix and the 20X TaqMan Advanced miRNA Assays. The miRNAs were then amplified for quantification using TaqMan Low Density MicroRNA Arrays (TLDA) cards and TaqMan Fast Advanced Mastermix (Applied Biosystems, Thermo Fisher Scientific). The TLDAs were designed for real‐time PCR quantification of 23 miRNAs (19 candidate miRNAs, three endogenous controls [let‐7a‐5p, miR‐222‐3p and miR‐361‐5p] and the exogenous control cel‐miR‐39‐3p) on a QuantStudio 7 flex (Applied Biosystems). The threshold cycle (CT) value was recorded as the cycle number at which the fluorescence generated within a reaction crosses the fluorescence threshold, a fluorescent signal significantly greater than the ROX fluorescence background recorded in each sample. We used Expression Suite software (Applied Biosystems) to express the miRNA level as relative quantification (RQ). The CT values of each miRNA were normalized by the average of the expression level of the three endogenous miRNAs (let7a‐5p, miR‐222‐3p, and miR‐361‐5p) that are ubiquitously expressed and are not related to bone and joint tissue metabolism. RQ was calculated as 2−ΔΔCT, with ΔCT = (CT of miRNA − average CT of the three endogenous controls) and ΔΔCT = (ΔCT of miRNA − average ΔCT of miRNA over all samples) and converted to fold change (FC) = log2(2−ΔΔΔCT). The exogenous spike‐in cel‐miR‐39‐3p was used as quality control for qPCR.[33] In addition, we used 96‐well plates with primers specific to the miRNAs tested (Taqman advanced miRNA assay) after each extraction, RT and pre‐amplification, in order to control the quality of these steps and guarantee the quality of the analysis. For this purpose, before each TLDA analysis, we performed a 96‐well plate analysis with 7 miRNAs, including 2 endogenous control miRNAs, the exogenous control, and 4 target miRNAs with different expression levels.
Statistical analysis
Controls were matched to patients for age, sex, and BMI. The NGS step and differential expression analysis of circulating miRNAs were performed by Qiagen using the EdgeR software package. Differential expression was assessed for each gene using an exact test analogous to Fisher's exact test but adapted for overdispersed data.[34] Relative quantification for RT‐qPCR was calculated with Expression‐Suite Software. The characteristics of patients and controls were expressed as mean ± SD for the continuous variables and number (%) for the qualitative variables. The search for a significant difference in characteristics between the two groups was done by Wilcoxon–Mann–Whitney test. The p values were corrected for the false discovery rate (FDR) by the Benjamini–Hochberg method. In the second phase, n > 30, Anderson‐Darling and Shapiro tests and compatible distribution curves indicated that the approximation to the normal distribution was correct. Therefore, Student's t test was used to analyze the significance of the difference in serum miRNA levels between patients and controls. The p values were corrected for the FDR by the Benjamini–Hochberg method and were considered significant for values <0.05. Subgroup analyses according to molecular type, resulting in smaller numbers, were conducted with a nonparametric Mann–Whitney test. Association of the miRNA levels with the severity of the disease was evaluated with a Mann–Whitney rank sum test for qualitative data. We tested for a correlation between miRNA expression levels and clinical characteristics using Pearson's r for continuous data and Spearman's r for ordinal data.
All the analyses, graphics, and figures were performed using GraphPad Prism version 8.0.0 for Windows (GraphPad Software, San Diego, CA, USA, http://www.graphpad.com).
Results
Screening phase: identification of differentially expressed circulating miRNAs in OI by NGS analysis
Population characteristics
The characteristics of the 10 OI patients (5 men, 5 women) and 10 controls (5 men, 5 women) are presented in Supplemental Table S1. There was no significant difference in BMI, but the patients were significantly shorter and lighter than the controls.
Comparison of the expression levels of circulating miRNAs in OI patients and control subjects by NGS
Among a total of 1297 miRNAs quantified in 10 OI and 10 control patients, NGS identified 79 miRNAs that were significantly differentially expressed between the OI and control groups, with a Benjamini–Hochberg FDR‐adjusted probability <0.05 (Supplemental Table S2). Of these miRNAs, 19 were downregulated and 60 were overexpressed in the OI group compared with the control group. Twenty‐seven among these 79 miRNAs had an FDR‐corrected p value <5 × 10⁻⁴ (Fig. 2).
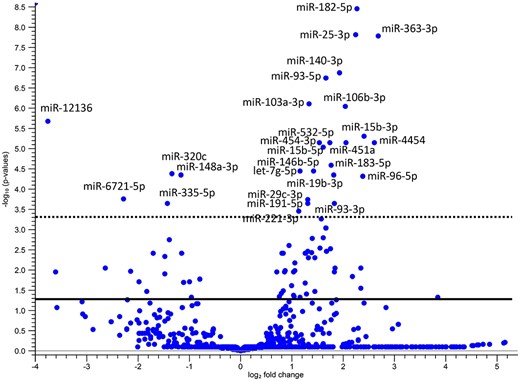
Volcano plot showing the significant variations in miRNA expression between the control and osteogenesis imperfecta (OI) groups. The expression level of miRNAs was compared between groups by the ratio of tag per million and transformed into relative data by calculating the log2 fold change. The ‐log10 change in false discovery rate (FDR)‐corrected p values were plotted against the log2 fold change. The continuous line is the FDR‐corrected p value threshold equal to 0.05 and the discontinuous line to 0.0005. The miRNAs with p < 0.0005 have been captioned.
We have selected 19 miRNAs for the validation phase by retaining the miRNAs with the highest level of statistical significance and with the highest expression level (RT‐qPCR being technically less sensitive than NGS) (Supplemental Table S3). The candidate miRNAs for validation are presented in Table 1.
The Differential Expression of the 19 miRNAs Selected After the miRNome NGS Analysis
| Name | Max group means | Log2 fold change | p Value | FDR p value |
| hsa‐miR‐182‐5p | 1925.6 | 2.27 | 2.768E−12 | 3.591E−09 |
| hsa‐miR‐25‐3p | 37874.2 | 2.25 | 2.420E−11 | 1.569E−08 |
| hsa‐miR‐363‐3p | 735.8 | 2.68 | 3.885E−11 | 1.679E−08 |
| hsa‐miR‐140‐3p | 4722.9 | 1.93 | 4.241E−10 | 1.375E−07 |
| hsa‐miR‐93‐5p | 14405.8 | 1.66 | 7.060E−10 | 1.831E−07 |
| hsa‐miR‐103a‐3p | 6820.2 | 1.34 | 3.638E−09 | 7.865E−07 |
| hsa‐miR‐106b‐3p | 1646.5 | 2.04 | 4.982E−09 | 9.231E−07 |
| hsa‐miR‐451a | 23413.2 | 2.06 | 7.029E−08 | 7.366E−06 |
| hsa‐miR‐15b‐5p | 1225.4 | 1.62 | 1.018E−07 | 9.435E−06 |
| hsa‐miR‐183‐5p | 1373.3 | 1.78 | 3.064E−07 | 2.649E−05 |
| hsa‐let‐7 g‐5p | 4683.5 | 1.16 | 4.848E−07 | 3.699E−05 |
| hsa‐miR‐148a‐3p | 2542 | −1.16 | 6.970E−07 | 4.542E−05 |
| hsa‐miR‐19b‐3p | 1929.8 | 1.82 | 7.003E−07 | 4.542E−05 |
| hsa‐miR‐96‐5p | 576 | 2.39 | 7.833E−07 | 4.838E−05 |
| hsa‐miR‐29c‐3p | 1802.5 | 1.32 | 3.227E−06 | 1.820E−04 |
| hsa‐miR‐191‐5p | 18039.4 | 1.32 | 4.195E−06 | 2.267E−04 |
| hsa‐miR‐335‐5p | 175.2 | −1.42 | 4.571E−06 | 2.306E−04 |
| hsa‐miR‐93‐3p | 261.5 | 1.83 | 4.625E−06 | 2.307E−04 |
| hsa‐miR‐221‐3p | 1935.4 | 1.13 | 7.381E−06 | 3.546E−04 |
Note: The group mean difference is expressed as tag per million; the log2 fold change is the relative miRNA level in osteogenesis imperfecta patients versus control subjects.
Abbreviations: FDR = false discovery rate; NGS = next‐generation sequencing.
Validation phase: differential expression of circulating miRNAs by RT‐qPCR
Population characteristics
For the validation phase of candidate miRNAs, 48 additional patients with OI and 48 controls matched for age, sex, and BMI were involved. Among them, 45 had type 1 OI and 3 had type 3 OI. Mean age was 43 years old. We noted a lower weight and height for OI patients compared with controls, which is consistent with the classical morphology of OI patients. A median of 17 previous fractures was observed in the OI patients, with a predominance of wrist, elbow, tibia, and vertebral fractures (approximately 30% prevalence for each item) and 61% had previously received bisphosphonates. Interestingly, 55% were above secondary school level in education compared with 34% for the whole French population in 2014, according to French government figures.[35,] All patient characteristics are presented in Table 2. For a better understanding of the potential epigenetic regulation according to the OI molecular subtype, we have sorted the OI patients with molecular type 1 and molecular types 3–4. Patients with a suspected structural collagen deficiency caused by a mutation resulting in a premature stop codon were considered as type 1 OI. The patients presenting a supposed qualitative collagen defect in connection with a mutation involving an amino acid substitution were considered as OI type 3 and 4 (12/15 patients involved on substitution by a glycine) (Supplemental Table S4). For mutations involving splice sites, we conducted predictions using the translation tool from http://www.expasy.org, as well as splice site prediction algorithms including SpliceSiteFinder, MaxEntScan, NNSPLICE, and GeneSplicer. The results were reviewed by a geneticist (CC) to determine the occurrence of a stop codon, frame shift, exon skipping, or intron translation. Based on these outcomes, splice site mutations were categorized as either quantitative or structural anomalies (Supplemental Table S5).[36‐40] It has to be noted that one patient was excluded from this analysis because of the lack of mutation type in his record.
Baseline Characteristics of Patients and Controls for the Validation Phase
| Characteristics | OI | Controls (n = 48) | ||
| Whole OI population (n = 48) | Quantitative defect of collagen (n = 29)a | Structural defect of collagen (n = 18)b | ||
| Age (years), median (Min; Max) | 45.5 (19; 77) | 47 (20; 77) | 40.5 (19; 64) | 43 (19; 76) |
| Female, n (%) | 25 (52) | 14 (48) | 10 (55) | 25 (52) |
| Height, Median (Min; Max) | 1.60 (0.95; 1.82)* | 1.64 (1.43; 1.82) | 1.57 (0.95; 1.72)* | 1.68 (1.49; 1.89) |
| Weight (kg), Median (Min; Max) | 61 (29; 95)* | 62 (44; 95) | 58,5 (29; 84) | 66.5 (44; 110) |
| BMI (kg/m2), Median (Min; Max) | 23.7 (17.9; 37.8) | 23.7 (19.5; 35.6) | 23.7 (19.5; 35.5) | 22.6 (17.5; 31.3) |
| Postmenopausal status, n (%) | 9 (36) | 6 (21) | 2 (22) | 9 (36) |
| Smoking, n (%) | 12 (25) | 8 (28) | 3 (17) | |
| Sillence classification | ||||
| Type I, n (%) | 45 (94) | 29 (100) | 15 (83) | |
| Type III, n (%) | 3 (6) | 0 (0) | 3 (17) | |
| Patients with rest pain, n (%) | 32 (67) | 18 (62) | 12 (80) | |
| VAS, Median (Min; Max) | 3 (0; 8) | 3 (0; 8) | 4.5 (0; 8) | |
| Number of fractures, Including severe fractures | 17 (0; 89) | 20 (4; 60) | 13.5 (0; 90) | |
| Median (Min; Max) | 3 (0; 28) | 4 (0; 10) | 3 (0; 30) | |
| Scoliosis, n (%) | 23 (50) | 12 (44) | 10 (56) | |
| Cobb Angle, Median (Min; Max) | 16 (12; 67) | 14 (12; 50) | 25 (13; 67) | |
| Family history of OI, n (%) | 35 (73) | 24 (83) | 11 (61) | |
| Age of diagnosis, Median (Min; Max) | 4.5 (0; 64) | 5 (0; 33) | 2 .5 (0; 64) | |
| Bisphosphonates use, n (%) | 29 (61) | 19 (66) | 10 (55) | |
| Dentinogenesis Imperfecta, n (%) | 14 (29) | 7 (24) | 6 (33) | |
| Deafness, n (%) | 12 (25) | 10 (34) | 2 (11) | |
| T‐score | ||||
| Total Hip, Median (Min; Max) | −1.9 (−6.2; 1.5) | −1.4 (−3.1; 0.5) | −2.3 (−6.2; 1.5) | |
| Femoral Neck, Median (Min; Max) | −1.4 (−3.4; 1.5) | −1.4 (−3.4; 0.1) | −1.5 (−3.4; 1.5) | |
| Lumbar Spine, Median (Min; Max) | −2.1 (−5.2; 0.9) | −2.2 (−4.3; 0.9) | −2.5 (−5.2; 0.1) | |
Note: Bone mineral density measured for femoral neck and total hip and spine (L1 to L4) is expressed as T‐score. The osteogenesis imperfecta (OI) patients were separated into two groups according to the molecular type of OI (mutations responsible for a type 1 collagen defect for OI type 1 or mutations responsible for a structural alteration of the collagen OI type 3 and 4). We compared the data between controls and OI with a p value calculation using a t test for the whole OI population and using a Mann–Whitney test for the mutation subgroups.
Abbreviations: BMI = body mass index; VAS = visual analogue pain scale on 10‐cm line.
Mutations from quantitative defect of collagen group: COL1A1: c.658C > T; c.1081C > T; c.3642delC; c.206delT; c.333 + 3A > T; c.2089 C > T; c.2319_2320insAC; c370‐2A > T; c.495 T > G; c.103 + 5G > C; c.1127delC; c.3715_3716dupAG; c.948delT; c.1983 + 1G > A; c.1668delT; c.1821 + 1G > A; c.588 + 1G > A; c.2896C > T; c.3026delC.
Mutations from structural defect of collagen group: COL1A1: c.333G > C; c.805G > A; c.599G > T; c.3197G > A; c.3470G > T; c.589‐1G > T; c.2128‐2A > C // COL1A2: c.2539G > A; c.776G > T; c.577G > A; c.1999G > A; c.1801G > A; c.2350G > A; c.2656G > A; c.3282_3290del.
p < 0.05.
Comparison of the expression level of circulating miRNAs in the serum of patients and control subjects in the validation phase
We compared the level of the 19 previously selected circulating miRNAs in 96 individuals (48 OI and 48 controls) by running RT‐qPCR on pre‐spotted TaqMan Low Density Array (TLDA) cards. Among these 19 miRNAs, we found 10 miRNAs that were significantly differentially expressed between the two groups. After correction by the Benjamini–Hochberg method, 8 of them remained significantly different (miR‐106b‐3p, miR‐191‐5p, miR‐363‐3p, miR‐451a, miR‐93‐3p, miR‐93‐5p, let‐7g‐5p, miR‐15b‐5p) (Fig. 3). Only miR‐15b‐5p was underexpressed in the OI group compared with healthy controls; all other miRNAs were overexpressed in OI (Table 3).
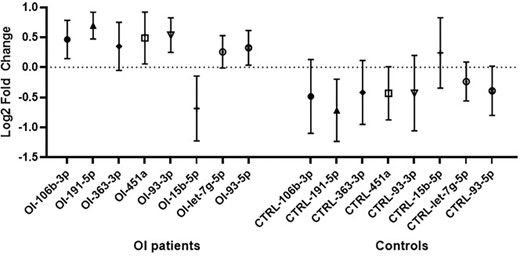
The relative level of the eight miRNAs that were significantly differentially expressed between osteogenesis imperfecta (OI) patients (n = 48) and matched control subjects (n = 48). Data are presented as mean of log2 fold change in OI and control groups and 95% confidence interval. The relative level was measured by RT‐qPCR on pre‐spotted Taqman Low‐Density Array cards.
Comparison of the miRNA Levels (Means) in Serum of Osteogenesis Imperfecta (OI) Patients and Controls
| miRNA | Relative levels in log2 fold change (mean) | 95% confidence interval of difference | p Value | q Value | |
| OI (n = 48) | Controls (n = 48) | ||||
| hsa‐miR‐16‐5p | 0.20 | −0.21 | −0.91 to 0.08 | 0.103 | 0.135 |
| hsa‐miR‐148a‐3p | −0.15 | 0.13 | −0.16 to 0.73 | 0.205 | 0.248 |
| hsa‐miR‐106b‐3p | 0.46 | −0.48 | −1.63 to −0.27 | 0.007* | 0.021* |
| hsa‐miR‐140‐3p | 0.08 | −0.06 | −0.79 to 0.51 | 0.669 | 0.620 |
| hsa‐miR‐182‐5p | 0.03 | −0.08 | −1.15 to 0.92 | 0.831 | 0.721 |
| hsa‐miR‐183‐5p | −0.04 | 0.26 | −0.97 to 1.56 | 0.641 | 0.620 |
| hsa‐miR‐191‐5p | 0.70 | −0.71 | −1.97 to −0.85 | <0.001* | 0.001* |
| hsa‐miR‐221‐3p | 0.27 | −0.24 | −1.04 to 0.016 | 0.057 | 0.081 |
| hsa‐miR‐25‐3p | −0.01 | −0.02 | −0.50 to 0.48 | 0.953 | 0.750 |
| hsa‐miR‐363‐3p | 0.35 | −0.42 | −1.41 to −0.11 | 0.022* | 0.043* |
| hsa‐miR‐451a | 0.49 | −0.43 | −1.53 to −0.31 | 0.003* | 0.019* |
| hsa‐miR‐93‐3p | 0.54 | −0.43 | −1.61 to −0.32 | 0.004* | 0.019* |
| hsa‐miR‐96‐5p | −0.23 | 0.23 | −0.30 to 1.21 | 0.233 | 0.262 |
| hsa‐miR‐103a‐3p | 0.53 | −0.46 | −1.97 to −0.01 | 0.047* | 0.075 |
| hsa‐miR‐19b‐3p | 0.35 | −0.32 | −1.32 to −0.01 | 0.048* | 0.075 |
| hsa‐miR‐15b‐5p | −0.69 | 0.24 | 0.14 to 1.71 | 0.022* | 0.042* |
| hsa‐miR‐335‐5p | 0.19 | −0.12 | −0.83 to 0.22 | 0.250 | 0.262 |
| hsa‐let‐7g‐5p | 0.26 | −0.24 | −0.91 to −0.08 | 0.021* | 0.043* |
| hsa‐miR‐29c‐3p | 0.03 | −0.01 | −0.54 to 0.46 | 0.870 | 0.721 |
| hsa‐miR‐93‐5p | 0.33 | −0.39 | −1.21 to −0.22 | 0.005* | 0.020* |
Note: The circulating levels of 19 selected miRNAs were analyzed by RT‐qPCR in 48 sera of OI patients and 48 sera of controls. Results are log2 fold change of miRNA expression level in OI sera versus control sera, after normalization and relative level expression. The p value is corrected by false discovery rate (FDR) according Benjamini–Hochberg method (q value).
Values of p or FDR p < .05.
Concerning the comparison of the expression level according to the molecular type of OI, among the 19 selected miRNAs, 6 of them that were previously dysregulated in the whole OI population (miR‐106b‐3p, miR‐191‐5p, miR‐363‐3p, miR‐451a, miR‐19b‐3p, miR‐93‐5p) remained significantly increased in OI patients with quantitative defect of collagen. In the group with structural defect of collagen, 2 miRNAs remained significantly upregulated (miR‐191‐5p, miR‐451a) with miR‐93‐5p and miR‐93‐3p showing a strong trend without reaching statistical significance (p = 0.06).
The expression level of let‐7g‐5p that was increased in the whole population (p < 0.043) did not remain significantly different after sorting the population, either in the quantitative group or in the structural group (Table 4).
Comparison of the miRNA Levels (Median) in Serum of Osteogenesis Imperfecta (OI) Patients and Controls
| miRNA | Quantitative defect of collagen (n = 29) | Structural defect of collagen (n = 18) | ||
| Median of relative levels difference (95% confidence interval [CI] of difference) | p Value | Median of relative levels difference (95% CI of difference) | p Value | |
| hsa‐miR‐16‐5p | 0.31 (−0.30 to 1.10) | 0.277 | 0.38 (−0.32 to 1.31) | 0.235 |
| hsa‐miR‐148a‐3p | −0.17 (−0.89 to 0.20) | 0.241 | 0.07 (− 0.62 to 0.82) | 0.919 |
| hsa‐miR‐106b‐3p | 0.81 (0.17 to 1.63) | 0.018* | 0.62 (−0.25 to 1.39) | 0.149 |
| hsa‐miR‐140‐3p | 0.12 (−0.60 to 0.79) | 0.832 | 0.48 (−0.67 to 1.06) | 0.667 |
| hsa‐miR‐182‐5p | 0.87 (−0.89 to 1.53) | 0.630 | 0.81 (−1.22 to 1.85) | 0.981 |
| hsa‐miR‐183‐5p | −0.27 (− 1.53 to 1.62) | 0.928 | −0.99 (−2.76 to 1.53) | 0.552 |
| hsa‐miR‐191‐5p | 1.19 (0.38 to 2.02) | 0.002* | 1.29 (0.74 to 1.73) | 0.001* |
| hsa‐miR‐221‐3p | 0.33 (−0.26 to 0.86) | 0.270 | 0.43 (−0.40 to 0.87) | 0.563 |
| hsa‐miR‐25‐3p | 0.26 (−0.44 to 0.92) | 0.524 | −0.33 (−0.88 to 0.50) | 0.737 |
| hsa‐miR‐363‐3p | 0.55 (−0.03 to 1.67) | 0.041* | 0.32 (−0.41 to 1.36) | 0.463 |
| hsa‐miR‐451a | 0.89 (0.05 to 1.71) | 0.031* | 0.94 (0.03 to 1.94) | 0.048* |
| hsa‐miR‐93‐3p | 0.13 (−0.18 to 1.83) | 0.108 | 1.06 (−0.12 to 2.15) | 0.063 |
| hsa‐miR‐96‐5p | −0.35 (−1.39 to 0.78) | 0.779 | −0.09 (−1.76 to 0.68) | 0.563 |
| hsa‐miR‐103a‐3p | 0.96 (−0.07 to 2.02) | 0.062 | 1.95 (−0.14 to 3.21) | 0.077 |
| hsa‐miR‐19b‐3p | 0.55 (0.08 to 1.93) | 0.024* | 0.22 (−1.01 to 1.15) | 0.944 |
| hsa‐miR‐15b‐5p | −0.53 (−1.65 to 0.00) | 0.052 | −0.64 (−2.12 to 0.54) | 0.189 |
| hsa‐miR‐335‐5p | 0.14 (−0.65 to 0.74) | 0.853 | 0.41 (−0.39 to 1.32) | 0.411 |
| hsa‐let‐7g‐5p | 0.54 (−0.21 to 1.18) | 0.157 | 0.39 (−0.10 to 0.96) | 0.109 |
| hsa‐miR‐29c‐3p | 0.06 (−0.42 to 0.73) | 0.624 | −0.33 (−0.44 to 0.35) | 0.335 |
| hsa‐miR‐93‐5p | 0.73 (0.18 to 1.56) | 0.012* | 0.91 (−0.04 to 1.48) | 0.060 |
Note: The circulating levels of 19 selected miRNAs were analyzed by RT‐qPCR in 47 sera of OI patients and 47 sera of controls. Results are median difference of log2 fold change between controls and OI patients after normalization and relative level expression. Median of the difference in relative levels = Median (OI) − Median (Control).
Clinical phase: association between the MiRNA deregulation and the phenotype and severity of osteogenesis imperfecta
Some phenotypic characteristics are presented in Table 2. We looked for an association between phenotypic characteristics and the circulating level of validated miRNAs in OI patients. Specifically, we investigated whether the differential expression of miRNAs was associated with the number of prevalent severe fractures, hearing impairment, hyperlaxity, practitioner classification of OI severity, Sillence group, and dentinogenesis imperfecta. We found that only the latter was significantly related to the circulating level of ‐miR‐363‐3p and ‐miR‐451a (Table 5). We did not find any significant correlation between the expression level of validated miRNAs and the number of severe fractures. Adjustment for age in a multiple regression model did not alter the results for fractures or hearing impairment. Refining the molecular subgroups to search for associations between the OI phenotype and the miRNA deregulation did not show additional significant correlations. However, there is a weak correlation between the severity of scoliosis assessed by the radiographic measurement of the Cobb angle and miR‐96‐5p (r = −0.442, p = 0.045) and miR‐93‐5p (r = −0.457, p = 0.037).
Association of Osteogenesis Imperfecta (OI) Phenotypic Parameters and Circulating miRNA Levels
| a. Comparison of validated circulating miRNA levels with dentinogenesis imperfecta (DI) status in the OI group | |||
| miRNA name | Median no DI (n = 34) | Median DI (n = 14) | p Value |
| hsa‐miR‐106‐3p | 0.80 | 0.39 | 0.651 |
| hsa‐miR‐191‐5p | 0.79 | 0.75 | 0.349 |
| hsa‐miR‐363‐3p | 0.385 | −0.21 | 0.046* |
| hsa‐miR‐451a | 0.905 | 0.120 | 0.038* |
| hsa‐miR‐93‐3p | 0.64 | 0.28 | 0.626 |
| hsa‐miR‐15b‐5p | −0.43 | −0.65 | 0.949 |
| hsa‐let‐7g‐5p | 0.58 | 0.15 | 0.223 |
| hsa‐miR‐93‐5p | 0.40 | 0.17 | 0.154 |
| b. Comparison of validated circulating miRNA levels with deafness status in the OI group | |||
| miRNA name | Median no deafness (n = 36) | Median deafness (n = 12) | p Value |
| hsa‐miR‐106‐3p | 0.52 | 0.59 | 0.568 |
| hsa‐miR‐191‐5p | 0.99 | 0.75 | 0.406 |
| hsa‐miR‐363‐3p | 0.11 | 0.02 | 0.364 |
| hsa‐miR‐451a | 0.71 | −0.07 | 0.158 |
| hsa‐miR‐93‐3p | 0.48 | 0.22 | 0.393 |
| hsa‐miR‐15b‐5p | −0.50 | −0.92 | 0.930 |
| hsa‐let‐7g‐5p | 0.53 | 0.16 | 0.307 |
| hsa‐miR‐93‐5p | 0.36 | 0.15 | 0.393 |
| c. Comparison of validated circulating miRNA levels with hyperlaxity status in the OI group | |||
| miRNA name | Median no hyperlaxity (n = 28) | Median hyperlaxity (n = 20) | p Value |
| hsa‐miR‐106‐3p | 0.79 | 0.09 | 0.594 |
| hsa‐miR‐191‐5p | 0.86 | 0.77 | 0.386 |
| hsa‐miR‐363‐3p | 0.17 | 0.04 | 0.702 |
| hsa‐miR‐451a | 0.56 | 0.15 | 0.925 |
| hsa‐miR‐93‐3p | 0.53 | 0.25 | 0.306 |
| hsa‐miR‐15b‐5p | −0.53 | −0.57 | 0.799 |
| hsa‐let‐7g‐5p | 0.51 | 0.22 | 0.705 |
| hsa‐miR‐93‐5p | 0.36 | 0.15 | 0.608 |
| d. Comparison of validated circulating miRNA levels with bisphosphonate (BP) status in the OI group | |||
| miRNA name | Median no BP (n = 17) | Median BP (n = 31) | p Value |
| hsa‐miR‐106‐3p | 0.25 | 0.79 | 0.480 |
| hsa‐miR‐191‐5p | 0.74 | 0.85 | 0.795 |
| hsa‐miR‐363‐3p | 0.18 | 0,01 | 0.856 |
| hsa‐miR‐451a | 0.46 | 0.56 | 0.659 |
| hsa‐miR‐93‐3p | 0.28 | 0.37 | 0.616 |
| hsa‐miR‐15b‐5p | 0.01 | −0.69 | 0.268 |
| hsa‐let‐7g‐5p | 0.15 | 0.58 | 0.444 |
| hsa‐miR‐93‐5p | 0.27 | 0.22 | 0.909 |
| e. Comparison of validated circulating miRNA levels with severe fracture status in the OI group | |||
| miRNA name | Median ≤5 fractures OI (n = 30) | Median >5 fractures OI (n = 18) | p Value |
| hsa‐miR‐106‐3p | 0.51 | 0.56 | 0.764 |
| hsa‐miR‐191‐5p | 0.75 | 0.84 | 0.579 |
| hsa‐miR‐363‐3p | 0.13 | 0.06 | 0.858 |
| hsa‐miR‐451a | 0.67 | −0.22 | 0.388 |
| hsa‐miR‐93‐3p | 0.57 | 0.17 | 0.100 |
| hsa‐miR‐15b‐5p | −0.57 | −0.42 | 0.269 |
| hsa‐let‐7g‐5p | 0.52 | 0.15 | 0.641 |
| hsa‐miR‐93‐5p | 0.28 | 0.26 | 0.887 |
Note: The circulating miRNA levels are expressed as log2 fold change. The significance of expression level differences was estimated by Mann–Whitney test. All types of hearing loss (loss of at least 20 dB on standard audiometry) were counted whether transmissive, sensorineural, or mixed. Only fractures of femur, pelvis, proximal tibia, humerus, and spine fractures were considered and included in the severe fracture status.
The association between the MiRNA deregulation and the pathophysiological mechanisms of osteogenesis imperfecta
To address the question of biological regulations of pathogenic variants in OI, we searched for the link between the miRNA differential expression in OI and the molecular mechanism changes in this disease. To this end, we used the miRwalk3 algorithm to predict the potential interaction between a given miRNA and a corresponding gene. It is classically described that the miRNA will then be able to destabilize the mRNA and partially inhibit the initiation of translation.[41,42] Therefore, we looked for an interaction between the validated miRNAs and COL1A1 or COL1A2. Here we found an estimated 100% interaction between hsa‐miR‐106b‐3p and COL1A1 and COL1A2 and between hsa‐miR‐93‐3p and COL1A2.
Discussion
In our case–control study of 48 patients with OI, we have observed differential expression of 8 circulating miRNAs compared with healthy controls. After sorting the OI population according to their collagen mutation, 2 miRNAs remained significantly upregulated in the structural group (miR‐191, miR‐451a), whereas 6 miRNAs were significantly differently expressed in the quantitative group. These data suggest that the miRNA‐induced modulation of biological functions differed according to OI pathological variants. Two of these miRNAs (miR‐106b‐3p and miR‐93‐3p) are potentially directly involved in the pathophysiology of the disease via their predictive interaction with COL1A1 and COL1A2, inducing a further enhanced lower collagen expression. This regulation of collagen levels might be mediated by miR‐106b‐3p in OI patients who have a quantitative collagen defect, as the increase in miR‐106b‐3p in the structural group was not significant, whereas the close‐to‐significant increase of miR‐93‐3p in the structural group could potentially play the same role in structural mutation. By further examining the role of these dysregulated miRNAs in OI, we observed that several of them have been consistently reported as regulators of osteogenesis‐related genes, pointing out changes in pathophysiological pathways that might be induced by OI in bone cells, bone mineralization, and remodeling.[13,15,20,21] Therefore, we searched for associations between circulating level of significantly dysregulated miRNAs in OI patients and their phenotypic characteristics. The overexpression of miR‐363‐3p and miR‐451a was significantly correlated to dentinogenesis imperfecta status, although we have not been able to demonstrate further correlation between expression levels of these miRNAs and other severity criteria (ie, number of fractures, severity in the classification).
The pathophysiology of OI is currently unclear. Specifically, the phenotypic variability of OI remains elusive, especially considering the potential expression of extraskeletal manifestations,[43,] suggesting the existence of other pathways to regulate the gene expression downstream of the mutation, such as miRNAs as epigenetic regulators. In our study, we further support this hypothesis by reporting their potential direct interaction with the mutated genes but also with other pathways in bone pathophysiology. Because of some imperfect complementarity and the small size of seeds, each miRNA influences the regulation of numerous mRNAs with different efficiency. Some miRNAs have several binding sites in a 3′‐UTR sequence, strongly downregulating the targeted gene, and each miRNA is able to interact with hundreds of different 3′‐UTR regions.[12,] This also implies that the target sites of miRNAs are difficult to saturate, thus inducing weak to moderate downstream regulation.[44] Overexpression or inhibition of these miRNAs therefore likely involves multiple unexplored or unknown pathophysiological pathways in OI, making this finding a novel approach to the disease.
We conducted a literature review to search for experimentally validated interaction of the 8 miRNAs with targeted genes involved in bone homeostasis that have been previously described.
We have highlighted the miR‐25/93/106 cluster, located on chromosome 7q.22.1. in MCM7 intron 13. The three miRNAs were significantly upregulated in serum of OI patients in NGS analysis with only miR‐93‐5p, miR‐93‐3p, and miR‐106b‐3p being significantly increased in the larger OI population of the validation phase. MiR‐93‐5p also interacts with Osx and is a well‐known regulator of osteoblastogenesis.[45,46,] As it has been largely previously reported, Osx plays an essential role in bone homeostasis by regulating osteoblastic differentiation and maturation.[47‐49,] This interaction would induce the inhibition of Osx transcription and the increase of miR‐93 in OI patients could participate in a decrease of osteoblast maturation via a maladaptive response of the miR‐93/Osx regulatory loop. The existence of a strong regulation of Osx is consistent with literature data suggesting that a mutation of the latter is responsible for a form of OI with a recessive inheritance.[50,] Moreover, both miR‐93‐5p and miR‐106b‐3p appear to inhibit bone morphogenetic protein 2 (BMP2) expression and inhibit osteoblastogenesis through the repression of osteogenesis.[51,] The work of Zhang and colleagues demonstrated in vitro the interaction between mir‐93 and BMP2. Stimulation of miR‐93 is responsible for a reduction in BMP‐2 expression. The role of BMP‐2 is essential, through its interaction with Runx‐2 and Osterix and as a member of TGF‐β superfamily but is also directly involved in bone homeostasis.[52,] The overexpression of miR‐93 in the OI cohort could lead to a repression of BMP‐2 expression and be responsible for an inhibition of osteoblastic differentiation. MiR‐106b is already known to be an inhibitor of Smad5 and BMP‐2 and thus inhibit osteogenic differentiation.[53,] Moreover, the inhibition of miR‐106b improves osteoblastogenesis and bone density in a mouse model of cortico‐induced osteoporosis.[54,] Our data also suggest that in the quantitative group, the Col1A1/A2 downregulation was further increased as a consequence of the miR‐25/93/106 cluster dysregulation with the main impact of miR‐106b‐3p upregulation, through the direct targeting of Col1A1/2. This molecular mechanism of Col1A1/2 regulation would be restricted to the quantitative group since the miR‐106b‐3p and miR‐93‐3p upregulation did not reach significance in the structural group. The increase approaching significance of miR‐93‐3p could nonetheless suggest that it might have a regulatory role in the structural group, but we lack the power to support it. There is no literature suggesting a regulatory mechanism for this cluster in OI, but we can assume the existence of a direct or indirect negative feedback from type 1 collagen on the expression of miR‐93 and miR‐106b, which would be lifted by silencing of the affected allele not present in the structural form. Further in vitro studies are required to investigate this point. Overall, the regulation of the miR‐106 and miR‐93 gene expression in miR‐106b‐25 cluster in OI may have impacted their expression level as ‐5p/‐3p mature form, which in turn differently target osteogenesis factors. Their release in bloodstream reflecting their alteration in tissues suggests that miR‐106 and miR‐93 are noninvasive biomarkers of the disease. We have previously reported that miR‐25‐3p might be a negative regulator of osteoblastogenesis by downregulating the expression of genes involved in osteoblast differentiation, but it could also reduce osteoclastogenesis by targeting RANKL.[21] Therefore, the role of miR‐25‐3p in the regulation of bone cell–related genes remains to be explored and could be patient‐dependent, explaining the lack of significance observed in the validation phase. The alteration of this cluster's expression involves multiple regulatory pathways in bone and other tissues, strengthening the hypothesis that these miRNAs are regulators of the disease and differ in their activity according to the group of OI patients.
We also reported that miR‐19b‐3p was upregulated in patients with quantitative defect of collagen but not in patients with structural defect. Interestingly, the expression of miR‐19b‐3p that belongs to the miR‐17‐92 cluster is modulated by the PI3K/Akt/mTOR signaling pathway.[55,] Its upregulation promotes osteogenesis by regulating negatively the expression of gene of phosphate and tension homology (PTEN) that increases osteocalcin, osteopontin, and RunX2 and Col1A1 protein levels.[56,57,] MiR‐19b‐3p is upregulated in serum from osteoporotic patients with vertebral fractures and low BMD.[58,59,] Recent studies have demonstrated that the inhibition of miR‐19a/b in osteoporotic rats significantly enhances the effect of parathyroid hormone on osteoformation by relieving the inhibition on TG‐interacting factor 1 and reducing RANKL‐mediated resorption activity.[60] The lack of significance in the structural mutation group suggests that this mechanism is not effective, possibly triggered solely by the quantitative decrease of COL1A1.
The strong overexpression of miR‐191‐5p has been described in response to mechanical strain exerted on osteoblastic cells through the regulation of mRNA with which we again find the interaction with protein level of bone morphogenetic proteins (BMP‐2 and BPM‐4).[61,] MiR‐191 is able to decrease the migration of bone marrow mesenchymal stem cells. Under osteogenic culture conditions of these cells, inhibition of miR‐191 induces bone formation and influences chondrogenesis by directly targeting CCAAT enhancer binding protein.[62] Furthermore, miR‐191 was strongly overexpressed in patients with the structural mutations, whereas we did not find such an overexpression of the previous cluster except for miR‐93‐5p, suggesting an alternative inhibition of osteogenesis in these patients.
In the whole population of OI, the overexpression of miR‐451a and miR‐363‐3p was associated with dentinogenesis imperfecta. This suggests that among the patients of the quantitative group, miR‐363‐3p and miR‐451a overexpression may regulate signaling pathways for the one suffering from dentinogenesis imperfecta and that only miR‐451a may have a function in the dentinogenesis imperfecta of structural group.
The miR‐363‐3p promotes activation of the PTEN/PI3K/AKT pathway, thereby enhancing osteoclastogenesis and inhibiting osteoblatogenesis.[63,] The miR‐451 inhibits BMP‐6 and thereby inhibits osteoblastogenesis.[64,] Its inhibition in a mouse model of osteoporosis induced by ovariectomy allows an improvement in the qualitative and quantitative bone parameters. There is no literature reporting a link between these two miRNAs and dentinogenesis per se, but we can assume that their respective impact on the PTEN and BMP6 pathways may be responsible for dysregulation of dentinogenesis.[65‐67]
The miRNAs let‐7g‐5p and miR‐15b‐5p are less known in bone. Some studies suggest that let‐7g‐5p may participate in osteoblastic differentiation, but the mechanisms are not yet well understood, with a more oncogenic role in extraosseous bone.[68‐71,] MiR‐15b‐5p that was overexpressed in sera of OI patients in miRNome analysis was weakly but significantly downregulated in OI patients in the validation phase (p < 0.042) and did not differ in quantitative and structural groups. MiR‐15b‐5p is known for its dual role in oncogenesis as an oncogene or a tumor suppressor, depending on its dysregulation in various tissue and of its numerous gene targets.[72]
It has not been robustly reported as a key regulator in bone homeostasis despite few studies suggesting a role in promoting or inhibiting osteoblastogenesis.[72,73,] Whereas miR‐15b promotes the differentiation of mesenchymal stem cells and osteoprogenitors into osteoblasts by indirect targeting of RUNX2,[73,] it inhibits osteoblast differentiation and autophagy to aggravate osteoporosis in mice by indirect USP1 targeting.[74] We report an inconsistent response of miR‐15b‐5p expression in OI sera that may result of differences in mutational status.
Another interesting feature highlighted in this study is the overexpression of miR‐191‐5p, which has often been reported as an endogenous control and used for data normalization.[75,76] However, in the miROI study, the NGS screening phase has shown that miR‐191‐5p was significantly overexpressed in OI serum. Because NGS is the only technique that allows the detection of all the miRNAs, including previously non‐identified miRNAs, the level of each miRNA is expressed comparatively to the global amount of miRNAs in the sample as the normalization procedure. This warranted us for reassessment of miR‐191‐5p stability at least in OI. In the validation phase, miR‐191‐5p was found significantly overexpressed in serum of OI when raw data were normalized by three other endogenous controls. This was confirmed when miR‐191‐5p raw data (CT) were normalized with the exogenous spike‐in cel‐miR‐39‐3p (data not shown).
The NGS in the discovery phase 1 showed the overexpression of the three members of the miR‐182/96/183 cluster located in the human chromosome 7q32.2, suggesting their common regulation in the disease. A polycistronic cluster comprises two or more miRNAs transcribed from adjacent loci. Fifty percent of mammalian miRNAs have their loci clustered near other miRNA loci.[12,] They are classically regulated in a synchronous manner. After RT‐qPCR analysis, only the miR‐182‐5p was strongly increased but without reaching statistical significance. This ‐miR‐182/96/183 cluster is involved in the regulation of bone homeostasis and bone‐related disease[21,] by stimulating osteoclastogenesis and inhibiting osteoblastogenesis through the interaction with several targets, notably FoxO1, Heme Oxygenase‐1, or Osterix (Osx).[77‐81] However, this miRNA cluster was not differentially expressed in the validation phase analysis.
The miROI study is the first to examine the link between miRNAs and the severity of osteogenesis imperfecta with a sizeable number of patients for this rare bone disease. Recruitment was carried out in a bone disease reference center with strict inclusion criteria guaranteeing the quality of the data. In addition, the study was built with a serious methodology with analytical screening phase and validation phase, including two different methods of analysis of circulating miRNA levels.
This is the first study reporting an miRNA signature associated with pathophysiological mechanisms in OI with a molecular and a clinical approach. It allows for new ways to explore the physiopathology but also the therapy of the disease.
The management of osteogenesis imperfecta is currently based on surgical management of fractures and deformities, but we lack effective medications. Bisphosphonates remain the primary drug therapy in children.[82,83,] More than 50% of our patients had already received bisphosphonates. However, despite a well‐demonstrated action on bone mineral density and relief of vertebral compression in growing children, it is difficult to demonstrate a real benefit in the management of osteogenesis imperfecta in adults.[84‐87,] The development of other approaches, such as an anti‐sclerostin treatment currently evaluated in phase 3 and another one targeting TGF‐beta, has triggered new hope for treatment,[88,] but there has not been approved treatment to date. MiRNAs seem to be an interesting avenue that is increasingly being explored in different areas of research for targeted treatment. This is particularly true in oncology, where miRNAs are emerging as tumor suppressors with several promising trials underway.[89,90,] It is therefore relevant to consider this approach in bone diseases so our results could form the basis for in vitro and in vivo investigations in this direction especially since some animal model studies in osteoporosis seem to be promising (miR‐106b, miR‐19a/b).[54,60]
However, the miROI study has some limitations. The limited number of patients with type 3 OI does not allow for exploring the concept of severity in this form. The lack of correlation between clinical criteria of severity and miRNA expression levels may be due to lack of power, but our sample size allows for evaluating large effects, which are those clinically relevant. In addition, the exclusion of patients with ongoing treatment for bone disease prevents the inclusion in the study of a subset of the population that might have more severe disease. Possibly, children and adolescents have different types of regulation by miRNAs so that our approach would need a separate study focused on this age range. It should be noted that the interpretation of hearing impairment is complex becaue of the interplay of the several types that were not distinguished in the study, without considering the quantitative aspect, with a possible interaction with age‐related hearing loss and environmental factors. It is also pointed out that the number of fractures, especially the less severe ones, is subject to recall bias. Another limitation is the matching method that we used, for BMI (in addition to age and sex), which may be less suitable for subjects with major deformities or short stature. In addition, all the patients in the exploratory phase were sampled under fasting conditions in the morning, as were all the controls. Some of the OI patients in the validation phase (n = 15) were sampled after a 6‐hour fasting period outside this schedule. This limitation has to be taken into account, despite the standardization process, which should have reduced this influence. Concerning the molecular subgroup analysis (Table 3), a relative similarity of the identified miRNAs was observed between the whole OI group and the “quantitative mutation” group, where the “structural mutation” group identified two miRNAs more specifically (miR‐191‐5p, miR‐451a). However, it is difficult to conclude that these molecular subgroups are the only explanation for the different miRNAs profile because of the loss of power related to the nonparametric statistical test and the marked lower sample size in the structural mutation group.
In conclusion, our study profiled the circulating miRNAs in OI patients and identified eight dysregulated disease‐associated miRNAs that could be used as potential biomarkers of the disease. These miRNAs appear to be involved in pathophysiological mechanisms that directly affect the COL1A1 and COL1A2 mutated genes or other pathways involved in bone homeostasis, especially regulating osteoblastogenesis. This hypothesis needs to be explored by studies on cell and animal models of OI. MiRNAs may represent a promising therapeutic target.
Author Contributions
Alexandre Mercier‐Guery: Conceptualization; methodology; investigation; writing – original draft. Marjorie Millet: Investigation; writing – original draft; data curation; formal analysis. Blandine MERLE: Data curation; formal analysis; project administration. Corinne Collet: Data curation; resources; writing – review and editing. Flora Bagouet: Project administration. Olivier Borel: Investigation. Elisabeth Sornay‐Rendu: Resources; data curation. Pawel Szulc: Data curation; resources. Emmanuelle VIGNOT: Resources. Deborah Gensburger: Resources. Elisabeth Fontanges: Resources. Martine Croset: Methodology; conceptualization; writing – review and editing; writing – original draft; investigation. Roland Chapurlat: Conceptualization; methodology; resources; writing – review and editing; supervision.
Acknowledgments
Thanks to all patients who agreed to participate in the study and to the “Association de l'Ostéogenèse Imparfaite” (the French National Association of Osteogenesis Imperfecta) for their interest in miROI. It should be noted that this article is part of AMG's thesis work.
Funding was provided by INSERM (The National Institute of Health and Medical Research) 1033 department's own funds. The promotion of the study was funded by the University Hospital of Lyon (Hospices Civils de Lyon).
Disclosures
All authors state that they have no conflicts of interest.
Peer Review
The peer review history for this article is available at https://www.webofscience.com/api/gateway/wos/peer-review/10.1002/jbmr.4912.
Data Availability Statement
The data that support the findings of this study are available on request from the corresponding author. The data are not publicly available due to privacy or ethical restrictions.
