


ABSTRACT
Osteocalcin in its undercarboxylated form (ucOC) may influence diabetes risk; however, its relationship with all‐cause and cause‐specific mortality is unclear. Whether other bone turnover markers (BTMs) are associated with mortality risk differently from ucOC also remains uncertain. Our aim was to determine associations of serum ucOC with all‐cause and cause‐specific mortality and compare these with the corresponding associations of serum total osteocalcin (TOC), procollagen type I N‐propeptide (PINP), and collagen type 1 C‐terminal cross‐linked telopeptide (CTX) in older men. We conducted a prospective cohort study of 3871 community‐dwelling men, aged 77.0 ± 3.6 years at baseline, followed for a median of 12.3 years. Exposure variables were ucOC, TOC, PINP, and CTX concentrations assayed in serum. Outcomes were incidence of all deaths and deaths due to cardiovascular disease (CVD) or cancer, ascertained using death registry data. Cox regression analyses adjusted for cardiovascular risk factors and prevalent CVD and for prevalent cancer in analyses of cancer‐related mortality. Higher concentrations of ucOC, PINP, and CTX were associated with all‐cause mortality (hazard ratio [HR] per 1 standard deviation increase: ucOC 1.12, 95% confidence interval [CI] 1.06–1.18, p < 0.001; PINP HR = 1.06, 95% CI 1.01–1.11, p = 0.009; CTX HR = 1.13, 95% CI 1.08–1.19, p < 0.001), but TOC was not associated. Similar results were found after excluding men with an incident fracture during follow‐up. Higher ucOC and CTX were associated with CVD mortality (ucOC HR per 1 SD increase 1.13, 95% CI 1.05–1.22, p = 0.001; CTX HR = 1.12, 95% CI 1.04–1.20, p = 0.003), but this result was not significant in competing risks analysis. Higher CTX was also associated with cancer mortality (HR = 1.12, 95% CI 1.01–1.23, p = 0.024). In conclusion, in older men, higher bone turnover, assessed by BTMs including ucOC, is a biomarker for all‐cause mortality risk. Undercarboxylated osteocalcin was a more informative biomarker for this outcome than TOC. Higher CTX was associated with all‐cause and cancer‐related mortality. Further evaluation of causality and potential underlying mechanisms is warranted. © 2022 The Authors. Journal of Bone and Mineral Research published by Wiley Periodicals LLC on behalf of American Society for Bone and Mineral Research (ASBMR).
Introduction
Experimental studies show the skeleton as an endocrine organ and osteocalcin in its undercarboxylated form (ucOC) as an active hormone that participates in glucose metabolism via a bone‐pancreas endocrine loop.(1‐4) In observational studies, higher ucOC concentrations have been associated with lower fasting plasma glucose, HbA1c, and diabetes risk.(5,6) However, there are inconsistent findings regarding the association between ucOC concentrations and cardiovascular disease (CVD) risk.(7‐9) This conflict may be a result of confounding by natural changes in bone turnover markers (BTMs), including total osteocalcin (TOC) and ucOC, with aging.(10) An increase in bone turnover with age may predispose to reduced bone mineral density and increased risk of fractures, also associated with incident CVD events.(11) Gamma carboxylation of osteocalcin is vitamin K‐dependent, thus higher ucOC concentrations are also found in vitamin K deficiency, which has potential detrimental effects.(12) Warfarin also inhibits gamma carboxylation to affect ucOC concentrations. As such, it is not clear whether higher ucOC concentrations may be associated with beneficial or detrimental outcomes with advancing age.
N‐terminal propeptide of type I procollagen (PINP) and collagen type I C‐terminal cross‐linked telopeptide (CTX) are markers of bone formation and resorption, respectively.(13,14) Higher PINP concentrations have been correlated with frailty in older women.(15) In a study comprising largely frail elderly women, higher PINP concentrations were associated with all‐cause mortality.(16) CTX concentrations have been associated with increased mortality in men undergoing coronary angiography and in postmenopausal women.(17,18) In a study of men aged ≥50 years, low bone mineral density and higher bone resorption rates were associated with mortality.(19) Higher TOC concentrations have been associated with lower abdominal aortic calcification and longer 10‐year survival in older men, but ucOC concentrations were not reported.(20) Therefore, it remains unclear whether BTMs are robust predictors for mortality risk in aging populations and whether associations of ucOC with mortality differ from associations of TOC, PINP, and CTX with mortality to suggest an extended influence of circulating ucOC beyond bone and pancreas.
The aim of this study was to test the hypothesis that serum ucOC concentrations are associated with all‐cause and cause‐specific mortality risk and examine whether this association differs from the associations of TOC, PINP, and CTX concentrations with the same outcomes in a large cohort of community‐dwelling older men.
Participants and Methods
Study participants
The Health in Men Study (HIMS) is a prospective cohort study of community‐dwelling men aged ≥65 years from Perth, Western Australia, randomly selected from the electoral roll (voting is compulsory in Australia) and invited to participate.(21) A total of 12,203 men were assessed in 1996–99 (wave 1). Of 10,940 surviving men, 4248 accepted an invitation to return, were reassessed, and provided a blood sample in 2001–04 (wave 2). Men who provided blood samples in which BTMs were measured represent the cohort of interest. Approximately 95% of participants were of White ethnic origin. The Human Research Ethics Committee of the University of Western Australia approved the study and all participants provided written informed consent.
Exposures
Serum ucOC, TOC, P1NP, and CTX concentrations were measured in samples collected at wave 2.(6,14) Briefly, blood samples were collected between 8:00 a.m. and 10:30 a.m., serum aliquots prepared immediately, and stored at –80°C until assayed. Serum TOC, PINP, and CTX were measured by electrochemiluminescence immunoassay using a Modular E170 analyzer (Roche Diagnostics, North Ryde, Australia). Coefficient of variation (CV) was 3.7% and 2.9% at 18 and 89 μg/L for TOC; 4.0% and 5.7% at 28 and 191 μg/L for PINP; and 4.1% and 3.8% at 0.31 and 0.71 μg/L for CTX. Serum samples were incubated with hydroxyapatite (Calbiochem, MilliporeSigma, Burlington, MA, USA; at an optimized concentration of 5 mg/mL), mixed, and centrifuged to precipitate carboxylated osteocalcin as previously described.(6,14,22) The concentration of ucOC in the supernatant was measured using the same method as for TOC. Using a reference osteocalcin standard with expected fractional hydroxyapatite binding of 0.80 (kindly supplied by Professor Caren Gundberg, Yale School of Medicine, New Haven, CT, USA), the mean fractional hydroxyapatite‐binding of osteocalcin was 0.77 and between‐run imprecision was 6.0% as measured in our laboratory. The serum aliquots used in this study had never been previously thawed, that is, they were kept at −80°C for 8 to 11 years and first thawed for the study assays of ucOC. The design of the osteocalcin assay indicated that major deterioration would not be expected under these conditions.(23)
Outcomes
Occurrence of death was ascertained from time of recruitment at wave 2 to December 31, 2016, for the entire cohort. Dates of death and causes of death were ascertained from the Western Australian Data Linkage System (WADLS), which contains both the original death certificate and ICD codes generated from this data and other sources by the Australian Bureau of Statistics.(24) Deaths related to CVD were categorized as deaths where the primary or underlying cause of death was coded as ICD‐9 codes 390–459 or ICD‐10 codes I00–99, G45. Deaths related to cancer were categorized as deaths where primary or underlying cause of death was coded as ICD‐9 codes 140–209 or ICD‐10 codes C00–C97.
Covariates
Age, smoking status, medical history, and medications use (including blood pressure‐, lipid‐, or glucose‐lowering medications) were obtained from questionnaire responses in wave 2. Educational attainment, alcohol consumption, and physical activity were recorded from questionnaire responses in wave 1. Height, weight, and blood pressure (BP) at rest were measured at wave 2, and body mass index (BMI) calculated (kg/m2). Cholesterol, high‐density lipoprotein cholesterol, creatinine, glucose, and vitamin D were previously measured in wave 2 blood samples.(25) Prevalent diabetes, CVD, cancer, Paget's disease of the bone, osteoporosis, bone fracture within the past 12 months, and current use of bisphosphonates or glucocorticoids were categorized using questionnaire responses from wave 1 and wave 2 (Supplemental Methods). As gamma‐carboxylation is a vitamin K‐dependent process, we also identified men who were receiving warfarin at wave 2. Incident bone fractures due to falls, excluding pathological fractures, were ascertained using WADLS.(26)
Statistical analyses
Baseline descriptive data were shown as mean and standard deviations (SD) or percentages (%). Cox proportional hazards regression was performed to assess associations of serum ucOC, TOC, PINP, and CTX in quartiles and as continuous variables (per 1 SD increase in each bone turnover marker) with incident deaths and deaths from CVD or cancer. Covariates included in the model were age, educational level, smoking status, alcohol consumption, physical activity, BP‐lowering medications, lipid‐lowering medications, prevalent diabetes, prevalent CVD, BMI, systolic BP, fasting status at time of blood collection, and concentrations of cholesterol, HDL‐cholesterol, creatinine, and vitamin D. For analysis of cancer mortality, prevalent cancer was also included in the model. The unadjusted and the fully adjusted Cox regression models are tabulated, with hazard ratios (HR) and 95% confidence intervals (CI). Two‐tailed p values are presented for the analysis of each bone turnover marker as a continuous variable, and a value p < 0.05 was regarded as significant. Analyses with the outcome of all‐cause mortality were repeated after exclusion of men who experienced a bone fracture during follow‐up. Competing risks analyses were conducted for the outcomes of CVD‐related and cancer‐related mortality, where deaths from unrelated causes were the competing risk. Sensitivity analyses were performed for all‐cause mortality excluding deaths occurring in the first 2 years and the final 2 years (Supplemental Methods and Supplemental Fig. S1).
Results
Baseline characteristics of the study cohort
A total of 4248 men aged 70 to 89 years were assessed in 2001–04, of whom 245 did not have BTMs measured. Of the 4003 men with a result for at least one BTM, men who had a history of osteoporosis, Paget's disease of bone, bone fracture within the previous 12 months, and those self‐reporting use of bisphosphonates or glucocorticoids were excluded, leaving 3871 men for the analysis (Fig. 1). Men self‐reporting use of warfarin (n = 233) were further excluded from analyses involving ucOC.
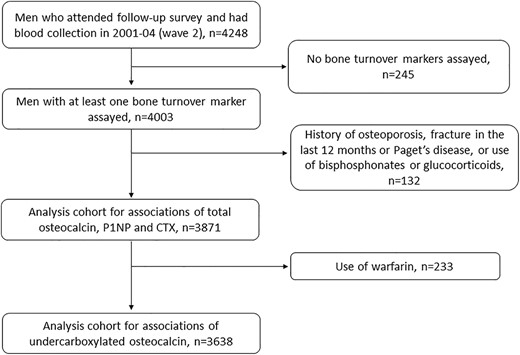
Flow chart showing the disposition of study participants.
Baseline characteristics of the analysis cohort are shown stratified by men who were still alive at the censor date and men who died during follow‐up (Table 1). Compared with men still alive at the end of follow‐up, those who died were older, had a lower education level, were more likely to smoke or have smoked, be on blood pressure–lowering medication, or have a history of diabetes, CVD, or cancer. Four‐fifths of the men had blood samples collected fasting, and this proportion was comparable in men who survived or died. Men who died had lower total cholesterol, higher creatinine, lower vitamin D, and higher ucOC, TOC, PINP, and CTX concentrations (Table 1). During a median follow‐up time of 12.3 years (25th centile 7.5 years, 75th centile 13.2 years) 2350 men died (61% of the cohort). Of these, the primary cause of death was CVD in 642 men (27% of deaths) and cancer in 638 men (27% of deaths).
Baseline Characteristics of the Study Population
| Variable | Analysis cohort N = 3871b | Alive at end of follow‐up n = 1521b | Died n = 2350b | p Valuea | |
| Age (years) | 77.0 ± 3.6 | 75.5 ± 2.7 | 77.9 ± 3.7 | <0.001 | |
| Education level | Primary or less | 550 (14.2) | 186 (12.2) | 364 (15.5) | <0.001 |
| Some high school | 1425 (36.8) | 541 (35.6) | 884 (37.6) | ||
| Completed HS/further | 1893 (48.9) | 793 (52.2) | 1100 (46.8) | ||
| Smoking status | Never | 1308 (33.8) | 599 (39.4) | 709 (30.2) | <0.001 |
| Former | 2372 (61.3) | 867 (57.0) | 1505 (64.1) | ||
| Current | 187 (4.8) | 54 (3.6) | 133 (5.7) | ||
| Alcohol (drinks/d) | None | 572 (18.0) | 218 (17.0) | 354 (18.6) | 0.088 |
| 1–2 | 1934 (60.8) | 807 (63.1) | 1127 (59.2) | ||
| 3+ | 676 (21.2) | 254 (19.9) | 422 (22.2) | ||
| Physical activityc | 2735 (70.8) | 1093 (72.0) | 1642 (70.0) | 0.179 | |
| Blood pressure treatment | 2319 (59.9) | 791 (52.0) | 1528 (65.0) | <0.001 | |
| Lipid‐lowering treatment | 1479 (38.2) | 585 (38.5) | 894 (38.0) | 0.793 | |
| Prevalent diabetes | 595 (15.4) | 176 (11.6) | 419 (17.8) | <0.001 | |
| Prevalent cardiovascular disease | 1989 (51.4) | 719 (47.3) | 1270 (54.0) | <0.001 | |
| Prevalent cancer | 1885 (48.7) | 672 (44.2) | 1213 (51.7) | <0.001 | |
| Body mass index (kg/m2) | 26.6 ± 3.6 | 26.6 ± 3.3 | 26.5 ± 3.7 | 0.426 | |
| Waist (cm) | 99.2 ± 9.9 | 98.7 ± 9.0 | 99.4 ± 10.4 | 0.028 | |
| Systolic blood pressure (mmHg) | 146.2 ± 20.1 | 146.4 ± 19.5 | 146.1 ± 20.4 | 0.653 | |
| Cholesterol (mmol/L) | 4.9 ± 1.0 | 5.0 ± 0.9 | 4.9 ± 1.0 | <0.001 | |
| HDL cholesterol (mmol/L) | 1.4 ± 0.4 | 1.4 ± 0.3 | 1.4 ± 0.4 | 0.063 | |
| Creatinine (μmol/L) | 93.8 ± 31.6 | 89.3 ± 17.1 | 96.8 ± 37.9 | <0.001 | |
| Vitamin D (nmol/L) | 68.4 ± 23.2 | 69.9 ± 23.8 | 67.4 ± 22.7 | <0.001 | |
| Fasting at time of blood sampling | 3030 (78.6) | 1211 (79.8) | 1819 (77.8) | 0.212 | |
| Undercarboxylated osteocalcin (ng/mL) | 11.3 ± 5.4 | 10.5 ± 4.0 | 11.8 ± 6.2 | <0.001 | |
| Total osteocalcin (ng/mL) | 21.0 ± 12.7 | 19.5 ± 10.1 | 22.0 ± 14.1 | <0.001 | |
| PINP (ng/mL) | 44.0 ± 36.9 | 41.1 ± 24.9 | 45.9 ± 43.0 | <0.001 | |
| CTX (ng/mL) | 0.32 ± 0.18 | 0.30 ± 0.15 | 0.34 ± 0.20 | <0.001 |
Results are shown as mean ± standard deviation or n (%).
Comparison of baseline characteristics of men alive at end of follow‐up versus those who died during follow‐up.
Numbers in tabulated columns may not add up exactly to these totals as some men had missing data for particular variables.
Achieved 75 minutes or more of vigorous exercise per week or 150 minutes or more of non‐vigorous exercise per week or an equivalent combination of both moderate and vigorous physical activity.
Associations of serum ucOC, TOC, PINP, and CTX with all‐cause mortality
Longitudinal analyses were conducted using quartiles of each exposure variable, and analyzing each as a continuous variable. In both unadjusted and fully adjusted analyses, compared with men in the lowest quartile, men with concentrations of ucOC, TOC, PINP, and CTX in highest quartile had a higher risk of death from any cause (Table 2). In unadjusted analyses of exposures as continuous variables, higher ucOC, TOC, PINP, and CTX were associated with all‐cause mortality. In the fully adjusted analyses (which included fasting status at time of blood sampling in the model), higher ucOC, PINP, and CTX were associated with all‐cause mortality (HR per 1 SD increase ucOC 1.12, 95% CI 1.06–1.18, p < 0.001; PINP HR = 1.06, 95% CI 1.01–1.11, p = 0.009; CTX HR = 1.13, 95% CI 1.08–1.19, p < 0.001). TOC was not associated with all‐cause mortality in the fully adjusted model.
Serum Concentrations of Undercarboxylated and Total Osteocalcin and Other Bone Turnover Markers as Predictors of All‐Cause Mortality in Older Men
| No. of events | Mortality per 100 person‐years | Hazard ratio (95% confidence interval) and p value | ||||||
| Exposure variable | Unadjusted model | Fully adjusted modelc | ||||||
| Undercarboxylated osteocalcin (ucOC) | ||||||||
| Quartile 1a | 488 | 5.30 | 1.00 | 1.00 | ||||
| Quartile 2 | 471 | 5.04 | 0.93 | (0.82, 1.06) | 0.97 | (0.84, 1.12) | ||
| Quartile 3 | 526 | 5.74 | 1.08 | (0.95, 1.22) | 1.03 | (0.89, 1.18) | ||
| Quartile 4 | 543 | 6.79 | 1.28 | (1.13, 1.45) | 1.18 | (1.02, 1.36) | ||
| Per 1 SD increaseb | 1.17 | (1.12, 1.22) | <0.001 | 1.12 | (1.06, 1.18) | <0.001 | ||
| Total osteocalcin (TOC) | ||||||||
| Quartile 1a | 437 | 5.30 | 1.00 | 1.00 | ||||
| Quartile 2 | 473 | 5.02 | 0.94 | (0.82, 1.07) | 1.04 | (0.87, 1.16) | ||
| Quartile 3 | 519 | 5.46 | 1.01 | (0.89, 1.15) | 0.99 | (0.86, 1.15) | ||
| Quartile 4 | 600 | 7.02 | 1.32 | (1.17, 1.49) | 1.22 | (1.04, 1.41) | ||
| Per 1 SD increaseb | 1.12 | (1.08, 1.16) | <0.001 | 1.02 | (0.98, 1.07) | 0.315 | ||
| Procollagen type I N‐propeptide (PINP) | ||||||||
| Quartile 1a | 522 | 5.63 | 1.00 | 1.00 | ||||
| Quartile 2 | 524 | 5.34 | 0.95 | (0.84, 1.08) | 0.98 | (0.86, 1.12) | ||
| Quartile 3 | 555 | 5.71 | 1.02 | (0.90, 1.14) | 1.09 | (0.95, 1.24) | ||
| Quartile 4 | 603 | 6.91 | 1.23 | (1.11, 1.40) | 1.22 | (1.07, 1.40) | ||
| Per 1 SD increaseb | 1.07 | (1.03, 1.10) | <0.001 | 1.06 | (1.01, 1.11) | 0.009 | ||
| Collagen type 1 C‐terminal cross‐linked telopeptide (CTX) | ||||||||
| Quartile 1a | 495 | 5.12 | 1.00 | 1.00 | ||||
| Quartile 2 | 544 | 5.70 | 1.11 | (0.98, 1.25) | 1.12 | (0.96, 1.27) | ||
| Quartile 3 | 563 | 5.81 | 1.13 | (1.00, 1.27) | 1.14 | (0.99, 1.31) | ||
| Quartile 4 | 601 | 6.99 | 1.39 | (1.23, 1.56) | 1.30 | (1.12, 1.50) | ||
| Per 1 SD increaseb | 1.15 | (1.11, 1.20) | <0.001 | 1.13 | (1.08, 1.19) | <0.001 | ||
Quartile boundaries for ucOC were Q1/2 8.04 μg/L, Q2/3 10.1 μg/L, Q3/4 12.9 μg/L; for TOC, Q1/2 14.5 μg/L, Q2/3 18.6 μg/L, Q3/4 24.0 μg/L; for PINP, Q1/2 28.1 μg/L, Q2/3 36.8 μg/L, Q3/4 49.3 μg/L, and for CTX, Q1/2 0.20 μg/L, Q2/3 0.28 μg/L, Q3/4 0.39 μg/L.
Quartile 1 is reference category for comparisons of hazard ratio (HR) for other quartiles of bone turnover marker.
Change in HR for 1 standard deviation increase in bone turnover marker.
Variables included in the fully adjusted model were age, educational level, smoking status, alcohol consumption, physical activity, blood pressure (BP)‐lowering medications, lipid‐lowering medications, prevalent diabetes, prevalent cardiovascular disease, body mass index, systolic BP, fasting status at time of blood collection, and concentrations of cholesterol, HDL cholesterol, creatinine, and vitamin D.
When the analyses were repeated after excluding 436 men with an incident fracture during follow‐up, the results were largely unchanged (Supplemental Table S1). Results were similar after excluding men who died in the first 2 years of follow‐up (Supplemental Table S2). In analyses excluding men who died in the final 2 years of follow‐up, higher ucOC, PINP, and CTX remained associated with all‐cause mortality (Supplemental Table S3).
Associations of serum ucOC, TOC, PINP, and CTX with CVD mortality
In unadjusted and fully adjusted analyses, HR for CVD mortality was higher for men with ucOC, TOC, PINP, and CTX in the highest quartile compared with the lowest (Table 3). Consistent results were found in the unadjusted analysis of each exposure as continuous variables (Table 3). In the fully adjusted analysis, higher ucOC and CTX were associated with CVD mortality (HR per 1 SD increase ucOC 1.13, 95% CI 1.05–1.22, p = 0.001; CTX HR = 1.12, 95% CI 1.04–1.20, p = 0.003). Neither TOC nor PINP were associated with CVD mortality in the fully adjusted analysis. When competing‐risks analysis was performed, the results were no longer significant, suggesting that ucOC and CTX might have been associated with causes of death other than CVD (Supplemental Table S4).
Serum Concentrations of Undercarboxylated and Total Osteocalcin and Other Bone Turnover Markers as Predictors of Cardiovascular Disease (CVD)‐Related Mortality in Older Men
| Exposure variable | No. of events | Mortality per 100 person‐years | Hazard ratio (95% confidence interval) and p value | |||||
| Unadjusted model | Fully adjusted modelc | |||||||
| Undercarboxylated osteocalcin (ucOC) | ||||||||
| Quartile 1a | 227 | 2.47 | 1.00 | 1.00 | ||||
| Quartile 2 | 226 | 2.42 | 0.97 | (0.81, 1.17) | 1.02 | (0.83, 1.26) | ||
| Quartile 3 | 246 | 2.69 | 1.10 | (0.92, 1.32) | 1.04 | (0.84, 1.27) | ||
| Quartile 4 | 278 | 3.48 | 1.46 | (1.22, 1.74) | 1.27 | (1.03, 1.56) | ||
| Per 1 SD increaseb | 1.21 | (1.15, 1.27) | <0.001 | 1.13 | (1.05, 1.22) | 0.001 | ||
| Total osteocalcin (TOC) | ||||||||
| Quartile 1a | 199 | 2.41 | 1.00 | 1.00 | ||||
| Quartile 2 | 230 | 2.44 | 1.01 | (0.84, 1.23) | 1.06 | (0.86, 1.31) | ||
| Quartile 3 | 246 | 2.59 | 1.08 | (0.89, 1.30) | 1.06 | (0.86, 1.32) | ||
| Quartile 4 | 303 | 3.55 | 1.53 | (1.28, 1.83) | 1.28 | (1.03, 1.59) | ||
| Per 1 SD increaseb | 1.16 | (1.11, 1.21) | <0.001 | 1.03 | (0.97, 1.10) | 0.400 | ||
| Procollagen type I N‐propeptide (PINP) | ||||||||
| Quartile 1a | 249 | 2.69 | 1.00 | 1.00 | ||||
| Quartile 2 | 275 | 2.80 | 1.04 | (0.88, 1.24) | 1.13 | (0.93, 1.37) | ||
| Quartile 3 | 271 | 2.79 | 1.04 | (0.88, 1.24) | 1.09 | (0.90, 1.33) | ||
| Quartile 4 | 302 | 3.46 | 1.32 | (1.12, 1.56) | 1.21 | (1.00, 1.47) | ||
| Per 1 SD increaseb | 1.07 | (1.02, 1.12) | 0.004 | 1.05 | (0.99, 1.12) | 0.128 | ||
| Collagen type 1 C‐terminal cross‐linked telopeptide (CTX) | ||||||||
| Quartile 1a | 233 | 2.41 | 1.00 | 1.00 | ||||
| Quartile 2 | 290 | 3.04 | 1.28 | (1.08, 1.52) | 1.27 | (1.04, 1.54) | ||
| Quartile 3 | 264 | 2.72 | 1.14 | (0.96, 1.37) | 1.16 | (0.94, 1.42) | ||
| Quartile 4 | 309 | 3.59 | 1.55 | (1.31, 1.84) | 1.35 | (1.10, 1.66) | ||
| Per 1 SD increaseb | 1.15 | (1.09, 1.21) | <0.001 | 1.12 | (1.04, 1.20) | 0.003 | ||
Quartile boundaries for ucOC were Q1/2 8.04 μg/L, Q2/3 10.1 μg/L, Q3/4 12.9 μg/L; for TOC, Q1/2 14.5 μg/L, Q2/3 18.6 μg/L, Q3/4 24.0 μg/L; for PINP, Q1/2 28.1 μg/L, Q2/3 36.8 μg/L, Q3/4 49.3 μg/L, and for CTX, Q1/2 0.20 μg/L, Q2/3 0.28 μg/L, Q3/4 0.39 μg/L.
Quartile 1 is reference category for comparisons of hazard ratio (HR) for other quartiles of bone turnover marker.
Change in HR for 1 standard deviation increase in bone turnover marker.
Variables included in the fully adjusted model were age, educational level, smoking status, alcohol consumption, physical activity, blood pressure (BP)‐lowering medications, lipid‐lowering medications, prevalent diabetes, prevalent cardiovascular disease, body mass index, systolic BP, fasting status at time of blood collection, and concentrations of cholesterol, HDL cholesterol, creatinine, and vitamin D.
Associations of serum ucOC, TOC, PINP, and CTX with cancer mortality
In unadjusted analyses, men with ucOC, TOC, PINP, and CTX in the highest quartiles had higher HR of cancer‐related mortality compared with the lowest quartile (Table 4), with the trend for ucOC being less apparent after adjustment. In unadjusted analyses of each exposure as continuous variables, ucOC and CTX were associated with cancer mortality (Table 4). However, in the fully adjusted analyses, only higher CTX was associated with cancer mortality (HR = 1.12, 95% CI 1.01–1.23, p = 0.024); ucOC, TOC, and PINP were not associated with this outcome. When competing‐risks analysis was performed, the results were similar, with higher CTX consistently associated with cancer mortality (Supplemental Table S5). The category of men with prevalent cancer included 656 men with nonmelanoma skin cancer; when these men were excluded from the analysis, the results were similar with higher CTX associated with cancer mortality (Supplemental Table S6).
Serum Concentrations of Undercarboxylated and Total Osteocalcin and Other Bone Turnover Markers as Predictors of Cancer Mortality in Older Men
| Exposure variable | No. of events | Mortality per 100 person‐years | Hazard ratio (95% confidence interval) and p valueb | |||||
| Unadjusted model | Fully adjusted modelc | |||||||
| Undercarboxylated osteocalcin (ucOC) | ||||||||
| Quartile 1a | 134 | 1.46 | 1.00 | 1.00 | ||||
| Quartile 2 | 125 | 1.34 | 0.92 | (0.72, 1.17) | 0.96 | (0.73, 1.25) | ||
| Quartile 3 | 157 | 1.71 | 1.18 | (0.94, 1.49) | 1.12 | (0.86, 1.46) | ||
| Quartile 4 | 147 | 1.84 | 1.29 | (1.02, 1.62) | 1.25 | (0.96, 1.64) | ||
| Per 1 SD increaseb | 1.10 | (1.02, 1.20) | 0.020 | 1.08 | (0.98, 1.20) | 0.122 | ||
| Total osteocalcin (TOC) | ||||||||
| Quartile 1a | 126 | 1.53 | 1.00 | 1.00 | ||||
| Quartile 2 | 123 | 1.31 | 0.86 | (0.67, 1.10) | 0.95 | (0.72, 1.25) | ||
| Quartile 3 | 147 | 1.55 | 1.02 | (0.80, 1.29) | 1.02 | (0.78, 1.34) | ||
| Quartile 4 | 167 | 1.95 | 1.31 | (1.04, 1.65) | 1.33 | (1.01, 1.75) | ||
| Per 1 SD increaseb | 1.07 | (0.99, 1.16) | 0.105 | 1.04 | (0.95, 1.16) | 0.394 | ||
| Procollagen type I N‐propeptide (PINP) | ||||||||
| Quartile 1a | 131 | 1.41 | 1.00 | 1.00 | ||||
| Quartile 2 | 144 | 1.47 | 1.04 | (0.82, 1.31) | 1.09 | (0.84, 1.41) | ||
| Quartile 3 | 152 | 1.56 | 1.11 | (0.88, 1.40) | 1.18 | (0.91, 1.53) | ||
| Quartile 4 | 173 | 1.98 | 1.42 | (1.13, 1.78) | 1.46 | (1.08, 1.83) | ||
| Per 1 SD increaseb | 1.02 | (0.94, 1.11) | 0.643 | 1.01 | (0.92, 1.11) | 0.893 | ||
| Collagen type 1 C‐terminal cross‐linked telopeptide (CTX) | ||||||||
| Quartile 1a | 135 | 1.40 | 1.00 | 1.00 | ||||
| Quartile 2 | 141 | 1.48 | 1.06 | (0.84, 1.35) | 1.03 | (0.78, 1.34) | ||
| Quartile 3 | 154 | 1.59 | 1.15 | (0.91, 1.44) | 1.18 | (0.90, 1.53) | ||
| Quartile 4 | 169 | 1.97 | 1.44 | (1.15, 1.80) | 1.39 | (1.06, 1.82) | ||
| Per 1 SD increaseb | 1.13 | (1.05, 1.21) | 0.002 | 1.12 | (1.01, 1.23) | 0.024 | ||
Prevalent cancer was included as a covariate in the fully adjusted model.
Quartile boundaries for ucOC were Q1/2 8.04 μg/L, Q2/3 10.1 μg/L, Q3/4 12.9 μg/L; for TOC, Q1/2 14.5 μg/L, Q2/3 18.6 μg/L, Q3/4 24.0 μg/L; for PINP, Q1/2 28.1 μg/L, Q2/3 36.8 μg/L, Q3/4 49.3 μg/L, and for CTX, Q1/2 0.20 μg/L, Q2/3 0.28 μg/L, Q3/4 0.39 μg/L.
Quartile 1 is reference category for comparisons of hazard ratio (HR) for other quartiles of bone turnover marker.
Change in HR for 1 standard deviation increase in bone turnover marker.
Factors included in the multivariable model were age, educational level, smoking status, alcohol consumption, physical activity, blood pressure (BP)‐lowering medications, lipid‐lowering medications, prevalent diabetes, prevalent cardiovascular disease, prevalent cancer, body mass index, systolic BP, fasting status at time of blood collection, and concentrations of cholesterol, HDL cholesterol, creatinine, and vitamin D.
Discussion
We report that higher ucOC concentrations are associated with higher all‐cause mortality after 12.3 years follow‐up in community‐dwelling older men. However, the relationship is not specific for ucOC, and similar associations were found with PINP and CTX. Higher concentrations of ucOC and CTX were also associated with CVD mortality and higher concentrations of CTX with cancer mortality.
To our knowledge, this is the first large, prospective cohort study to have examined associations of ucOC, TOC, and two other bone turnover markers, PINP and CTX, in parallel, with all‐cause and cause‐specific mortality outcomes. Previously, Confavreux and colleagues reported a study of 774 men aged 51 to 85 years, in which higher TOC was associated with lower all‐cause mortality, but that study did not report ucOC or other markers such as TOC or PINP, and had a relatively small number of outcome events with 181 deaths.(20) Szulc and colleagues in a study of 781 men aged ≥50 years found associations of the bone resorption markers free and total deoxypyridinoline and urinary and serum CTX with all‐cause mortality.(19) That study, with 182 deaths, did not examine ucOC, nor was cause‐specific mortality reported. Sambrook and colleagues reported a study of 1112 adults with mean age 86 years, of which 79% were female, with 559 deaths, finding that higher PINP and CTX concentrations were associated with mortality.(16) In that study, higher CTX was associated with deaths from cardiac causes, but not PINP, and ucOC and TOC were not reported.
In our study, with 3871 men and 2350 deaths over the period of follow‐up, we found that older men with higher serum ucOC concentrations had higher mortality risk independent of age, lifestyle factors, or medical comorbidities. It is important to acknowledge that the magnitude of the association was modest, with men in the highest quartile of ucOC concentrations having 18% higher risk compared with men in the lowest quartile, with a 12% higher risk per 1 SD increase of ucOC. Of note, this association was not found with TOC; however, similar associations were found with PINP and CTX.
Our study supports the hypothesis that there is a relationship between increased bone turnover and all‐cause mortality, but this is not specific for ucOC. The associations of ucOC, PINP, and CTX with all‐cause mortality were largely unchanged when men with an incident bone fracture were excluded from the analysis. Thus, the association is unlikely to reflect a direct contribution of higher bone turnover to bone fragility and hence osteoporotic fracture‐related morbidity and mortality.(11,27) Altogether, our data suggest that accelerated bone remodeling is associated with a higher risk of all‐cause mortality. Whether this higher bone turnover relates to age‐associated effects on muscle metabolism predisposing to sarcopenia is unclear.
There are conflicting reports in the literature in regard to the role and associations between osteocalcin and cardiovascular health. Significant inverse associations of TOC with atherosclerotic parameters have been described by some but not all studies.(7,8,28‐30) In men aged 51 to 85 years with metabolic syndrome, those with more metabolic syndrome traits had lower TOC concentrations.(31) Therefore, a link between osteocalcin and cardiovascular health is plausible. In a previous study, lower TOC concentrations were associated with risk of myocardial infarction in adults aged ≤40 years.(32) Lower TOC concentrations were also associated with lower ejection fraction and a higher risk of cardiac death in a study that included 158 men with mean age 65 years.(33) A case–control study, which included 399 men undergoing coronary angiography, found lower TOC concentrations in adults with a larger burden of coronary artery disease.(34)
By contrast, we found that older men with higher ucOC and CTX (but not TOC or PINP) had higher CVD mortality. However, this result was no longer significant in competing risks analysis. The initial result for CTX was in keeping with the study by Sambrook and colleagues in predominantly frail older women(16) and a study by Lerchbaum and colleagues in women aged 58 to 72 years referred for coronary angiography.(35) In a previous analysis from this cohort of older men, we found an association of higher PINP concentrations with incidence of fatal and nonfatal myocardial infarction.(36) In that analysis, neither ucOC nor TOC concentrations were associated with incidence of myocardial infarction or stroke. Therefore, our findings argue against the concept of ucOC having a protective influence on CVD mortality risk in older men. These data contrast with previous reports associating higher ucOC concentrations with lower glucose concentrations and lower risk of type 2 diabetes.(5,6)
The association of CTX with cancer mortality is of interest. Both ucOC and CTX, modeled as continuous variables, were associated with cancer mortality in unadjusted analysis, whereas the HR remained similar; the association of ucOC was no longer significant in the multivariate model. Higher CTX was associated with cancer mortality in the fully adjusted analysis, with 39% higher risk in men in the highest versus lowest quartile of values and a 12% higher risk per 1 SD increase in CTX. Previously it was reported that in men with a mean age of 58.1 years, serum ucOC/TOC ratio positively correlated with increased risk of advanced‐stage and high‐grade prostate cancer but not total prostate cancer.(37) This was interpreted as reflecting lower vitamin K availability, and mortality was not included. In a study of 5855 postmenopausal women, higher levels of TOC and CTX were associated with a lower risk of cancer across all time points of 3, 6, and 12 years of follow‐up.(38) TOC and CTX exhibited a U‐shaped association with all‐cause mortality in the same cohort of women.(18) Our results in older men implicate higher CTX, but not ucOC, TOC, or P1NP, with cancer‐related mortality.
Observational studies have associated use of antiresorptive therapies in people with osteoporosis with lower mortality.(39,40) A meta‐analysis of bisphosphonate trials reported a reduction in arterial calcification and in all‐cause mortality but no significant reduction in cardiovascular events or CVD mortality.(41) Therefore, it remains unclear to what extent the lower mortality observed with antiresorptive therapies for osteoporosis is accounted for by reduced rates of bone loss and lower risk of subsequent fracture.(42) Furthermore, studies conducted in people with osteoporosis or other bone disease may not be applicable to community‐dwelling men without osteoporosis.
While examination of potential mechanisms was outside the scope of this study, several pathways may be relevant. Higher bone turnover rates may be a marker for increasing frailty across different body systems with aging.(15) This may be a consequence of reduced physical activity, poor mobility, or limited weight‐bearing exercise in the elderly, predisposing to both bone loss and reduced overall fitness.(43) This may in turn predispose to vulnerability to and increased mortality from a range of precipitating events. With regard to cancer mortality, plausible explanations might include higher bone resorption signaling preexisting, subclinical disease or reflecting a state of bone that is more vulnerable to subsequent malignant involvement.(44) The underlying pathways linking CTX with cancer‐related mortality are unclear, and further studies would be needed to extend these observations. Given the associations of CTX with all‐cause and cancer mortality, higher CTX concentrations appear to be a valid measure of poorer health status in older men.
Strengths of this study include the large cohort of community‐dwelling men, the long period of follow‐up resulting in a large number of outcome events, and the measurement of ucOC, TOC, PINP, and CTX concentrations to compare and contrast associations of these different bone turnover markers with mortality outcomes. We measured serum ucOC concentrations using a hydroxyapatite binding assay, instead of a commercial antibody, which may overestimate ucOC.(22)
Limitations of this study include its observational nature, therefore causality cannot be determined. It is possible that results may reflect sampling imbalances, but the sample size was large, and we adjusted for a range of covariates and potential confounders. Nevertheless, we acknowledge the possibility of confounding from unmeasured variables. Although seasons were not adjusted for, circulating vitamin D was included in the fully adjusted model. Men assessed in wave 2 had participated in an earlier survey, thus a “healthy survivor” effect may be present. We relied on a single blood sample for assay of ucOC, TOC, PINP, and CTX, and did not have serial measurements of these markers. Outcome events were ascertained by linkage to the death registry, which captures all deaths in the state of Western Australia. As few men of this age emigrate interstate or overseas, this provides nearly complete ascertainment for this outcome.(24) Men in our study were predominantly White; therefore, our results may not apply to other ethnicities, nor can we comment on associations in women.
In conclusion, higher bone turnover, assessed by different BTMs including ucOC, PINP, and CTX, is a biomarker for all‐cause mortality in older men. Higher concentrations of CTX were also associated with cancer deaths. Further studies are needed to evaluate causality and explore the scope for therapies to reduce bone turnover and potentially modify mortality risk.
Disclosures
The authors have no relevant conflicts of interest to declare.
Acknowledgments
We thank the staff and management of Shenton Park Hospital for providing space in which to conduct study‐related clinics, and the staff of the Data Linkage Unit, Health Department of Western Australia, for their excellent technical assistance. We especially thank all the men and staff who participated in the Western Australian Abdominal Aortic Aneurysm Program and the Health in Men Study.
This work was supported by Grant‐in‐Aid G11P5662 from the National Heart Foundation of Australia. BBY held a Clinical Investigator Award from the Sylvia and Charles Viertel Charitable Foundation, New South Wales. PRE is supported by a National Health and Medical Research Council of Australia Investigator Grant (1197958). LF is supported by a Medical Research Future Fund Next Generation Clinical Researchers Practitioner Fellowship (1155669). JG is supported by a National Health and Medical Research Council of Australia Practitioner Fellowship (1117061) and Senior Clinical Research Fellowship from the Queensland Government. The Health in Men Study was funded by Project Grants from the National Health and Medical Research Council of Australia. The funding sources had no involvement in the planning, analysis, and writing of the manuscript.
Authors’ roles: CLR, GG, and BBY drafted the manuscript. PF conducted the statistical analysis. BBY and PF accept responsibility for the integrity of the data analysis. All authors contributed to the conception and design of the study, interpretation of data and revising the manuscript for important intellectual content, approved the final version, and agree to be accountable for the work. Open access publishing facilitated by The University of Western Australia, as part of the Wiley ‐ The University of Western Australia agreement via the Council of Australian University Librarians.
Author Contributions
Courtney L Robertson: Conceptualization; investigation; writing – original draft; writing – review and editing. Gaurav Ghosh: Conceptualization; investigation; writing – original draft; writing – review and editing. Patrick Fitzgerald: Conceptualization; data curation; formal analysis; writing – review and editing. Graeme J Hankey: Conceptualization; investigation; writing – review and editing. Itamar Levinger: Conceptualization; investigation; writing – review and editing. Jonathan Golledge: Conceptualization; investigation; writing – review and editing. Osvaldo P Almeida: Conceptualization; investigation; writing – review and editing. Leon Flicker: Conceptualization; investigation; project administration; writing – review and editing. Peter R Ebeling: Conceptualization; investigation; writing – review and editing. Bu B Yeap: Conceptualization; investigation; writing – original draft; writing – review and editing.
Data Availability Statement
Restrictions apply to the availability of some or all data generated or analyzed during this study to preserve participant confidentiality. The corresponding author will on request detail the restrictions and any conditions under which access to some data may be provided.
References
Author notes
PRE and BBY are joint senior authors.
