


ABSTRACT
Human induced pluripotent stem cells (hiPSCs) hold great potential for modeling human diseases and the development of innovative therapeutic approaches. Here, we report on a novel, simplified differentiation method for forming functional osteoclasts from hiPSCs. The three‐step protocol starts with embryoid body formation, followed by hematopoietic specification, and finally osteoclast differentiation. We observed continuous production of monocyte‐like cells over a period of up to 9 weeks, generating sufficient material for several osteoclast differentiations. The analysis of stage‐specific gene and surface marker expression proved mesodermal priming, the presence of monocyte‐like cells, and of terminally differentiated multinucleated osteoclasts, able to form resorption pits and trenches on bone and dentine in vitro. In comparison to peripheral blood mononuclear cell (PBMC)‐derived osteoclasts hiPSC‐derived osteoclasts were larger and contained a higher number of nuclei. Detailed functional studies on the resorption behavior of hiPSC‐osteoclasts indicated a trend towards forming more trenches than pits and an increase in pseudoresorption. We used hiPSCs from an autosomal recessive osteopetrosis (ARO) patient (BIHi002‐A, ARO hiPSCs) with compound heterozygous missense mutations p.(G292E) and p.(R403Q) in CLCN7, coding for the Cl−/H+‐exchanger ClC‐7, for functional investigations. The patient's leading clinical feature was a brain malformation due to defective neuronal migration. Mutant ClC‐7 displayed residual expression and retained lysosomal co‐localization with OSTM1, the gene coding for the osteopetrosis‐associated transmembrane protein 1, but only ClC‐7 harboring the mutation p.(R403Q) gave strongly reduced ion currents. An increased autophagic flux in spite of unchanged lysosomal pH was evident in undifferentiated ARO hiPSCs. ARO hiPSC‐derived osteoclasts showed an increased size compared to hiPSCs of healthy donors. They were not able to resorb bone, underlining a loss‐of‐function effect of the mutations. In summary, we developed a highly reproducible, straightforward hiPSC‐osteoclast differentiation protocol. We demonstrated that osteoclasts differentiated from ARO hiPSCs can be used as a disease model for ARO and potentially also other osteoclast‐related diseases. © 2021 The Authors. Journal of Bone and Mineral Research published by Wiley Periodicals LLC on behalf of American Society for Bone and Mineral Research (ASBMR).
INTRODUCTION
Osteoclasts (OCs) are giant multinucleated cells formed by fusion of mononuclear precursors that differentiate from monocytes.(1) Although closely related to tissue macrophages, osteoclasts have a special capacity to resorb mineralized cartilage and bone, distinguishing them from all other phagocytosing cells. This resorption process crucially depends on extracellular acidification, which is required for dissolving the basic hydroxyapatite crystals deposited in the mineralized extracellular matrix.(2)
Genetic defects resulting in dysfunction of the components of this acid secretion mechanism partially or entirely block the resorption capacity, and lead to the accumulation of mineralized cartilage and bone with multiple consequences: (i) increased fracture rates; (ii) bone marrow insufficiency with anemia and immune deficiency; (iii) osteomyelitis; and (iv) blindness due to optic nerve damage.(1) Autosomal recessive osteopetrosis (ARO) is the most dramatic type of such defects, it is usually lethal during childhood. About 50% of the ARO cases are due to mutations in the T cell immune regulator gene 1 (TCIRG1, MIM #604592) encoding a subunit of the vacuolar proton pump. In 10% to 15% of ARO cases, biallelic mutations in the chloride channel 7 gene (CLCN7, MIM #602727) are responsible and in 2% to 5% mutations in the gene coding osteopetrosis‐associated transmembrane protein 1 (OSTM1, MIM #607649). ARO is a rare disease, the incidence of all forms of ARO together is around 1:100,000. Mice deficient in Ostm1 or Clcn7 show a neuronal lysosomal storage disease and a progressive deterioration of neurological function.(3–5) This is in line with the function of ClC‐7 residing in lysosomes, where it regulates intraluminal ion homeostasis together with its β‐subunit Ostm1.(6,7) A subset of patients with biallelic CLCN7 loss‐of‐function mutations develops neurodegeneration, the so‐called neuronopathic form of ARO. However, patients with OSTM1‐ARO not only show neurodegeneration, but also cortical brain malformations, implying disturbed developmental processes.(8) Interestingly, also activating mutations in CLCN7 can lead to abnormal brain development, albinism, and lysosomal storage without any bone phenotype.(9)
Human induced pluripotent stem cells (hiPSCs) with their capacity for unlimited self‐renewal and differentiation into almost all cell types hold great potential for modeling human diseases and developing novel therapeutic approaches. Several protocols for differentiation of hiPSCs into macrophages and osteoclasts have been published, all of which rely on the formation of embryoid bodies for mesodermal specification and the induction of hematopoiesis.(10–15) However, the combination of cytokines, their concentrations, and the media used vary between the existing protocols, which can have a strong impact on the outcome and costs of the experiments. Furthermore, the exact yield of hiPSC‐osteoclasts and their characteristics have not been described in detail.
Here we report on a novel, robust osteoclast differentiation protocol with optimized media composition resulting in high osteoclast yield. We demonstrate comparable morphology and function of hiPSC‐derived and primary peripheral blood mononuclear cell (PBMC)‐derived osteoclasts. In addition, we successfully use our protocol to establish a disease model for ARO, using hiPSCs from a pediatric patient with biallelic CLCN7 mutations and a lethal phenotype.
MATERIALS AND METHODS
Maintenance of hiPSCs
Osteoclast‐related experiments were performed using hiPSC lines BIHi001‐A and BIHi004‐A (https://hpscreg.eu/cell-line/BIHi001-A, https://hpscreg.eu/cell-line/BIHi004-A, kindly provided by the BIH Core Facility Stem Cells), 10211.EURCC, UMGi014‐C clone 14, and UMGi020‐B clone 21 (isWT1.14 and isWT7.21 respectively, https://hpscreg.eu/cell-line/UMGi014-C, https://hpscreg.eu/cell-line/UMGi020-B, kindly provided by the UMG Stem Cell Unit) from control donors as well as osteopetrosis patient‐derived cell lines BIHi002‐A,(16) BIHi002‐B, and BIHi002‐C. Origins and reprogramming methods of the hiPSC lines are listed in Table S1. Methods and materials used for hiPSC reprogramming and characterization are further described in Supplementary Methods and shown in Table S11, Table S12 and Table S13. The hiPSCs were maintained in Essential 8 medium (Life Technologies, Bleiswijk, Netherlands) in Geltrex‐coated (Life Technologies, Bleiswijk, Netherlands) 6‐well dishes in a humidified normoxic incubator (37°C, 5% CO2) and routinely passaged in colonies at a ratio of ~1:20 every 4 to 5 days by using 0.5mM ethylenediamine tetraacetic acid (EDTA) (Life Technologies, Bleiswijk, Netherlands).
Osteoclast differentiation of hiPSCs
At least 3 days before starting the differentiation, hiPSCs cultured in Essential 8 medium were adapted to mTeSR™1 (Stemcell Technologies, Vancouver, Canada) medium. For embryoid body (EB) formation and mesodermal induction, single cells were harvested by TrypLE Select Enzyme (Life Technologies, Bleiswijk, Netherlands) treatment. Subsequently, 1.25 × 10⁴ cells were seeded per well in a round bottom ultra‐low attachment 96‐well plate (Corning, Kennebunk, ME, USA) in 100 μl mTeSR™1 medium supplemented with 50 ng/ml human bone morphogenetic protein 4 (hBMP4), 50 ng/ml human vascular endothelial growth factor‐165 (hVEGF165), 20 ng/ml human stem cell factor (hSCF), and 10μM Rock‐inhibitor Y‐27632 (Wako Chemicals, Neuss, Germany). The plate was centrifuged for 3 min at 100g. Half of the medium was changed on day 1 and day 2. Four days after initiation of EB formation, EBs with a diameter of ~500 μm were transferred to 6‐well culture dishes coated with 0.1% gelatin (eight EBs per well) and containing 3 ml/well differentiation medium (X‐VIVO 15 medium [Lonza, Verviers, Belgium], 2mM Ultraglutamine, 55μM 2‐mercaptoethanol, 1% Penicillin/Streptomycin [Pen/Strep], 25 ng/ml human interleukin 3 [hIL‐3], 100 ng/ml human macrophage colony‐stimulating factor [hM‐CSF] [R&D Systems, Minneapolis, MN, USA]). Once per week, produced monocyte‐like suspension cells were harvested and myeloid‐cell‐forming complexes (MCFCs) were supplied with 2 ml/well fresh medium. For terminal osteoclast differentiation, harvested monocyte‐like cells were seeded at a density of 1 × 10⁵ cells/cm2 in cell culture vessels supplied with α minimum essential medium (α‐MEM) Eagle medium (Lonza, Verviers, Belgium) containing 10% fetal bovine serum (FBS) Superior (Sigma‐Aldrich, St. Louis, MO, USA), 1% Pen/Strep, and 50 ng/ml hM‐CSF. Three days after seeding, half of the culture medium was replaced with fresh osteoclast medium (α‐MEM Eagle, 10% FBS Superior, 1% Pen/Strep, 100 ng/ml hM‐CSF, 100 ng/ml human soluble receptor activator of nuclear factor‐κ B ligand [hsRANKL]). Due to one half remaining old culture medium, the final cytokine concentration of freshly added hM‐CSF and hsRANKL in the culture was 50 ng/ml. The cells were cultured for additional 3 to 7 days. Every 2 to 3 days, half of the medium was replaced with fresh osteoclast medium. All cytokines were purchased from Peprotech (Rocky Hill, NJ, USA) if not indicated differently. The procedure was adapted from a hiPSC‐based macrophage differentiation protocol.(17)
Isolation and differentiation of primary blood monocytes
PBMCs were isolated from whole blood of two healthy donors (female donor P1 and male donor P2) by density centrifugation (Biocoll, 1.077 g/ml; Merck Millipore, Molsheim, France), followed by MACS cell separation for monocyte enrichment (Monocyte Isolation Kit II; Miltenyi Biotec, Bergisch Gladbach, Germany). Freshly isolated primary monocytes underwent terminal osteoclast differentiation as described for hiPSCs in the previous paragraph.
Flow cytometry
Surface marker staining of 5 × 10⁵ freshly isolated monocytes or harvested hiPSC‐derived monocyte‐like cells was performed in 50 μl staining solution for 10 min at 4°C. The staining solution contained Miltenyi Biotec (Bergisch Gladbach, Germany) antibodies and reagents diluted as indicated in fluorescence‐activated cell sorting (FACS) buffer (2mM EDTA and 0.5% bovine serum albumin [BSA] in Dulbecco's phosphate‐buffered saline [DPBS]): human Tandem Signal Enhancer 1:17, human Fc receptor [FcR]‐Blocking Reagent 1:5, and Isotype controls 1:10 or human surface marker antibodies (CD34‐fluorescein isothiocyanate [FITC] 1:10, CD45‐VioBlue 1:20, CD66b‐phycoerythrin [PE]‐Vio770 1:20, CD11b‐PE 1:50, CD14‐allophycocyanin [APC] 1:50). Cells were washed with FACS buffer once before and three times after staining. Directly before sample acquisition by MACSQuant® VYB Analyzer (Miltenyi Biotec), cells were stained with propidium iodide (1 μg/ml, Molecular Probes, Eugene, OR, USA) in 200 μl sample volume. Acquired data were analyzed with FlowJo 10.5.3 (FlowJo, LLC, Ashland, OR, USA). Debris, dead cells and cell doublets were excluded from the analysis as shown in the representative gating strategy in Figure S1.
Osteoclast staining
Osteoclasts were fixed with 4% paraformaldehyde (PFA) 4 days after detection of the first osteoclasts in the culture. Staining of tartrate resistant acid phosphatase (TRAcP) activity was performed using Naphthol AS‐MX phosphate disodium salt (Sigma‐Aldrich, Taufkirchen, Germany) and Fast Red Violet LB Salt (Sigma‐Aldrich, Taufkirchen, Germany). Actin was stained with fluorescently labeled phalloidin (Alexa Fluor™ 488; Molecular Probes, Eugene, OR, USA) and 4′,6‐diamidino‐2‐phenylindole (DAPI; Life Technologies, Bleiswijk, Netherlands) detected the cell nuclei. Staining was performed as described .(18)
Resorption assay
Two days after the first osteoclasts were detected in the culture, small mature osteoclasts were detached by Accutase treatment (Sigma‐Aldrich, Taufkirchen, Germany) for 10 to 15 min at 37°C and seeded at a density of 6.6 × 10⁴ osteoclasts per 96‐well either on dentine slices or cortical bovine bone slices (BoneSlices.com, Jelling, Denmark) in α‐MEM Eagle medium containing 10% FBS Superior, 1% Pen/Strep, and 50 ng/ml hM‐CSF and hsRANKL. Osteoclast cultures were maintained for 5 days. After 2 days, half of the medium was replaced with fresh one. At culture termination, bone slices were washed in purified water and cells were removed with a paper towel. Resorption pits were stained with either 0.25% toluidine solution (Sigma‐Aldrich, Taufkirchen, Germany) or black ink (Pelikan, Feusisberg, Switzerland) for 15 s. The identification of pits, trenches, pseudoresorption, and the quantification was done as shown in Figure S2 and as described.(19) All quantification experiments were performed blinded.
Quantitative reverse transcription polymerase chain reaction
RNA was extracted from the cells and purified by using the Direct‐zol™ RNA MiniPrep Kit (Zymo Research, Freiburg, Germany). Total complementary DNA (cDNA) was transcribed by RevertAid™ H Minus First Strand cDNA Synthesis Kit (Life Technologies, Bleiswijk, Netherlands) using random hexamer primers. Quantitative polymerase chain reaction (qPCR) was performed with 5× HOT FIREPol® EvaGreen® qPCR Mix Plus (Solis BioDyne, Tartu, Estonia) on Quant Studio 3 Real‐Time PCR System (Life Technologies, Singapore). Data were analyzed according to the delta‐delta threshold cycle (ΔΔCt) method, whereby glyceraldehyde‐3‐phosphate dehydrogenase (GAPDH) levels served as internal controls. Primer sequences are listed in Table S2.
Quantitative analysis of osteoclasts
Images of stained osteoclasts of three independent differentiation experiments of each cell line were taken using the Opera Phenix high content screener (Perkin Elmer, Waltham, MA, USA) and quantified. Three technical replicates of each differentiation and two pictures (one with high and one with low osteoclast density, each covering 6.5 mm2) of each replicate were analyzed. By using image analysis software (CellProfiler; https://cellprofiler.org/) nuclei were identified, osteoclast cells were selected manually, and osteoclast number and size were quantified. On average, 812 osteoclasts per cell line and experiment were analyzed. All quantification experiments were performed blinded.
Lysosomal pH measurement
Lysosomal pH was measured essentially as described.(7) Human iPSCs were dissociated to single cells using TrypLE Select Enzyme and seeded onto glass‐bottom live‐cell dishes (MatTek, Ashland, MA, USA) in Essential 8 medium supplemented with 10μM Rock‐inhibitor Y‐27632. Twenty‐four hours (24 h) after plating, lysosomes were loaded with 0.5 mg/ml Oregon Green 488‐dextran (Life Technologies, Bleiswijk, Netherlands) in growth medium overnight, followed by a 2 h chase. For imaging, the medium was changed to imaging buffer containing 135mM NaCl, 5mM KCl, 1mM MgCl2, 1mM CaCl2, and 10mM glucose, 10mM N‐2‐hydroxyethylpiperazine‐N′‐2‐ethanesulfonic acid (HEPES), pH 7.4. Images were acquired using a Leica DMi8 microscope (Leica Microsystems, Wetzlar, Germany) equipped with a 63 × 1.40 numerical aperture (NA) oil‐immersion lens and an Oregon Green filter cube (AHF analysentechnik AG, Tübingen‐Pfrondorf, Germany) with excitation at 440 or 480 nm, respectively, delivered by an OptoScan monochromator (Cairn Research, Faversham, UK) controlled by the microscopy software WinFluor (John Dempster, University of Strathclyde, Glasgow, Scotland), and emission at 516 to 556 nm. At the end of each experiment, in situ pH calibration curves were obtained in isotonic K‐based solutions (5mM NaCl, 115mM KCl, 1.2mM MgSO4, 10mM glucose, 25mM of either HEPES, 2‐(N‐morpholino)ethanesulfonic acid [MES], or acetate, ranging in pH from 3.9 through 6.5) supplemented with 10μM of both nigericin and monensin after equilibration for at least 2 min for each pH. Images were analyzed using ImageJ software (NIH, Bethesda, MD, USA; https://imagej.nih.gov/ij/), where regions of interest (ROIs) were defined as areas above a defined fluorescence threshold in the acquired images at 440 nm excitation (pH‐insensitive). The mean intensity ratio between 480 and 440 nm excitation was calculated after background subtraction for each ROI. The fluorescence intensity ratios (488/440) as a function of pH was fit to a sigmoid and used to interpolate the pH values from the cells prior to the calibration.
Immunostaining
Plasmid DNA encoding the respective constructs (hClC‐7 wild‐type [WT] or mutant, and human OSTM1 (hOSTM1)–monomeric red fluorescent protein (mRFP) was transfected into HeLa cells at 40% confluency, using Fugene 6 reagent (Promega, Madison, WI, USA), 48 h before fixation with 4% PFA in PBS for 15 min. For immunolabeling, cells were incubated with 30mM glycine in PBS for 5 min, permeabilized with antibody buffer (0.05% saponin and 3% BSA in PBS) for 15 min and then subsequently incubated with primary and AlexaFluor‐coupled secondary antibodies diluted in antibody buffer for 90 and 60 min, respectively, with washing steps in antibody buffer. Primary antibodies were rabbit anti‐ClC‐7 (7N4B; kind gift from Thomas Jentsch(5)) and mouse anti‐lysosomal‐associated membrane protein 1 (anti‐LAMP‐1) (H4A3 was deposited to the DSHB by August, J.T. / Hildreth, J.E.K. [DSHB Hybridoma Product H4A3]). Images were acquired with a Leica DMi8 light microscope (Leica Microsystems, Wetzlar, Germany) equipped with a 63× 1.40 NA oil‐immersion lens and respective filter cubes (FITC for Alexa488; tetramethylrhodamine isothiocyanate [TRITC] for mRFP; and Y5.5 [filter cube] for Alexa633).
Electrophysiology
hClC‐7 and h‐OSTM1‐mRFP expressing plasmids were co‐transfected in HEK‐293 cells by using Effectene Transfection Reagent (Qiagen, Hilden, Germany). Patch‐clamp experiments were performed in whole‐cell configuration 24 to 72 h posttransfection. Pipettes were pulled from borosilicate capillaries (Hilgenberg, Malsfeld, Germany) and had a resistance of 1.5 to 2.5 MOhm in measuring solutions. The standard intracellular (pipette) solution contained (in mM) 130 NaCl, 10 HEPES, 2 MgSO4, and 2 EGTA (pH 7.3). The extracellular (bath) solution contained (in mM) 147 NaCl, 10 HEPES, and 4 MgSO4 (pH 7.3). Voltage steps of 1 s duration from 120 to 60 mV in decrements of 20 mV with 1 s interval between pulses were conducted, holding potential was 0 mV. Data were acquired at 20 to 50 kHz after filtering at 10 kHz with an eight‐pole Bessel filter using an Axopatch 200 amplifier (Molecular Devices, San Jose, CA, USA) with GePulse software. Data analysis was performed with Ana software (GePulse and Ana available at: http://users.ge.ibf.cnr.it/pusch/).
Plasmids
The expression plasmid for hClC‐7 was described.(20) The mutations p.(G292E) and p.(R403Q) were introduced by recombinant PCR. For patch‐clamp experiments, four additional mutations deleting lysosomal targeting di‐leucine motifs (leucine 23, 24, 68, and 69 changed to alanines) were introduced into CLCN7.(21) For expression of hOSTM1‐mRFP, the open reading frame (ORF) was cloned into pmRFP‐N1. The complete ORFs were confirmed by Sanger sequencing.
LC3 and ClC‐7 Western blot
For the analysis of the autophagic markers like microtubule‐associated protein light chain 3 (LC3)‐I and II and the determination of the autophagic flux, hiPSCs were seeded at about 70% confluency. The next day, cells were starved for 2 h in Krebs‐Ringer solution (Alfa Aesar; Thermo Fisher, Kandel, Germany) and incubated with or without 50μM chloroquine (autophagy inhibitor). Cells were lysed with radioimmunoprecipitation assay (RIPA) buffer containing cOmplete™ protease inhibitors (Roche, Mannheim, Germany) and the proteins LC3 (Cell Signaling Technology, Beverly, MA, USA; #4108, 1:1000) and GAPDH (Thermo Fisher Scientific; #AM4300, 1:20,000) were analyzed by immunoblotting after 12% sodium dodecyl sulfate–polyacrylamide gel electrophoresis (SDS‐PAGE) and transferred to a polyvinylidene fluoride (PVDF) membrane. GAPDH and LC3‐II levels were determined by densitometric quantification and LC3‐II was normalized to GAPDH. For each culture condition (standard and starvation), the autophagic flux was calculated by subtracting densitometrically quantified relative LC3‐II levels obtained without chloroquine treatment from LC3‐II levels acquired with chloroquine.(22) For ClC‐7 immunoblotting hiPSCs were lysed, separated, blotted, and quantified as described earlier in this paragraph for LC3 Western blot analysis. A total of 20 μg of protein per lane was separated by 10% SDS‐PAGE and blotted proteins were probed with following antibodies: guinea‐pig anti ClC‐7 (7N4B(5); gift from Thomas Jentsch) and rabbit anti GAPDH (14C10; Cell Signaling Technology; #2118, 1:1,000).
Statistical analysis
Data were plotted and statistically evaluated using GraphPad Prism Version 8 (GraphPad Software, Inc., La Jolla, CA, USA).
RESULTS
Efficient generation of monocyte‐like cells from hiPSC‐derived myeloid‐cell‐forming complexes
To establish an efficient osteoclast differentiation protocol, we used two hiPSC lines (BIHi001‐A and BIHi004‐A), derived from skin fibroblasts of healthy control individuals. The first differentiation step was induced via the formation of embryoid bodies (EBs) in ultra‐low attachment plates (Figure 1A). Next, a combination of hBMP4, hVEGF, and hSCF initiated mesodermal priming of EBs. In order to monitor the differentiation process, we analyzed marker gene expression by quantitative reverse transcription polymerase chain reaction (qRT‐PCR). Comparing undifferentiated hiPSCs and EBs, we observed successful mesodermal induction by decreased expression of pluripotency markers OCT4, SOX2, and NANOG, and increased expression of mesodermal markers CD34, HAND1, TBXT, and CDX2 (Figure 1B, Figure S3).
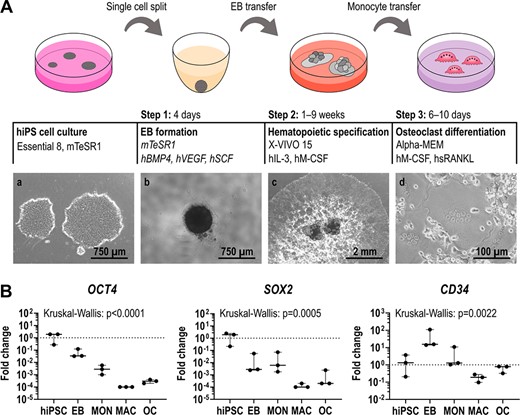
Differentiation of hiPSCs into osteoclasts. (A) Schematic illustration of the osteoclast differentiation procedure. Step 1: EB formation. Step 2: Differentiation of EBs into MCFCs, which produce monocyte‐like suspension cells. Step 3: Final osteoclast differentiation of monocyte‐like cells. Phase contrast images of hiPSC colonies (a), a single EB (b), MCFCs (c), and osteoclasts (d). (B) Expression of pluripotency markers OCT4 and SOX2 and mesodermal marker CD34 determined by qRT‐PCR analysis in BIHi004‐A hiPSC‐derived cells in undifferentiated hiPSCs, 4‐day‐old EBs, MONs, MACs, and OCs. Expression is normalized to hiPSCs, GAPDH expression was used as housekeeping control. Data show box‐plots with median, interquartile range, maximum, and minimum values, and all data points of three independent experiments. For statistical analysis, Kruskal‐Wallis test and Dunn's multiple comparisons were used (Table S3). Abbreviations: EB, embryoid body; GAPDH, glyceraldehyde‐3‐phosphate dehydrogenase; hiPSC, human induced pluripotent stem cell; MAC, macrophage, MCFC, myeloid‐cell‐forming complex; MON, monocyte‐like cell; OC, osteoclast; qRT‐PCR, quantitative reverse transcription polymerase chain reaction.
As a second step, EBs were differentiated into myeloid‐cell‐forming complexes (MCFCs). Depending on the hiPSC line, over a time period of 9 to 13 weeks, MCFCs were exposed to hIL‐3 and hM‐CSF, which triggered the release of suspension cells into the medium (Figure 1A). Between weeks 2 and 3, our tested hiPSC lines showed the highest suspension cell release (up to 7.5 × 10⁵ cells per well containing eight MCFCs). After this production peak, the number of suspension cells slowly decreased (Figure 2A). On average, every MCFC released 3.2 × 10⁵ suspension cells within 9 weeks. During the first days of production, flow cytometry showed a considerable fraction of CD34+ cells, indicating an immature phenotype (Figure 2B, Figure S4). We also detected many dead cells during this early phase of the differentiation protocol (Table S4). The released cells gradually matured over the next 2 weeks. Around the time of maximal production, the suspension cells were positive for monocyte markers like CD11b, CD14, CD45, but negative for CD34 (marker for hematopoietic stem cells [HSCs]) and CD66b (marker for eosinophils and neutrophils). qRT‐PCR also revealed an increased expression of the hM‐CSF receptor CSF1R and MAF (involved in macrophage proliferation) when compared to undifferentiated hiPSCs and EBs (Figure 2C). Hence, the released cells closely resembled monocyte‐like cells. Indeed, primary monocytes freshly isolated from peripheral blood displayed the same surface marker profile as hiPSC‐derived monocyte‐like cells (Figure 2D). In the final step of the protocol, the harvested monocyte‐like cells were differentiated into osteoclasts by exposing them to hM‐CSF and hsRANKL (Figure 1A).
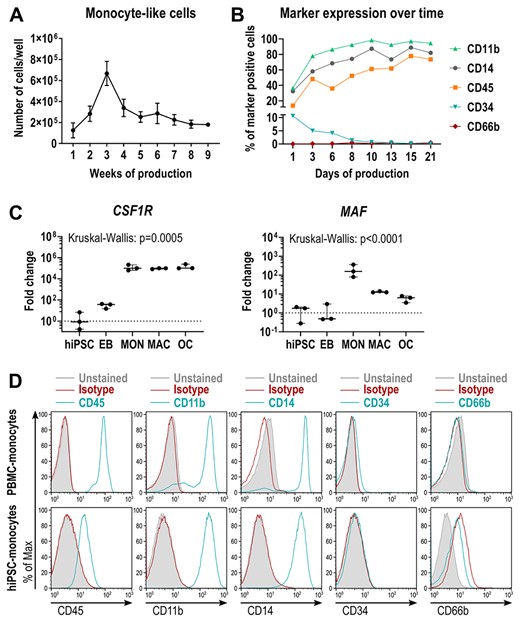
Characterization of hiPSC‐derived monocyte‐like cells. (A) Kinetics of monocyte‐like cell production in BIHi004‐A hiPSCs. Data are absolute numbers of harvested suspension cells per 6‐well containing eight MCFCs (means and SD of three independent experiments, each with twelve 6‐wells. (B) Frequency of surface marker‐expressing monocyte‐like cells determined by flow cytometry, harvested at different time points. (C) Expression of monocytic markers CSF1R and MAF determined by qRT‐PCR analysis in BIHi004‐A hiPSC‐derived cells in undifferentiated hiPSCs, 4‐day‐old EBs, MONs, MACs, and OCs. Expression is normalized to hiPSCs, GAPDH expression was used as housekeeping control. Data show box‐plots with median, interquartile range, maximum, and minimum values and all data points of three independent experiments. For statistical analysis, Kruskal‐Wallis test and Dunn's multiple comparisons were used (Table S3). (D) Representative flow cytometry analysis of human primary monocytes (donor P2) and hiPSC‐derived monocyte‐like cells (BIHi004‐A, harvested in week 5 after EB transfer). Histograms show unstained cells (gray‐filled), cells stained with isotype controls (red), and cells stained with the respective surface markers (blue). Abbreviations: EB, embryoid body; GAPDH, glyceraldehyde‐3‐phosphate dehydrogenase; hiPSC, human induced pluripotent stem cell; MAC, macrophage, MCFC, myeloid‐cell‐forming complex; MON, monocyte‐like cell; OC, osteoclast; qRT‐PCR, quantitative reverse transcription polymerase chain reaction; SD, standard deviation.
Physiological gene expression and an increased size of hiPSC‐derived osteoclasts
Next, we analyzed the hiPSC‐derived osteoclasts for typical osteoclast features and functionality and compared them to osteoclasts differentiated from monocytes from PBMCs of healthy donors. First, TRAcP‐Phalloidin‐DAPI staining of PBMC‐derived and hiPSC‐derived osteoclasts differentiated by our protocol, revealed multinucleated TRAcP‐positive cells and the formation of a podosome belt (Figure 3A, middle). Furthermore, both osteoclast types were able to form resorption pits and trenches on dentine (Figure 3A, right). Finally, osteoclast markers like cathepsin K (CTSK) and matrix metalloproteinase 9 (MMP9) were similarly upregulated in primary and hiPSC‐osteoclasts, as demonstrated by transcriptome and qRT‐PCR analysis (Figure S6, Figure 3B, Figure S5, Table S3, Table S5). A comparison of global expression signatures revealed close similarity between PBMC‐derived and hiPSC‐derived osteoclasts in comparison to monocytes (Figure S6). Among the genes with elevated expression in hiPSC‐derived osteoclasts were FOS, MAF, and NFATC1. MAF is a macrophage marker gene and FOS is important for early differentiation of macrophages and osteoclasts.(23) We thus conclude that our differentiation protocol generated slightly immature osteoclasts that are fully functional.
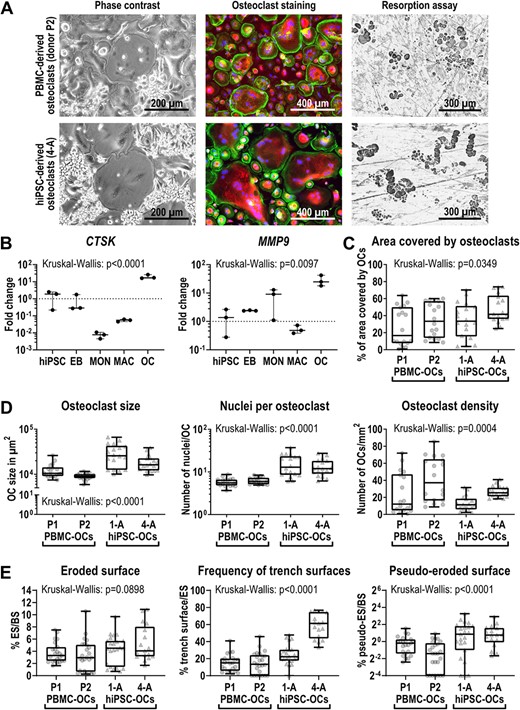
Characterization of differentiated hiPSC‐derived osteoclasts. Osteoclasts were differentiated from PBMCs (donors P1 and P2) and the two hiPSC lines BIHi001‐A (1‐A) and BIHi004‐A (4‐A). (A) Representative images of osteoclasts in culture (phase contrast), stained osteoclasts (Phalloidin in green, TRAcP in red, DAPI in blue) and osteoclast‐mediated resorption shown as black‐stained cavities on dentine. (B) Expression of osteoclast markers CTSK and MMP9 determined by qRT‐PCR analysis in BIHi004‐A hiPSC‐derived cells in undifferentiated hiPSCs, 4‐day‐old EBs, MONs, MACs, and OCs. Expression is normalized to hiPSCs, GAPDH expression was used as housekeeping control. Shown are data of three independent experiments. For statistical analysis, Kruskal‐Wallis test and Dunn's multiple comparisons were used (Table S3). (C,D) Quantitative analysis of osteoclast morphology parameters. Shown are pooled data from three independent experiments. For statistical analysis, Kruskal‐Wallis test and Dunn's multiple comparisons were used (Table S6). (C) Percentage of area covered by osteoclasts of total well area. (D) Osteoclast size in μm2 (left), number of nuclei per osteoclast (middle) and osteoclast density (right). (E) Analysis of the resorption pattern on cortical bone slices. Percentage of the ES to the BS (left), percentage of the trench surface to the total eroded surface (middle), and percentage of the pseudo‐eroded surface to the total bone surface (right). Shown are pooled data of individual bone slices used in three independent differentiation experiments of each cell line (donor P1 and 1‐A n = 23, donor P2 n = 25, 4‐A n = 17). Significance was calculated using Kruskal‐Wallis and Dunn's multiple comparisons test (Table S8). Box‐plots shown in B–E are plotted with median, interquartile range, maximum, and minimum values and all data points. Abbreviations: BS, total bone surface; DAPI, 4′,6‐diamidino‐2‐phenylindole; EB, embryoid body; ES, eroded bone surface; GAPDH, glyceraldehyde‐3‐phosphate dehydrogenase; hiPSC, human induced pluripotent stem cell; MAC, macrophage, MCFC, myeloid‐cell‐forming complex; MON, monocyte‐like cell; OC, osteoclast; PBMC, peripheral blood mononuclear cell; qRT‐PCR, quantitative reverse transcription polymerase chain reaction; TRAcP, tartrate resistant acid phosphatase.
To evaluate the efficiency of our osteoclast differentiation protocol and to investigate osteoclast morphology, we quantified the osteoclast yield in more detail. Interestingly, the time between seeding of monocytes and the formation of the first visible osteoclasts was highly dependent on the donor, but not on the origin (primary or hiPSC) of the cells (Figure S7, Table S7). Thus, in order to compare osteoclast differentiation and morphology between different donors, cells for quantitative analysis from all donors were fixed 4 days after the appearance of the first osteoclasts. Osteoclasts differentiated from hiPSCs covered a larger area of the culture dish surface than PBMC‐derived osteoclasts (Figure 3C). In contrast, we determined that numbers of hiPSC‐derived osteoclasts per area were lower compared to PBMC‐derived osteoclasts (Figure 3D, right). The slightly bigger area covered by hiPSC‐derived osteoclasts and the reduced number of osteoclasts/mm2 was in line with an increased size of the osteoclasts and higher number of nuclei per osteoclast, when compared to PBMC‐derived osteoclasts (Figure 3D, Figure S8). Hence, hiPSC‐derived osteoclasts seem to grow bigger in a shorter time period. Nevertheless, we observed no major difference in cell morphology between hiPSC‐derived osteoclasts and osteoclasts differentiated from PBMCs. We estimate that, using our differentiation protocol, we are able to generate 4640 osteoclasts (nine nuclei on average) out of one hiPSC within 3 months.
Subtle differences in resorption behavior of hiPSC‐derived osteoclasts
For further characterization of the resorption ability of hiPSC‐derived osteoclasts, we cultured osteoclasts this time on cortical bone slices instead of dentine, because bovine bone is a more physiological substrate. We showed that there are no significant differences in the total amount of eroded bone surface (Figure 3E left, Table S8). However, there was an insignificant trend toward more bone resorption made by hiPSC‐derived osteoclasts (around 5% of the bone surface) compared to PBMC‐derived osteoclasts (around 3% of the bone surface). Interestingly, we detected that hiPSC‐osteoclasts only superficially eroded 2% of the bone surface (pseudoresorption; Figure S2), whereas for primary osteoclasts this was at a comparable level around 1% (Figure 3E, right). Furthermore, we found that the morphology of the resorption cavities formed by hiPSC‐osteoclasts from different healthy donors were variable: although BIHi004‐A formed around 60% trenches and 40% pits, BIHi001‐A only generated 20% trenches and 80% pits (Figure 3E, middle). The resorption pattern of primary osteoclasts showed an even lower proportion of trenches (10%) and up to 90% pits.
To test our established protocol with additional hiPSC lines, we generated the hiPSC lines isWT1 and isWT7 from dermal fibroblasts of healthy donors. The detailed characterization of the isWT1 and isWT7 hiPSCs proved their pluripotency (Figure S9), differentiation potential (Figure S10), and chromosomal stability (Figure S11 and S12). Applying our differentiation protocol to isWT1 and isWT7 cells and one additional hiPSC line led to terminally differentiated and bone‐resorbing osteoclasts (Figure S13), demonstrating the robustness of our method.
A case of lethal neuronopathic ARO with brain malformation due to compound heterozygous missense mutations in the CLCN7 gene
The male infant was the second child of healthy nonconsanguineous white parents. Beyond the neonatal period from the age of 8 to 10 weeks he exhibited failure to thrive, reduced weight gain, muscular hypotonia, and nystagmus. At the age of 4 months, he developed refractory infantile spasms and progressive developmental delay. Electroencephalogram (EEG) revealed hypsarrhythmia and amplitude depression. The cranial magnetic resonance imaging (MRI) showed a mild reduction of brain volume and subependymal heterotopic bands indicating a neuronal migration disorder (Figure 4A,B). At the age of 7 months, the cerebral ultrasound revealed progressive brain atrophy and a hydrocephalus ex vacuo. Retinal pigmentary changes were diagnosed in fundoscopy. A chest x‐ray showing generalized bone sclerosis hinted toward a neuronopathic form of osteopetrosis (Figure 4C). In the further course of the disease, the infant developed a spastic tetraparesis, dysphagia, and chronic respiratory failure. From the age of 8 months, he had a mild hypochromic anemia. Candidate gene analysis by Sanger sequencing detected the mutations c.875G>A, p.(G292E) and c.1208G>A, p.(R403Q) in the CLCN7 gene in a compound heterozygous state (Figure 4D). Although the latter mutation has already been described in an ARO patient,(24) the c.875G>A mutation was novel. The affected glycine residue is evolutionarily conserved and flanking missense mutations have been previously identified in ARO patients.(25) The child deceased at the age of 14 months as a consequence of progressive respiratory failure. Given the exceptional phenotype of ARO, with predominant neurological symptoms and impaired cortical development, we decided to generate ARO hiPSCs from blood cells for follow‐up investigations (cell line BIHi002‐A(16)).
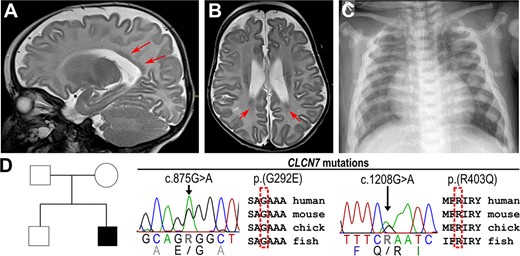
Radiologic images of an ARO patient with compound heterozygous mutations in the CLCN7 gene. (A) T2W sagittal MRI and (B) axial MRI of the head of 4‐month‐old patient with reduced brain volume and periventricular laminar subependymal heterotopias (red arrows). (C) Chest x‐ray of 7‐month‐old patient showing sclerosis and plump configuration of the ribs. (D) Pedigree of the affected family carrying the heterozygous missense mutations c.875G>A p.(G292E) and c.1208G>A p.(R403Q) in conserved regions of the CLCN7 gene. Abbreviations: ARO, autosomal recessive osteopetrosis; MRI, magnetic resonance imaging; T2W, T2‐weighted.
Reduced stability and residual lysosomal localization of the mutated ClC‐7 protein showing reduced ion currents
The pronounced neurological phenotype was reminiscent of patients with an activating ClC‐7 mutation, impairing lysosomal function and reportedly enhancing lysosomal acidification.(9) To decipher the functional consequences of the identified mutations, we first overexpressed both p.(G292E) and p.(R403Q) ClC‐7 in HeLa cells. This approach revealed normal lysosomal localization and co‐localization with OSTM1 of the mutated proteins (Figure 5A, Figure S14). We next analyzed CLCN7 expression levels in undifferentiated ARO hiPSCs in comparison to control hiPSCs. We could not detect any differences in CLCN7 expression at the RNA level (Figure S15, Table S9), whereas immunoblot analysis showed a reduction of ClC‐7 protein levels by 70% in ARO hiPSCs (Figure 5B, Figure S16). However, because residual expression and physiological localization of the ClC‐7 protein were still detectable, we wondered about the electrophysiological features of the mutated Cl−/H+‐exchanger. In comparison to WT ClC‐7 protein, overexpression of the mutants in HEK‐293 cells revealed an ion current density reduced to 13% in cells expressing the ClC‐7 p.(R403Q) protein, whereas ion conductance was completely abolished in ClC‐7 p.(G292E)‐expressing cells (Figure 5C, Figure S17). In aggregation, the mutations lead to lower ClC‐7 protein levels and strongly reduced ion currents hinting primarily at a loss‐of‐function pathomechanism.

Characterization of the degradative pathway in CLCN7 mutant cells. (A) Subcellular localization of ClC‐7 in HeLa cells transfected with WT or mutated hClC‐7 shown by immunostaining: Anti‐ClC‐7 (green), late endosomal/lysosomal marker anti‐LAMP‐1 (red), DAPI (blue). Scale bar = 25 μm. (B) Densitometric quantification of relative ClC‐7 protein levels in undifferentiated control hiPSCs BIHi001‐A (1‐A) and BIHi004‐A (4‐A) and ARO (representative immunoblot shown in Figure S16). Shown are data of three independent experiments (pooled data points of control hiPSCs). ClC‐7 levels were quantified against the loading control GAPDH. Significance was calculated by Mann‐Whitney test (control hiPSCs 1‐A and 4‐A n = 6, ARO hiPSCs n = 3). (C) Electrophysiological analysis in HEK‐293 cells co‐transfected with OSTM1 and either WT or mutated (G292E or R403Q) hClC‐7. Untransfected cells served as NC. Values of p shown were calculated with Dunn's multiple comparisons (compared to WT). (D) Representative LC3 immunoblot of BIHi004‐A and ARO hiPSCs under control culture conditions or starvation with or without autophagy inhibitor CQ. (E) Autophagic flux in BIHi001‐A, BIHi004‐A, and ARO hiPSCs under normal culture conditions and starvation determined by relative LC3‐II protein levels. Shown are pooled data of three independent experiments (n = 6), which were normalized to BIHi001‐A and BIHi004‐A in control culture conditions. Significance was calculated by Wilcoxon matched‐pairs signed rank test. Box‐plots shown in B, C, and E are plotted with median, interquartile range, maximum, and minimum values and all data points. Abbreviations: ARO, autosomal recessive osteopetrosis; CQ, chloroquine; DAPI, 4′,6‐diamidino‐2‐phenylindole; GAPDH, glyceraldehyde‐3‐phosphate dehydrogenase; hiPSC, human induced pluripotent stem cell; LAMP‐1, lysosomal‐associated membrane protein 1; LC3, microtubule‐associated protein light chain 3; NC, negative control; OSTM1, osteopetrosis‐associated transmembrane protein 1; WT, wild‐type.
Lysosomes play a fundamental role in autophagy by fusing with autophagosomes to form autolysosomes. Our analysis of the lysosomal pH in ARO hiPSCs revealed no significant differences compared to control hiPSCs (Figure S18). Nevertheless, we detected an increased level of the autophagy marker LC3‐II in undifferentiated ARO hiPSCs under standard culture conditions (Figure 5D, Figure S18, Figure S19). To determine the autophagic flux, we both induced autophagy by starvation and inhibited the further processing of LC3‐II by chloroquine treatment.(22) Although ARO hiPSCs displayed a higher autophagic flux at control conditions, there was no difference to control hiPSCs under starvation (Figure 5E). Because elevated LC3‐II levels have been described also for murine Clcn7‐deficient tissues,(6) this further corroborates a loss‐of‐function effect.
ARO hiPSCs form enlarged osteoclasts with normal marker gene expression, but without resorptive activity
As a test case for our in vitro model system, we applied the established osteoclast differentiation protocol to the patient‐derived ARO hiPSCs. During all steps of differentiation ARO hiPSCs showed expression of the typical markers like hiPSCs of healthy controls (Figure 6A, Figure S20A). The production of CD45+, CD11b+, CD14+ monocyte‐like cells was even better than in BIHi004‐A hiPSCs and peaked at 1 × 10⁶ cells/well in week three (Figure 2A, Figure S20B,C). ARO osteoclasts were large, multinucleated TRAcP‐positive cells forming a podosome belt and exhibited high expression of CTSK and MMP9 (Figure 6A,B, Figures S20A and S21). In addition, we also differentiated osteoclasts from PBMCs derived from the same patient. No significant differences in morphology or characteristics in the TRAcP‐Phalloidin‐DAPI staining were detectable between both osteoclasts (Figure 6B). Our quantification analysis revealed that osteoclasts differentiated from ARO hiPSCs had a larger diameter and displayed higher numbers of nuclei compared to hiPSC‐osteoclasts from healthy controls (BIHi001‐A and BIHi004‐A), resulting in a lower number of osteoclasts per surface unit (Figure 6C). Notably, compared to the healthy control (Figure 3A), neither PBMC‐derived nor hiPSC‐derived ARO osteoclasts showed any sign of bone resorption activity (Figure 6B), suggesting that ARO hiPSC‐derived osteoclasts reproduced the expected cellular phenotype.
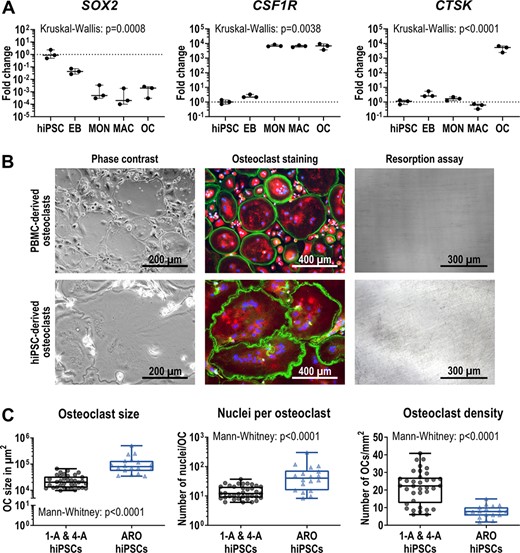
Characterization of osteoclasts differentiated from ARO hiPSCs. (A) Expression of pluripotency marker SOX2, monocytic marker CSF1R and osteoclast marker CTSK determined by qRT‐PCR analysis in ARO hiPSC‐derived cells in undifferentiated hiPSCs, 4‐day‐old EBs, MONs, MACs, and OCs. Expression is normalized to hiPSCs, GAPDH expression was used as housekeeping control. Shown are data of three independent experiments. For statistical analysis, Kruskal‐Wallis test and Dunn's multiple comparisons were used (Table S10). (B) Representative images showing osteoclasts in culture (phase contrast), stained osteoclasts (Phalloidin in green, TRAcP in red, DAPI in blue) and lack of osteoclast‐mediated resorption (resorption assay shows no black stained resorption cavities on dentine, see Figure 3A for comparison). Osteoclasts were differentiated from ARO patient‐derived PBMCs and BIHi002‐A ARO hiPSCs. (C) Osteoclasts differentiated from BIHi001‐A (1‐A), BIHi004‐A (4‐A), and ARO hiPSCs quantified according to their size in μm2 (left), the number of nuclei per osteoclast (middle), and the osteoclast density (right). Shown are pooled data of three independent differentiation experiments of each cell line (control hiPSCs 1‐A and 4‐A n = 36, ARO hiPSCs n = 18). Significance was calculated using Mann‐Whitney test. Box‐plots shown in A and C are plotted with median, interquartile range, maximum, and minimum values and all data points. Abbreviations: ARO, autosomal recessive osteopetrosis; DAPI, 4′,6‐diamidino‐2‐phenylindole; EB, embryoid body; hiPSC, human induced pluripotent stem cell; MAC, macrophage; MON, monocyte‐like cell; PBMC, peripheral blood mononuclear cell; OC, osteoclast; qRT‐PCR, quantitative reverse transcription polymerase chain reaction; TRAcP, tartrate resistant acid phosphatase.
DISCUSSION
CLCN7‐related ARO is a rare genetic bone disorder due to defects in bone resorption by osteoclasts. Investigations of the pathomechanisms of ARO are important for determining the molecular effects of individual mutations as well as for providing guidance for therapeutic strategies. Although these experiments are mostly performed in mouse models, the results from these animal model experiments can often not be extrapolated to humans. Besides, the use of animal models is increasingly criticized for ethical reasons. As an alternative approach, primary patient‐derived cells can be used; however, the access to biopsy material is usually limited. For osteopetrosis, PBMC‐derived osteoclasts provide a good model, but the quality of blood samples is often compromised due to prolonged transport and storage. In addition, only a limited number of experiments can be performed as in vitro expansion of these primary cells is not feasible.
Several osteoclast differentiation protocols from hiPSCs have been published. In 2009, Choi et al.(26) differentiated human ESCs and iPSCs using time‐consuming techniques as Percoll gradient centrifugation and cell selection by surface marker expression for progenitor enrichment. Grigoriadis et al.(15) described a protocol utilizing five different differentiation media including up to seven cytokines and supplements. More recently, Jeon et al.(13) developed a more simplified osteoclast differentiation method based on only three media and in total three different cytokines. However, the efficiency of the osteoclast differentiation or the number of produced monocytes were not specified, but appeared rather low. In 2017, Chen et al.(12) presented their osteoclast differentiation protocol, which includes only one single monocyte harvesting step and required up to six cytokines and supplement additives in four differentiation media. Finally, Cui et al.(11) published a differentiation approach in 2019 using three different differentiation media based on expensive STEMdiff APEL 2 medium supplemented with up to eight cytokines and small molecules. Furthermore, the protocol does not include a monocyte production step, lasts up to 5 weeks, and the differentiation efficiency of 1.5% is low. By contrast, the osteoclast differentiation technique described here allows the continuous harvesting of monocyte‐like cells over at least 9 weeks. We only use three differentiation media supplemented with only three or two cytokines and first osteoclasts emerged already after 4 weeks. The resulting osteoclast density of 41% on average and up to 73% in some experiments is very high.
Our in‐depth characterization by flow cytometry, qRT‐PCR, and expression profiling showed mesodermal induction in the first step, monocyte‐like cell production in the second step, and the generation of macrophages and osteoclasts in the final, third differentiation step. Terminally differentiated osteoclasts obtained by this procedure were multinucleated and displayed the characteristic podosome belt necessary for the sealing zone formation and thus the resorption process.(27)
The crucial criterion for successful osteoclast formation is bone resorption activity. Both, pits and trenches were generated by hiPSC‐derived osteoclasts on dentine as well as on bovine cortical bone. Osteoclasts from BIHi004‐A hiPSCs showed significantly more trenches than those from BIHi001‐A and PBMCs; however, a large variability between different iPSC lines and their capacity to differentiate into specific cell types has been reported.(28) It has been demonstrated that osteoclasts making trenches reflect a more effective way of bone resorption.(19,29) Because we find that the proportion of trenches made by hiPSC‐derived osteoclasts is equal or higher than for PBMCs‐derived osteoclasts this highlights that iPSC‐derived osteoclasts are effective at performing bone resorption. It has been shown that 67% of the variation in trenches between different osteoclast donors can be explained by the protein levels of activated cathepsin K.(30) Although we did not observe large differences in CTSK expression at messenger RNA (mRNA) level between PBMC‐derived and hiPSC‐derived osteoclasts, higher protein levels of activated cathepsin K in the latter could be a possible explanation. Moreover, it was clearly demonstrated that the level of multinucleation strongly facilitates trench‐making osteoclasts, but not those that make pits. This is in line with our observation, because the increased fusion of hiPSC‐derived osteoclasts correlated with a higher proportion of trenches. Recent studies suggest this might be linked to the expression of Dendritic cell–specific transmembrane protein (DC‐STAMP).(31) However, the only gene known to be involved in osteoclast fusion more highly expressed in hiPSC‐derived osteoclasts is CCL2. Again, this does not exclude differences in protein levels not correlating with mRNA levels.
To a large extent, osteoclasts derived from hiPSC lines tended to generate more “pseudoresorption”, reflecting a superficial staining of the bone surface without cavitation. Thus, only mild demineralization has been switched on, but collagenolysis apparently has not. We recently described a similar behavior of LRRK1‐deficient osteoclasts.(18) Since we observed that iPSC‐derived osteoclasts often become larger than PBMC‐derived osteoclasts, it is conceivable that the increased level of pseudoresorption of hiPSC‐osteoclasts could be a secondary effect of very large osteoclasts having problems to polarize properly and/or to form a proper sealing zone. Interestingly, we observed that large osteoclasts generated from human HSCs showed both an enhanced resorptive activity, but also increased levels of pseudoresorption (Hennig, unpublished observations). Because hiPSC‐derived osteoclasts share these characteristics with osteoclasts differentiated from HSCs, but not with PBMC‐derived osteoclasts, this hints at a difference in the maturation of these cells. This phenomenon is mirrored by the production of CD34+ HSC‐like cells during the first days of monocyte production. In addition, although typical osteoclast marker genes such as CTSK were expressed at equal levels in hiPSC‐osteoclasts and PBMC‐osteoclasts, hiPSC‐osteoclasts showed higher levels of macrophage marker genes such as MAF and CSF1R, which can be interpreted as a sign of lower maturation of these cells. It is not unusual that hiPSC‐derived cells are less mature than their primary counterparts. For example, cardiomyocytes derived from hiPSCs first show characteristics typical for fetal cardiomyocytes, although the hiPSCs were generated from adult cells.(32)
To demonstrate the usability of our osteoclast differentiation protocol for functional investigations, we applied it to the patient‐derived osteopetrotic hiPSC line BIHi002‐A.(16) The donor was diagnosed with ARO by a chest x‐ray at the age of 7 months. Before this, the failure to thrive and neurological symptoms beginning at 4 months of age were interpreted as signs of a mitochondriopathy or a lysosomal storage disease. The MRI images of the central nervous system are highly reminiscent of a case with OSTM1 mutations described by Maranda et al.(33) Also in this case, heterotopias and global cortical atrophy were observed. Similar to our case, this patient started to have seizures at 4 months of age and died at 1 year of age. In humans as well as in mice, (“grey lethal” mutants) OSTM1 deficiency leads to a more severe brain phenotype than loss of CLCN7. It is currently unknown whether the OSTM1‐ARO developmental brain phenotype is solely due to lysosomal dysfunction because a role of this protein in cytoskeletal organization and Wnt‐signaling was also discussed.(34,35) The formation of enlarged osteoclasts with enhanced multinucleation is also a typical feature of osteoclasts with both CLCN7 and OSTM1 deficiency.(36,37) As a possible explanation, Pata and Vacher(36) discussed the dysregulation of the calcium and NFATc1 pathway and an indirect compensation mechanism due to the resorption inability in their Ostm1‐knockout mouse. Neutzky‐Wulff et al.(37) proposed that the absence of apoptotic factors normally released during the resorption process may expand lifespan and fusion of ClC‐7 deficient osteoclasts. In the light of the overlap of the cellular and clinical phenotype of OSTM1‐deficient and CLCN7‐deficient mouse mutants and human patients, we suggest that the main pathomechanism in both cases is primarily a defective lysosomal ion homeostasis. Possibly, an early onset of severe lysosomal perturbation during postnatal brain maturation might affect neuronal migration leading to the observed heterotopias. OSTM1 needs to bind to ClC‐7 to exit the endoplasmic reticulum and for correct targeting.(21,38) Although we found that overexpressed ClC‐7 harboring the mutations p.(G292E) or p.(R403Q) delivers OSTM1 to the lysosome, OSTM1 surface expression was barely detectable upon co‐expression with plasma membrane‐localized mutant ClC‐7 (data not shown). If OSTM1 would play a role independent of ClC‐7, the remaining and correctly targeted OSTM1 should be sufficient to prevent the phenotype, which is not the case.
The brain abnormalities of our patient appeared disproportionally severe compared to the degree of osteosclerosis and tardive bone marrow failure. The mutation p.(R403Q) was described in combination with the mutation p.(G521R) in another patient with global brain atrophy.(24) Because a heterozygous CLCN7 gain‐of‐function mutation leading to increased lysosomal acidification and swelling was recently described that caused an exceptional neurological phenotype without bone involvement, we tested for the electrophysiological properties of the mutated ClC‐7.(9) Although the severe amino acid exchange p.(G292E) completely abolished function, currents elicited by p.(R403Q) were changed in quantity (13% of WT levels), but not in quality. Because we previously found in transgenic experiments that 25% to 30% residual ClC‐7 expression is needed for full cellular functionality, we assume that the overall reduced ClC‐7 protein levels and the reduced currents for p.(R403Q) are far below this threshold.(39)
To address the possible role of abnormal lysosome functionality in the observed phenotypes we investigated the lysosomal pH. Lysosomal pH remained unchanged in osteopetrotic hiPSCs, and these findings correlate with previous investigations in mouse fibroblasts, neurons, and macrophages from Clcn7‐knockout mice.(4,40) The reason for the unchanged lysosomal pH is still unclear and controversially discussed. It has been shown that other cation channels support lysosomal acidification and ClC‐7 is not essential.(7,40) However, ClC‐7 probably regulates lysosomal function through intraluminal chloride concentrations and impacts lysosomal ion homeostasis in general.(41–43) However, we further investigated autophagy in ARO hiPSCs, because Wartosch et al.(6) and Weinert et al.(44) reported accumulation of the autophagy marker LC3‐II in Clcn7‐deficient murine tissues. Under normal culture conditions we observed similarly elevated levels of the autophagy marker LC3‐II and an increase in the autophagic flux. Under starvation, however, this difference vanished, implying similar autophagy levels at maximum stimulation. Enhanced LC3‐II levels might be due to a reduced turnover of autophagosomes, as the intra‐autophagosomal LC3‐II is only degraded by lysosomal proteases after fusion of the autophagosome with the lysosome and it was proposed that proteins are degraded with slower kinetics in ClC‐7 knockout cells.(45) Interestingly, perturbed autophagy is the basis for several neurodevelopmental disorders.(46)
In future studies, poorly understood aspects of the osteopetrotic phenotype like the enlarged osteoclasts, the unchanged lysosomal pH or the defective autophagic flux could be molecularly dissected using engineered hiPSCs. Moreover, therapeutic approaches, including the research for novel targeted therapies, could be pursued in osteopetrotic hiPSC lines like the one presented here. Our novel differentiation protocol also might prove valuable for in vitro disease modeling of other osteoclast‐related pathologies.
ACKNOWLEDGMENTS
This project was part of the BCRT crossfield project GenoPro and was supported by the Berlin Institute of Health (BIH) through a BIH translational PhD grant to Uwe Kornak and Zsuzsanna Izsvák. This work was supported by the German Federal Ministry of Education and Research/German Center for Cardiovascular Research (to Lukas Cyganek), and by the German Research Foundation (SFB1002 S01 to Lukas Cyganek). This work was partly funded by the funding program of the academic grants committee of the Charité – Universitätsmedizin Berlin. Support was also provided by the Helmholtz Association through program‐oriented funding and by the Federal Ministry of Education and Research, Germany, in the Programme HealthResearch (BCRT grant no. 13GW0098 and 13GW0099) and the European Community's Seventh Framework Programme under grant agreement no. 602300 (SYBIL) to Uwe Kornak. We thank Frank Konietschke and Asanka Gunawardana for their statistical advice and multiple helpful discussions. We are grateful to the BIH Core Facility Stem Cells for helpful advice and technical assistance regarding hiPSCs. We thank Jean‐Marie Delaissé for inspiring discussions on osteoclasts and the initiation of a fruitful collaboration. We thank Jacob Bastholm Olesen for excellent technical assistance with the resorption analysis. We are grateful to Nico Lachmann and his team for their helpful advice regarding the initial steps of the hematopoietic differentiation process. Many thanks to Katriina Aalto‐Setälä from Tampere University for providing one of the used induced pluripotent stem cell lines. The authors thank the UMG Stem Cell Unit for excellent technical support. The antibody H4A3 developed by August, J.T. / Hildreth, J.E.K. was obtained from the Developmental Studies Hybridoma Bank, created by the NICHD of the NIH and maintained at The University of Iowa, Department of Biology, Iowa City, IA 52242. Open Access funding enabled and organized by Projekt DEAL.
Author contributions: Study design: Uta Rössler, Anna Floriane Hennig, Zsuzsanna Izsvák, Uwe Kornak. Study conduct: Uta Rössler, Anna Floriane Hennig, Uwe Kornak. Data collection: Uta Rössler, Anna Floriane Hennig, Nina Stelzer, Shroddha Bose, Johannes Kopp, Lukas Cyganek, Giovanni Zifarelli, Salaheddine Ali, Maja von der Hagen, Elisabeth Strässler, Gabriele Hahn. Data analysis: Uta Rössler, Anna Floriane Hennig, Shroddha Bose, Johannes Kopp, Kent Søe, Lukas Cyganek, Giovanni Zifarelli, Salaheddine Ali, Maja von der Hagen, Tobias Stauber, Uwe Kornak. Data interpretation: Uta Rössler, Anna Floriane Hennig, Kent Søe, Lukas Cyganek, Michael Pusch, Tobias Stauber, Manfred Gossen, Harald Stachelscheid, Uwe Kornak. Writing manuscript: Uta Rössler, Anna Floriane Hennig, Uwe Kornak. Revising manuscript content: Uta Rössler, Anna Floriane Hennig, Kent Søe, Lukas Cyganek, Tobias Stauber, Zsuzsanna Izsvák, Manfred Gossen, Harald Stachelscheid, Uwe Kornak. Approving final version of manuscript: all authors; The following individuals take responsibility for the integrity of the data analysis: Uta Rössler, Anna Floriane Hennig, Uwe Kornak.
DISCLOSURES
The authors report no conflict of interest.
PEER REVIEW
The peer review history for this article is available at https://publons.com/publon/10.1002/jbmr.4322.
DATA AVAILABILITY STATEMENT
Data are available upon request.
