


ABSTRACT
Since a key function of Wnt1 in brain development was established early on through the generation of non‐viable Wnt1‐deficient mice, it was initially surprising that WNT1 mutations were found to cause either early‐onset osteoporosis (EOOP) or osteogenesis imperfecta type XV (OIXV). The deduced function of Wnt1 as an osteoanabolic factor has been confirmed in various mousemodels with bone‐specific inactivation or overexpression, but mice carrying disease‐causing Wnt1 mutations have not yet been described. Triggered by the clinical analysis of EOOP patients carrying a heterozygous WNT1 mutation (p.R235W), we introduced thismutation into themurine Wnt1 gene to address the question of whether this would cause a skeletal phenotype. We observed that Wnt1+/R235W and Wnt1R235W/R235W mice were born at the expected Mendelian ratio and that they did not display postnatal lethality or obvious nonskeletal phenotypes. At 12 weeks of age, the homozygous presence of the Wnt1 mutation was associated with reduced trabecular and cortical bone mass, explained by a lower bone formation rate compared with wild‐type littermates. At 52 weeks of age, we also observed a moderate bone mass reduction in heterozygous Wnt1+/R235W mice, thereby underscoring their value as amodel of WNT1‐dependent EOOP. Importantly, when we treated wild‐type and Wnt1+/R235W mice by daily injection of parathyroid hormone (PTH), we detected the same osteoanabolic influence in both groups, together with an increased cortical thickness in themutant mice. Our data demonstrate the pathogenicity of the WNT1‐R235W mutation, confirm that controlling skeletal integrity is the primary physiological function of Wnt1, and suggest that osteoanabolic treatment with teriparatide should be applicable for individuals with WNT1‐dependent EOOP. © 2020 The Authors. Journal of Bone and Mineral Research published by Wiley Periodicals LLC on behalf of American Society for Bone and Mineral Research (ASBMR).
Introduction
The skeleton is a highly complex tissue that is continuously remodeled in a process mediated by the coordinated activities of bone‐forming osteoblasts and bone‐resorbing osteoclasts.(1) Since these two cell types are fundamentally different in terms of progenitor cells, morphology, and mode of action, their differentiation and activity is controlled by different sets of molecules.(2,3) With respect to bone formation, the identification of activating and inactivating LRP5 mutations in individuals with osteosclerosis or osteoporosis, respectively, was extremely informative and established Wnt signaling as a major pathway controlling osteoblast activity.(4–6) In fact, since Lrp5 had been shown to act as a co‐receptor for ligands of the Wnt family, many mouse models have been generated and analyzed to demonstrate the impact of specific Wnt signaling regulators on bone remodeling.(7) Although not all of the proposed molecular interactions have been proven physiologically relevant, there is strong evidence that the inhibitory effect of sclerostin on bone formation is mediated by antagonism of Lrp5.(8–12) What is still unknown, however, is the nature of the ligand‐activating Lrp5 to stimulate osteoblast activity. This explains the relevance of several studies that have identified WNT1 mutations in individuals with either early‐onset osteoporosis (EOOP) or osteogenesis imperfecta type XV (OI‐XV).(13–16)
The Wnt1 gene, originally termed Int‐1, was first identified as a frequent target for insertional activation by the mouse mammary tumor virus.(17) When it became evident that this gene encodes a member of a protein family with similarities to the product of the Drosophila wingless gene, a new nomenclature was initiated and the Wnt family of secreted glycoproteins was established.(18) A key role of the murine Wnt1 gene for brain development was established early on through the generation of two mouse deficiency models, both displaying early postnatal lethality.(19,20) Shortly thereafter it was reported that swaying mice, which display a severe cerebellar defect, also causing a high postnatal lethality rate, carry a single base‐pair deletion in the third exon of Wnt1, causing a frame shift and premature termination of protein synthesis.(21) Given the strong impact of murine Wnt1 on brain development, it was initially surprising that WNT1 mutations were identified in individuals with EOOP or OI‐XV. Importantly, however, when the Wnt1sw/sw mice were analyzed for their skeletal phenotype, it became evident that they also display osteoporosis.(22) Meanwhile, it was reported that inactivation of Wnt1 in osteoblast lineage cells causes low bone mass with accompanying fractures, and we could additionally demonstrate that inducible Wnt1 expression in osteoblasts causes a rapid osteoanabolic response, which does not require Lrp5.(23–25)
Although these studies have established a key role of Wnt1 for skeletal integrity, a knock‐in model for Wnt1‐dependent low bone mass disorders has not been established so far. Therefore, the aim of our study was to develop and to characterize a mouse model carrying a pathogenic mutation of Wnt1 (p.R235W), which we identified in individuals with EOOP.
Materials and Methods
Patient analysis
As recently published, we identified a family with EOOP, where a heterozygous WNT1 mutation, Arg.235Trp, was detected in the previously reported index patient (female, age 78 years) by using an individualized SureSelectXT gene panel (comprising 373 bone‐affecting genes).(13,25) Through subsequent segregation analysis via Sanger sequencing, four more affected family members were identified. We here present data for three affected relatives (son [case 1, age 50 years]; daughter [case 2, age 56 years]; and granddaughter [case 3, 12 years]) of the index patient, who presented at our specialized outpatient clinic at the National Bone Board of the University Medical Center Hamburg‐Eppendorf. For all three patients, we collected serum and urine samples in order to assess biochemical parameters of bone turnover. Measured markers included osteocalcin (μg/L), bone alkaline phosphatase (BAP, μg/L), and deoxypyridinoline/creatinine (Dpd/Crea, nmol/mmol). Detailed skeletal assessment consisted of areal bone mineral density measurement by dual‐energy X‐ray absorptiometry (DXA; Lunar iDXA, GE Lunar, Madison, WI, USA), as well as high‐resolution peripheral quantitative computed tomography (HR‐pQCT; XtremeCT, Scanco Medical, Bruttisellen, Switzerland), which was performed as described previously.(26) The latter data sets were compared with site‐specific age‐ and sex‐matched reference values (% median).(27,28) In addition, in the context of osteosynthesis due to distal femur fracture in case 2 or proximal femur fracture in case 3, iliac crest bone biopsies were obtained, and undecalcified histological analysis was carried out according to our standard protocol.(29) We further used tetracycline labeling (two times 1 g tetracycline hydrochloride with an interval of 5 days) to investigate bone formation in case 2. Both biopsies were compared with age‐ and sex‐matched control biopsies (Supplemental Fig. SS1) from our archive, which were obtained in the context of two previous studies.(30,31) This study was performed in accordance with the local ethics committee (PV5364) and the Declaration of Helsinki as informed consent was given by all patients or parents.
Cell culture
The mesenchymal cell line ST2 (obtained from DSMZ, Braunschweig, Germany) was cultured in α‐MEM (Merck KGaA, Darmstadt, Germany) supplemented with 10% fetal calf serum (GE Healthcare, Piscataway, NJ, USA) and 100 U/mL penicillin‐streptomycin (Thermo Fisher Scientific, Waltham, MA, USA). To analyze the influence of Wnt1 on these cells, we took advantage of the plasmid pLNCX‐Wnt1 (kindly provided by Dr J Kitajewksi). Here we introduced the R235W mutation by the QuikChange II system (Agilent Technologies, Santa Clara, CA, USA) according the manufacturer's instructions. The presence of the introduced mutation was verified by Sanger sequencing (Microsynth AG, Balgach, Switzerland). For transfection of ST2 cells, we took advantage of the Lipofectamine 2000 system (Thermo Fisher Scientific). More specifically, we transfected cells with empty vector (plasmid pLNCX), the Wnt1 expression plasmid, or the Wnt1‐R235W expression plasmid for 24 hours. Subsequently, the cells were treated with 300 U/mL G418‐BC (Merck KGaA) for 5 days to select for stably transfected cells. After replating the surviving cells, we induced osteogenic differentiation by adding 50 μg/mL ascorbic acid and 10 mM ß‐glycerophosphate to the medium. After 15 days of differentiation, alizarin red staining was performed and quantified as previously described.(32) Moreover, RNA was isolated at day 15 of differentiation for gene expression analysis. To analyze immediate influences on gene expression, we also performed transient transfection experiments where we isolated RNA for qRT‐PCR analysis 24 hours after transfection. In these experiments, we also transfected the plasmids containing wild‐type and mutant Wnt1 in a 1:1 ratio to analyze for a potential dominant negative influence of the R235W mutation.
Expression analysis
RNA isolation was performed using the Nucleospin RNA II kit (Macherey‐Nagel GmbH & Co. KG, Duren, Germany). The concentration of RNA was measured using a NanoDrop ND‐1000 system (Thermo Fisher Scientific). For qRT PCR expression analysis, the RNA was reverse transcribed using the Verso cDNA Synthesis Kit (Thermo Fisher Scientific) according to manufacturer instructions. The quantitative expression analysis was performed using the StepOnePlus system (Thermo Fisher Scientific) and predesigned TaqMan gene expression assays (Wnt1: Mm01300555_g1; Ibsp: Mm00492555_m1; Apcdd1: Mm01257559_m1; Alpl: Mm00475834_m1; Col1a1: Mm00801666_g1; Bglap: Mm03413826_mH, Thermo Fisher Scientific). Gapdh expression was used as an internal control. Relative quantification was performed according to the ΔΔCT method.
Animals
Wnt1R235W mutant mice (B6;129‐Wnt1tm1Hhtg/Uke) were generated by C57Bl/6J‐derived blastocyst injection of 129Sv‐derived R1 embryonic stem cells modified via homologous recombination with a targeting construct harboring the disease associated Wnt1 c.1035C > T mutation (Gene Bridges GmbH, Heidelberg, Germany). Positive clones were identified by long‐range PCR (primers 5′‐GGG ACC TGA AGA CAC TGC CTT ACC AAG‐3′ and 5′‐GTG TGA CAG TGG TGC GTG ATA ACC AG‐3′) and confirmed by Southern blotting (probe primers 5′‐CAC CCA TTT GTA GGG GGA CC‐3′ and 5′‐GCC AAG GAT AGA GTC GGA GC‐3′) after restriction of genomic DNA with MunI. F1 mice were crossed with a Flp‐deleter line (B6.SJL‐Tg(ACTFLPe)9205Dym/J) to remove the neomycin cassette before backcrossing with C57Bl/6J. Genotyping was performed using the primers 5′‐GGC TCC ATG GCA CAC TTT TG‐3′ and 5′‐AAG CTC GGG AGA GAG GAA GT‐3′ detecting a 144 bp wild‐type or 216 bp Wnt1‐R235W allele. For Sanger sequencing of the mutation site, the primers 5′‐TTC CAC AGC ATC GAC GTG AC‐3′ and 5′‐TAG GGA CCC GAG AGA CAA GG‐3′ were utilized. Mice were housed in a specific pathogen‐free environment with a 12‐hour light/dark cycle, 45% to 65% relative humidity and 20°C to 24°C ambient temperature in open or individually ventilated cages with wood shavings bedding and nesting material in groups not surpassing 6 animals. Mice had ad libitum access to tap water and standard rodent chow (1328P, Altromin Spezialfutter GmbH & Co. KG, Lage, Germany). For further analysis, animals were anesthetized by exposure to a 80% CO2, 20% O2 gas mixture and subsequently euthanized by inhalation of 100% CO2. Successful euthanization was ensured by cardiac puncture. All animal experiments were in accordance with the local implementation of EU Directive 2010/63/EU for animal experiments and were approved by the Ethics Committee of the University Medical Center Hamburg‐Eppendorf and by the “Behörde für Soziales, Familie, Gesundheit, und Verbraucherschutz” (G13/151, G16/117, Org529, Org869).
μCT analysis
All skeletons were analyzed by contact radiography (35 kV, 2 s) (Faxitron, Tucson, AZ, USA) after fixation for overall skeletal integrity. For μCT analysis, the right femur of each mouse was fixed and placed into a radiotranslucent sample holder. Scanning and analysis were performed as previously described(12) with a voxel resolution of 10 μm using a μCT 40 desktop cone‐beam μCT (Scanco Medical) according to standard guidelines.(33) Trabecular bone was analyzed in the distal metaphysis in a volume situated 2500 to 500 μm proximal of the distal growth plate. Cortical bone was analyzed in a 1000‐μm‐long volume situated in the middle of the diaphysis. Cortical bone evaluation was performed with a threshold of 300, whereas for trabecular bone, a threshold of 250 was used. The length of the femora was determined by the number of slices containing the bone.
Histological analysis
For bone histology, skeletons were fixed in 3.7% PBS‐buffered formaldehyde for 48 hours before they were transferred into 80% ethanol. The lumbar vertebral bodies L1 to L4 and the left tibia of each mouse were dehydrated in ascending alcohol concentrations, before they were embedded into methylmethacrylate. Sections of 4 μm thickness were cut in the sagittal plane using a Microtec rotation microtome (Tachno‐Med GmbH, Nussloch, Germany). Sections were stained by von Kossa/van Gieson and toluidine blue staining procedures as described previously.(12) Histomorphometry was carried out according to the guidelines of the American Society for Bone and Mineral Research(34) using an OsteoMeasure system (OsteoMetrics Inc., Decatur, GA, USA). For brain histology, the animals (3 mice per genotype) were euthanized and brains were removed and immersed in 4% formaldehyde solution overnight at 4°C. The brains were washed by deionized water, and then free‐floating vibratome slices were rehydrated in descending grades of ethanol (100%, 90%, and then 70%). The slices were stained with 0.5% Cresyl Violet for 4 minutes, and the brain slices were immersed in water containing five drops of absolute glacial acetic acid for 30 seconds. Finally, the sections were dehydrated in ascending grades of ethanol 70%, 90%, and then in 100% for 15 minutes. The brain sections were then cleared in xylene for 5 minutes twice. Finally, all the brain sections were mounted by Entellan medium (Merck KGaA).
Biomarker analysis
For the determination of bone turnover biomarkers, serum of the euthanized mice was collected immediately postmortem. Quantification was performed using antibody‐based detection kits according to the manufacturers' instructions (procollagen I N‐terminal peptide, [PINP]: SEA957Mu, Cloud Clone Corp., Houston, TX, USA; bone‐specific alkaline phosphatase [BALP]: CSBE11914m, Cusabio Technology LLC, Houston, TX, USA; osteocalcin [Ocn]: BT‐470, Alfa Aeser, Tewksbury, MA, USA; Crosslaps [CTx]: AC‐06F1, Immunodiagnostic Systems, Boldon, UK).
PTH treatment
For osteoanabolic PTH treatment, Wnt1R235+/+ and Wnt1+/R235W mice were treated for 4 weeks up to the age of 52 weeks with 80 μg/kg/d hPTH (1‐34) (Bachem Holding AG, Bubendorf, Switzerland) by intraperitoneal injection. Littermate mice were allocated randomly to the treatment group, and endpoint measurements (μCT and histomorphometry) were performed in a blinded fashion. After initiation of treatment, the welfare of mice was assessed daily based on overall appearance and body weight. No unexpected or severe adverse events were observed.
Statistics and data availability
Data were analyzed by Grubbs' test and significant outliers (p < 0.05) were excluded from further analysis. Data sets were analyzed by two‐tailed Student's t test using Excel software (Microsoft Corp., Redmond, WA, USA) when two genotypes were compared. For three groups, one‐way ANOVA with Dunnett's multiple comparison test was applied using Prism software (GraphPad Software Inc., La Jolla, CA, USA). All data are reported as mean ± SD with individual value plots for animal data. A value of p ≤ 0.05 was considered as statistically significant. All data have been provided within the manuscript.
Results
Low bone turnover in patients carrying a heterozygous WNT1‐R235W mutation
For the present study, we focused on three members of previously identified family, where a heterozygous WNT1 mutation (p.R235W) was associated with EOOP. Here we extended our clinical analysis for three affected family members (Fig. 1A). For case 1 (male, age 50 years), who had a history of multiple atraumatic fractures, ie, 23 peripheral fractures and one vertebral fracture with an onset after the age of 20 years (Fig. 1B), osteoanabolic treatment with teriparatide was initiated for 1 year, followed by a single dose of denosumab. After treatment initiation in 2017, no further fracture occurred (Fig. 1B). Biochemical parameters of bone formation were low but increased during teriparatide treatment, whereas Dpd cross‐links varied over time within the physiological range (Fig. 1C). DXA of spine and hip revealed Z‐scores in the osteoporotic range, which hardly increased upon therapeutic intervention (Fig. 1D). Assessment of bone microstructure and volumetric BMD at the distal tibia showed moderately decreased values compared with age‐ and sex‐matched references in both cortical and trabecular parameters, whereas the cortical thickness was found to be predominantly affected (Fig. 1E). However, these parameters did not substantially change over time, regardless of specific therapeutic intervention.
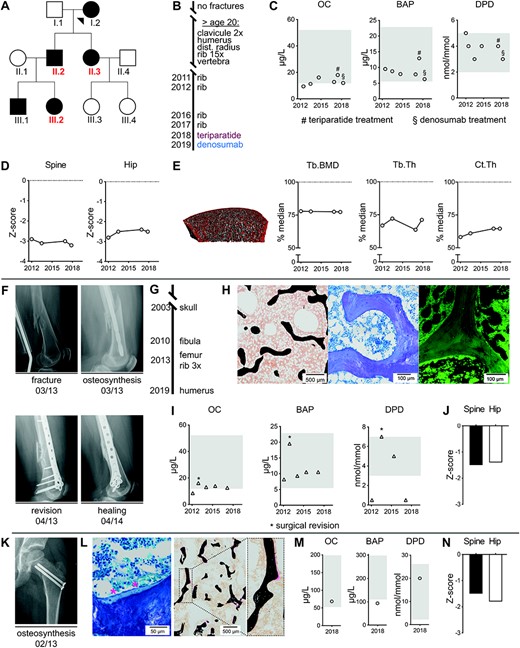
Low bone turnover in patients carrying a heterozygous WNT1‐R235W mutation. (A) Pedigree of a previously described family affected by heterozygous WNT1 mutation Arg.235Trp. The three cases, which were studied in greater detail, are indicated in red. (B) Fracture timeline and treatment history for case 1 (II.2). After initiation of specific treatment, no further fractures occurred until today. (C) Serum levels of osteocalcin (OC), bone‐specific alkaline phosphatase (BAP), and ratio of Dpd/Crea urine levels for case 1 at different time points. Age‐ and sex‐specific reference ranges are indicated in gray. Initiation of teriparatide or denosumab treatment are indicated by # and §, respectively. (D) DXA Z‐scores within osteoporotic range for spine and hip in case 1 at different time points. (E) HR‐pQCT of the distal tibia and quantification of trabecular bone mineral density (Tb.BMD), trabecular thickness (Tb.Th), and cortical thickness (Ct.Th.) revealed reductions compared with age‐ and sex‐matched reference values (median set as 100%).(28) (F) X‐rays for case 2 after femur fracture and initial surgery (upper row). Fracture consolidation was prolonged and healing was documented after surgical revision at month 13 (lower row). (G) Fracture timeline for case 2 (II.3). (H) Representative images of an undecalcified transiliac bone biopsy of case 2 (left, von Kossa/van Gieson staining; middle, toluidine blue staining; right, fluorescent micrograph after tetracycline labeling). (I) Serum levels of OC, BAP, and ratio of Dpd/Crea urine levels for case 2 at different time points. Age‐ and sex‐specific reference ranges are indicated in gray. Asterisks represent measurements in context of surgical revision. (J) DXA Z‐scores for spine and hip in case 2 within the range of osteopenia. (K) X‐ray showing an osteosynthesis in case 3 (III.2) due to traumatic proximal femur fracture at the age of 6 years. (L) Representative images of an undecalcified transiliac biopsy of case 3 obtained in context of osteosynthesis (left, von Kossa/van Gieson staining; right, toluidine blue staining). Thin trabeculae and low osteoid volume as well as flattened osteoblasts (marked by asterisks) display low turnover phenotype. (M) Serum levels at the age of 12 years of OC, BAP, and ratio of Dpd/Crea urine levels for case 3, indicating relatively low bone formation. Age‐ and sex‐specific reference ranges are shown in gray. (N) DXA Z‐scores for spine and hip in case 3 at the age of 12 years.
For case 2 (female, age 56 years), who had at time of presentation a distal femur fracture and prolonged healing after revision surgery (Fig. 1F), seven peripheral fractures (humerus, femur, 4× ribs, fibula) occurring after the age of 40 years were reported in medical reports (Fig. 1G). Healing of the fracture was prolonged with complete consolidation documented 13 months after surgical revision. Further histological analysis of the iliac crest biopsy revealed thin trabeculae with nearly complete absence of osteoid and low numbers of osteoblasts,(25) as well as absence of tetracycline‐labeled bone surfaces (Fig. 1H; Supplemental Fig. SS1). A low bone turnover state was also confirmed by serum analyses, where parameters of bone formation (osteocalcin, BAP) and bone resorption (Dpd/Crea) were consistently at the lower end of the reference range, with the notable exception of one time point, where surgical revision took place (Fig. 1I). In this patient, bone mineral density (BMD) evaluation by DXA in spine and hip revealed Z‐scores within the osteopenic range (Fig. 1J).
In case 3 (female, age 12 years, Tanner stage III), a traumatic proximal femur fracture at the age of 6 years required osteosynthesis and healed without complications or delay (Fig. 1K). The analysis of an iliac crest bone biopsy obtained in context of trauma surgery revealed poor trabecular connectivity, low osteoid volume, and flattened osteoblasts compared with an age control (Fig. 1L; Supplemental Fig. S1) as hallmarks of low bone turnover osteoporosis. Assessment of bone turnover at the age of 12 years revealed low bone formation biomarkers compared with age‐specific reference values, yet Dpd cross‐links were within the normal range (Fig. 1M). In this patient, BMD evaluation by DXA in spine and hip revealed reduced Z‐scores (Z‐score spine −1.5, hip −1.8; Fig. 1N).
Mice carrying the homozygous Wnt1‐R235W mutation are viable
Although our ongoing osteologic examination of EOOP patients confirmed that carriers of a heterozygous WNT1 mutation display a low bone turnover pathology, we intended to generate a corresponding mouse model to prove that the respective mutation is indeed pathogenic. In a first step, we analyzed the influence of the R235W mutation in vitro, taking advantage of a previously published osteogenic influence of Wnt1 overexpression in the mesenchymal cell line ST2.(23) More specifically, we introduced the R235W into a Wnt1 expression plasmid that was used for transfection with subsequent selection by G418‐BC. We then used the stably transfected cells to assess matrix mineralization by alizarin red staining 15 days after the addition of osteogenic medium (Fig. 2A). Here we observed a profound positive influence of the non‐mutated Wnt1 expression plasmid, which was abrogated by the introduced mutation. Consistently, although Wnt1 expression was induced after transfection of both wild‐type and mutant Wnt1, only the non‐mutated construct resulted in a significantly increased expression of the osteoblast differentiation marker Ibsp at day 15 of osteogenic differentiation (Fig. 2B).
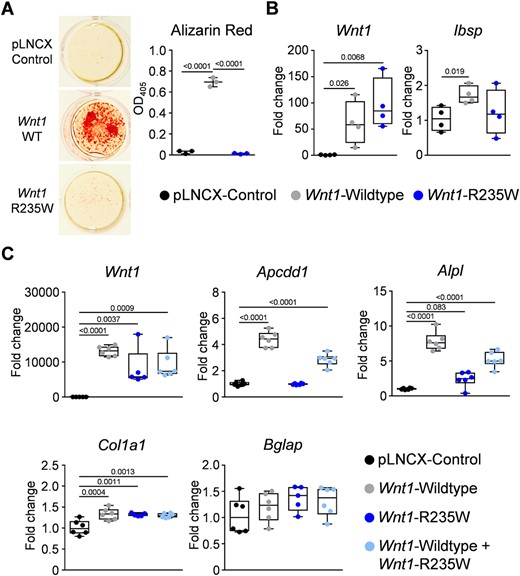
In vitro effect of the Wnt1‐R235W mutation. (A) Representative images and quantification of alizarin red staining of ST2 cells transfected with either empty vector (pLNCX control) or with expression plasmids for wild‐type (Wnt1 WT) or mutant Wnt1 (Wnt1 R235W) after 15 days of osteogenic differentiation. (B) qRT‐PCR monitoring expression of the indicated genes in ST2 cells transfected with the same plasmids after 15 days of osteogenic differentiation. (C) qRT‐PCR monitoring expression of the indicated genes in ST2 cells transiently transfected with the same plasmids and the combination of the wild‐type and mutant plasmid at a 1:1 ratio 24 hours after transfection. Data were analyzed by one‐way ANOVA with Dunnett's multiple comparison test. The p values versus control transfected cells are indicated above the horizontal bars up to a value of 0.1.
We additionally monitored gene expression in ST2 cells 24 hours after transient transfection in order to analyze immediate responses toward Wnt1. In these experiments, we did not only transfect wild‐type and mutant expression plasmids separately but also in a 1:1 ratio. We again observed comparable Wnt1 expression levels after transfection of wild‐type and/or mutant plasmids, but also identified differential effects on the expression of the Wnt signaling target gene Apcdd1 and of the osteoblast marker Alpl (Fig. 2C). In both cases, we observed transcriptional activation after transfection of the wild‐type Wnt1 expression plasmid, which was not observed with the mutant plasmid. Moreover, the intermediate expression levels for both genes in the co‐transfected cells revealed that there is no apparent dominant negative influence of the R235W mutation. Although we did not detect sufficient expression levels for Ibsp in these experiments, we also found that there was only a moderate influence of Wnt1 transfection on the transcription of Col1a1 or Bglap. These collective findings, which ideally need to be supported by unbiased screening approaches in future experiments, strongly suggested that the R235W mutation impairs the osteoanabolic function of Wnt1.
Mice carrying the homozygous Wnt1‐R235W mutation are viable and do not display obvious brain defects
To confirm the in vivo relevance of these findings, we generated a mouse model with ubiquitous presence of the R235W mutation. This was achieved by homologous recombination in embryonic stem cells (Fig. 3A), where positive clones were identified by subsequent long‐range PCR and Southern blotting (Fig. 3B). We then generated heterozygous mice that were crossed with a Flp‐deleter line to remove the selection cassette. Subsequently, an adequate mating strategy was implemented to remove the Flp‐recombinase and to obtain Wnt1+/+, Wnt1+/R235W, and Wnt1R235W/R235W animals. The genotyping of the offspring, performed through sequencing of a corresponding PCR product (Fig. 3C), revealed that mice of all genotypes were born at the expected Mendelian ratio. Most importantly, neither Wnt1+/R235W nor Wnt1R235W/R235W mice displayed early postnatal lethality or any obvious phenotype, which clearly discriminates them from Wnt1sw/sw mice.(21,22) Indeed, no noticeable morphological abnormalities were observed in histological sections of the brains from 4‐week‐old Wnt1+/R235W or Wnt1R235W/R235W mice (Fig. 3D).
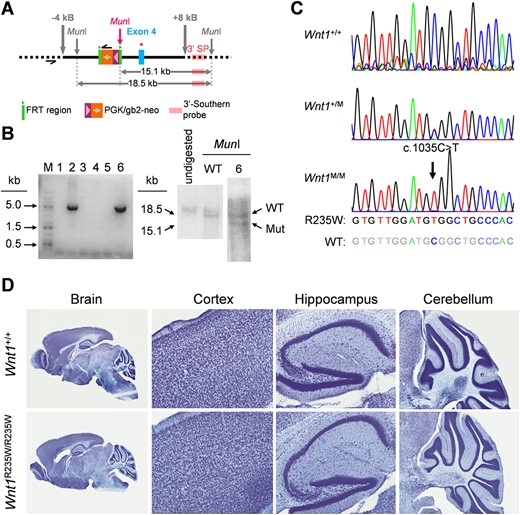
Generation of a mouse model carrying the Wnt1‐R235W mutation. (A) Schematic representation of the targeting construct used to modify the Wnt1 allele in embryonic stem cells via homologous recombination. Black bar = homologous regions used for recombination. Thick gray arrows = extension of the targeting construct from the mutation site in kilo bases. Thin gray arrows = genomic MunI restriction sites. Pink arrow = new MunI restriction site introduced with the targeting construct. Black half‐arrows = primer binding sites for long‐range PCR. Green block = FRT sites. Orange/violet block: neomycin selection cassette. Blue block = exon 4 of Wnt1. Red star = introduced point mutation resulting in the R235W amino acid exchange. Light pink block = binding site for the Southern blot probe. Horizontal gray double arrows = fragments detected by Southern blotting after restriction with MunI. (B) Long‐range PCR gel image with positive signals for the clones 2 and 6 at the expected size of 5 kb (left). Southern blot image of undigested genomic DNA as well as DNA from unmodified cells and clone 6 after restriction with MunI (right). The southern probe detected fragments with sizes corresponding to the wild‐type (18.5 kb) and the mutated (15.1 kb) Wnt1 alleles in clone 6, indicating a heterozygous genotype. (C) Sanger sequencing results of the modified region of Wnt1 in Wnt1+/+, Wnt1+/R235W (Wnt1+/M), and Wnt1R235W/R235W (Wnt1M/M) mice. The black arrow indicates the mutation resulting in the amino acid exchange. (D) Representative histological sections of the brain from 4‐week‐old Wnt1+/+ and Wnt1R235W /R235W mice with detailed images of the cortex, hippocampus, and cerebellum regions.
Mice carrying the homozygous Wnt1‐R235W mutation display osteopenia and reduced bone formation at 12 weeks of age
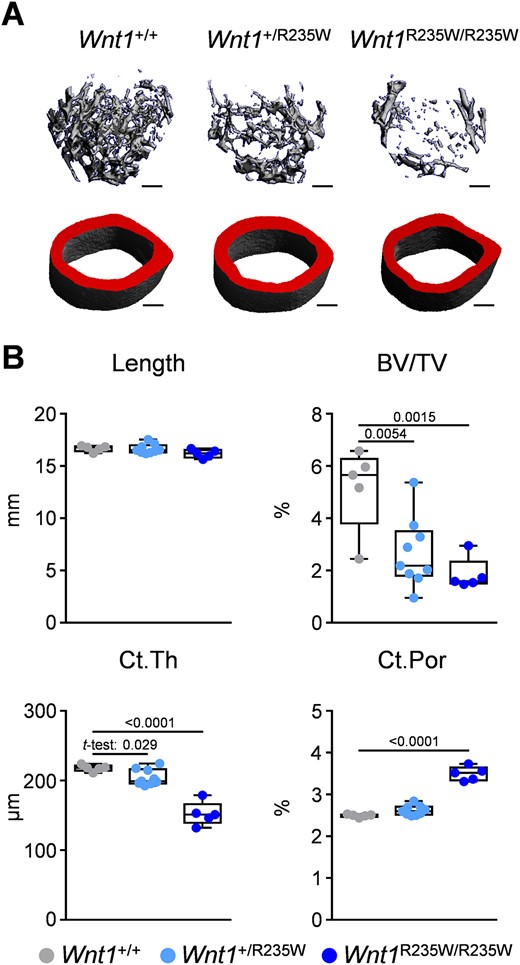
Importantly, the viability of Wnt1+/R235W and Wnt1R235W/R235W mice enabled us to perform a full skeletal characterization compared with wild‐type littermates. Here we first applied μCT scanning of the femoral bones from 12‐week‐old female mice (Fig. 4A). At that age, there was no detectable difference between wild‐type and Wnt1+/R235W animals, yet the Wnt1R235W/R235W mice displayed osteopenia. More specifically, whereas the length of the femora and tissue mineral density were unaffected by the homozygous Wnt1 mutation, the trabecular bone volume was significantly decreased compared with wild‐type controls (Fig. 4B; Supplemental Fig. SS2A). The same was the case for the cortical thickness, yet cortical bone porosity was not affected in Wnt1R235W/R235W animals. In line with the unaltered longitudinal growth, the growth plate morphology of the proximal tibia was unaffected by the Wnt1‐R235W mutation (Supplemental Fig. SS3).
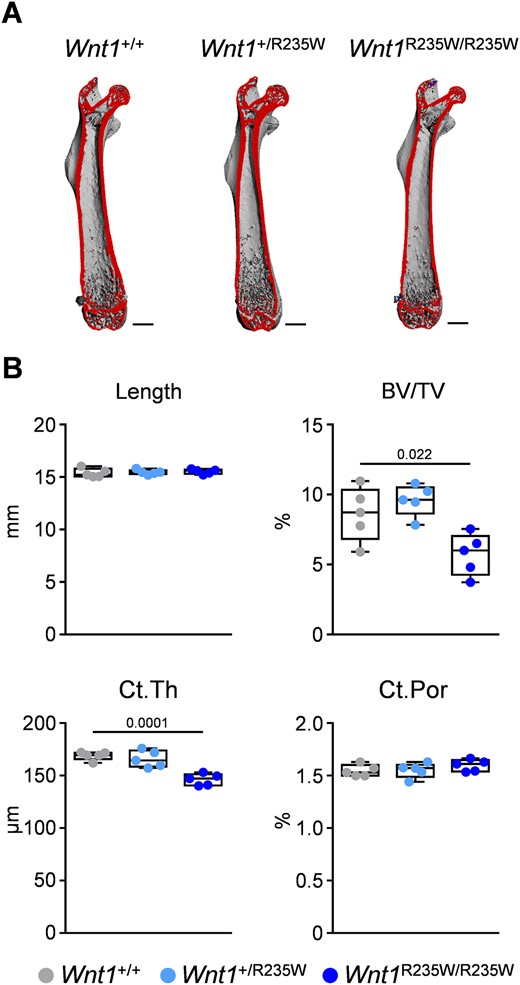
Femoral phenotype of 12‐week‐old female Wnt1+/R235W and Wnt1R235W/R235W mice. (A) Representative μCT images of the femora from Wnt1+/+, Wnt1+/R235W, and Wnt1R235W/R235W mice. The virtual cut plane appears red. Scale bar = 1 mm. (B) μCT‐based quantification of the femur length, trabecular bone volume (BV/TV) in the distal femoral metaphysis, as well as mid‐diaphyseal cortical thickness (Ct.Th) and porosity (Ct. Por) of 12‐week‐old mice with the indicated genotypes. Data were analyzed by one‐way ANOVA with Dunnett's multiple comparison test. The p values are indicated above the horizontal bars up to a value of 0.1.
To study the cellular cause of the Wnt1R235W/R235W phenotype, we applied undecalcified histology on vertebral body sections from the same mice (Fig. 5A) for histomorphometric quantification. Here we did not observe significant differences between the three groups in the trabecular bone or osteoid volume (Fig. 5B). Importantly, however, the bone formation rate was significantly decreased in the Wnt1R235W/R235W group. This observation was supported by significantly decreased serum levels of BALP, although the concentrations of PINP and osteocalcin were not significantly altered (Supplemental Fig. SS4A). Because the quantification of bone cell numbers showed no impact of the R235W mutation (Fig. 5C), these findings suggested that the homozygous Wnt1 inactivation specifically impairs the activity of bone‐forming osteoblasts.
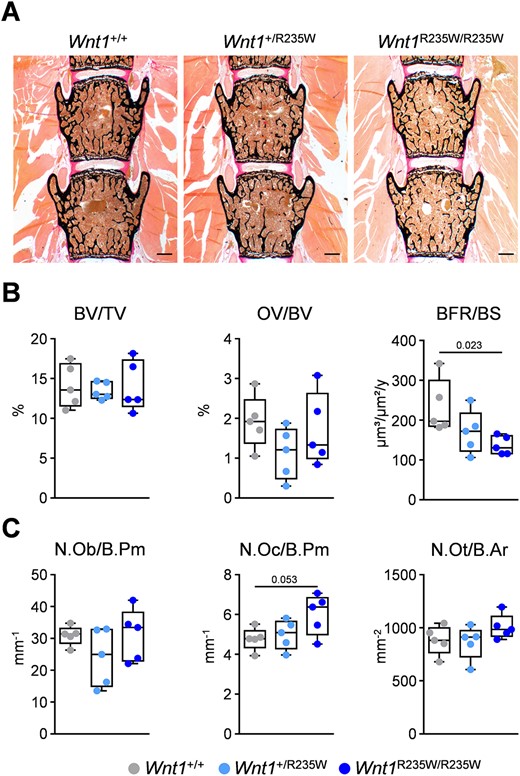
Vertebral body phenotype of 12‐week‐old female Wnt1+/R235W and Wnt1R235W/R235W mice. (A) Representative undecalcified spine sections (vertebral bodies L3 and L4) from mice with the indicated genotypes stained after von Kossa/van Gieson. Scale bar = 500 μm. (B) Histomorphometric evaluation of trabecular bone volume (BV/TV), osteoid volume (OV/BV), and bone formation rate (BFR/BS). (C) Histomorphometric evaluation of osteoblast number (N.Ob./B.Pm), osteoclast number (N.Oc./B.Pm), and osteocyte number (N.Ot./B.Ar). Data were analyzed by one‐way ANOVA with Dunnett's multiple comparison test. The p values are indicated above the horizontal bars up to a value of 0.1.
Mice carrying the heterozygous Wnt1‐R235W mutation display osteopenia at 52 weeks of age
Because the above‐described EOOP patients carry a heterozygous WNT1 mutation, we next addressed the question of whether Wnt1+/R235W mice would display a skeletal phenotype at older age. Therefore, we analyzed the femoral bones of 52‐week‐old female Wnt1+/+, Wnt1+/R235W, and Wnt1R235W/R235W littermates by μCT (Fig. 6A). Although the tissue mineral density remained unaffected (Supplemental Fig. SS2B), we again observed a significant reduction of the trabecular bone volume and cortical thickness in Wnt1R235W/R235W animals, yet at 52 weeks of age, these mice additionally displayed increased cortical porosity (Fig. 6B). Most importantly, when compared with wild‐type littermates, there were also significantly decreased trabecular bone volume and cortical thickness in 52‐week‐old Wnt1+/R235W mice. A similar, albeit less pronounced, cortical bone phenotype was also observed in 52‐week‐old male Wnt1R235W/R235W mice, whereas the trabecular bone mass was not consistently decreased in all animals (Supplemental Fig. SS5). Therefore, although we did not observe spontaneous fractures in any of the analyzed mice, these data provide strong evidence for the pathogenicity of the WNT1‐R235W mutation in individuals with EOOP.
Femoral phenotype of 52‐week‐old female Wnt1+/R235W and Wnt1R235W/R235W mice. (A) representative μCT images of the trabecular bone in the distal femoral metaphysis and mid‐diaphyseal cortical bone from from Wnt1+/+, Wnt1+/R235W, and Wnt1R235W/R235W mice. Scale bar = 300 μm. (B) μCT‐based quantification of the femur length, trabecular bone volume (BV/TV) in the distal femoral metaphysis, as well as mid‐diaphyseal cortical thickness (Ct.Th) and porosity (Ct.Por) of 52‐week‐old mice with the indicated genotypes. Data were analyzed by one‐way ANOVA with Dunnett's multiple comparison test or Student's t test of Wnt1+/R235W versus Wnt1+/+, if indicated. The p values are indicated above the horizontal bars up to a value of 0.1.
Similar to our analysis of the 12‐week‐old mice, we also applied histomorphometry on undecalcified vertebral body sections for the older group of animals (Fig. 7A). At that age, the trabecular bone volume was significantly reduced in Wnt1R235W/R235W mice, yet the bone formation rate and serum PINP concentrations were not different compared with wild‐type littermates (Fig. 7B; Supplemental Fig. SS4B). Instead, we detected an unexpected increase of osteoclast numbers in 52‐week‐old Wnt1R235W/R235W mice, supported by increased CTx serum concentrations, suggesting an age‐dependent shift in bone remodeling, when both alleles of Wnt1 are mutated (Fig. 7C; Supplemental Fig. SS4B). With respect to WNT1‐dependent EOOP, however, it was more relevant to study the phenotype of the 52‐week‐old Wnt1+/R235W group, but here we did not detect specific histomorphometric changes compared with wild‐type controls. These collective findings demonstrate that the homozygous presence of the p.R235W mutation profoundly affects bone remodeling, whereas the heterozygous presence of the same mutation has a moderate yet significant influence on trabecular and cortical bone mass in the femoral bones.
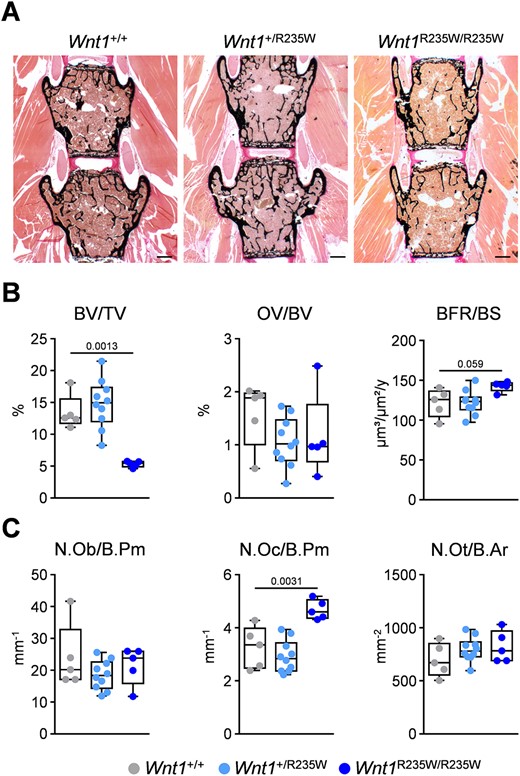
Vertebral body phenotype of 52‐week‐old female Wnt1+/R235W and Wnt1R235W/R235W mice. (A) Representative undecalcified spine sections (vertebral bodies L3 and L4) from mice with the indicated genotypes stained after von Kossa/van Gieson. Scale bar = 500 μm. (B) Histomorphometric evaluation of trabecular bone volume (BV/TV), osteoid volume (OV/BV), and bone formation rate (BFR/BS). (C) Histomorphometric evaluation of osteoblast number (N.Ob./B.Pm), osteoclast number (N.Oc./B.Pm), and osteocyte number (N.Ot./B.Ar). Data were analyzed by one‐way ANOVA with Dunnett's multiple comparison test. The p values are indicated above the horizontal bars up to a value of 0.1.
The heterozygous Wnt1‐R235W mutation does not impair the osteoanabolic influence of PTH injection
We finally took advantage of the Wnt1+/R235W mice to address the question of whether heterozygous Wnt1 inactivation, as it applies for the respective EOOP patients, would impair the responsiveness of osteoblasts to PTH. In fact, because the osteoanabolic effect of intermittent PTH treatment has been linked to activation of Wnt signaling,(25,26) it was reasonable to speculate that Wnt1+/R235W mice might display a reduced response to daily PTH injection. We, therefore, injected PTH for 4 weeks into wild‐type and Wnt1+/R235W littermate mice, starting at the age of 48 weeks until the analysis was performed at 52 weeks of age. We observed a significant increase of trabecular bone formation in vertebral body sections from mice of both genotypes, and the same was the case for the circulating levels of the bone formation biomarker PINP, whereas serum CTX levels were not significantly affected (Fig. 8A). Moreover, as assessed in femoral bones, wild‐type and Wnt1+/R235W mice responded to the same extent to PTH treatment in terms of elevated trabecular and periosteal bone formation rates (Fig. 8B), whereas bone marrow adiposity was not significantly affected (Supplemental Fig. S6). Most importantly, the treatment also led to a significant increase of the cortical thickness in Wnt1+/R235W mice, which abrogated the difference toward wild‐type controls (Fig. 8C).
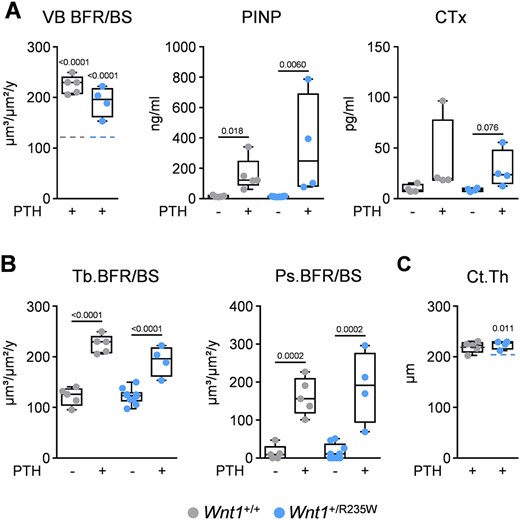
PTH treatment of 52‐week‐old wild‐type and Wnt1+/R235W mice. (A) Trabecular bone formation rate in the vertebral bodies (VB BFR/BS) and serum levels of PINP and CTx of 52‐week‐old female mice after 4 weeks of daily injections of 80 μg/kg hPTH 1–34 (+) in comparison to untreated animals (−). Dashed lines in the first graph represent the mean value of untreated controls from the corresponding genotype. The full data set is shown in Fig. 6B. (B) Quantification of the trabecular (Tb. BFR/BS) and periosteal bone formation rate (Ps.BFR/BS) in femur sections of the same mice. (C) Cortical thickness (Ct.Th.), assessed by μCT, of the same femora. Dashed lines represent the mean value of untreated controls from the corresponding genotype. The full data set is shown in Fig. 5B; sample size n ≥ 4. Data were analyzed by Student's t test. The p values versus control animals of the same genotype are indicated above the horizontal bars up to a value of 0.1.
Discussion
Several studies have identified WNT1 mutations in cases with either EOOP or OI‐XV.(13–16) Whereas the more severely affected individuals with OI‐XV carry homozygous WNT1 mutations, the EOOP patients are heterozygous carriers. Our own genetic analysis of individuals with EOOP, using a custom‐designed gene panel containing all coding exons of 373 genes with relevance in skeletal biology, has identified heterozygous WNT1 mutations in 8.5% of the patients.(25) The majority of these carried the R235W mutation, which is, however, mostly attributable to the identification of one family, where this mutation segregated with EOOP. In the present study, we have extended our clinical analysis for the younger family members, where we identified a low turnover state in two different bone biopsies, which was also supported by serum analyses. Moreover, similar to what we have previously observed in the index patient, the treatment data for her affected son indicated a positive influence of teriparatide therapy, with regard to fracture occurrence—the clinically most important outcome parameter in osteoporosis treatment. This is in agreement with published data on three other cases with WNT1‐dependent EOOP.(37) Although such clinical data are certainly relevant on their own, one key question remained: whether the p.R235W mutation of WNT1 is indeed disease‐causing instead of representing only a risk allele. To address this question in vivo, we introduced the p.R235W mutation into the murine Wnt1 gene, thereby generating the first knock‐in mouse model carrying a ubiquitous Wnt1 mutation identified in patients.
Importantly, whereas Wnt1R235W/R235W mice displayed a detectable skeletal phenotype already at 12 weeks of age, there was also significantly decreased trabecular and cortical bone mass in femoral bones from 52‐week‐old Wnt1+/R235W mice. Together with the reduced osteogenic differentiation of ST2 cells transfected with a mutant Wnt1 expression plasmid, these findings clearly demonstrate the pathogenicity of the WNT1‐R235W mutation. Consistent with previously published data showing that Wnt1 deletion or overexpression in osteoblast lineage cells primarily affects bone formation,(23–25) we found that 12‐week‐old Wnt1R235W/R235W mice displayed a reduced trabecular bone formation rate, which was assessed in spine sections. Of note, this difference was observed before a significant reduction of the trabecular bone volume was identified in the respective vertebral bodies. In line with these results, we observed significantly decreased serum concentrations of BALP. However, other bone formation markers, ie, osteocalcin and PINP, were not altered. Although we cannot explain so far why a reduced bone formation rate in 12‐week‐old animals does not translate in reduced serum levels of all bone formation biomarkers, there are two possible explanations for this inconsistency. First, although the bone formation phenotype of 12‐week‐old Wnt1R235W/R235W mice is significant, it might simply be too moderate to affect serum PINP and osteocalcin levels. Second, since we made a similar observation in a previously characterized mouse line (Col1a1‐Krm2), where Wnt signaling blockade caused severe osteoporosis, nearly absent bone formation, but also normal serum levels of osteocalcin,(38) there might be some specific influence of impaired Wnt signaling on the production and/or release of bone formation biomarkers.
In 52‐week‐old Wnt1R235W/R235W mice, we did observe trabecular osteopenia in the spine, yet at that age, osteoclastogenesis was significantly higher than in wild‐type littermate controls. Although this age‐dependent shift in the bone remodeling status is a potentially interesting observation, it has to be stated that the Wnt1R235W/R235W mice are not comparable to the EOOP patients, since these only carry a heterozygous mutation of the WNT1 gene. Therefore, it was also important that the Wnt1+/R235W mice displayed reduced trabecular and cortical bone mass in the femur at the age of 52 weeks. This led us to take advantage of these animals in order to demonstrate that the heterozygous Wnt1 mutation does not interfere with the osteoanabolic influence of intermittent PTH treatment.
Although our data principally confirm the pathogenicity of the R235W mutation, there are obvious limitations of the respective mouse model. Most importantly, we observed no spontaneous fractures in these mice, unlike what was observed in the respective patients. Moreover, the skeletal phenotype of both Wnt1+/R235W and Wnt1R235W/R235W animals appeared far less severe, when compared with patients carrying heterozygous or homozygous WNT1 mutations. One potential explanation for this inconsistency might be related to the fact that mice, unlike humans, have the ability to synthesize ascorbic acid, which is an important cofactor for bone matrix synthesis.(39) Furthermore, the Wnt1 mutation did not influence the longitudinal bone growth in mice, unlike what has been described for children with a homozygous WNT1 mutation. Additionally, we did not observe bone marrow fibrosis, which differs from findings reported in some patients suffering from Wnt1‐related EOOP.(37) This discrepancy might be based on varying effects of different Wnt1 variants, since this pathology has mostly been described in patients with a Wnt1‐C218G mutation.(40) Although a previous study found an increase of bone marrow adipocytes in some patients with Wnt1‐related osteopathologies after teriparatide treatment,(37) we did not observe such an influence in our mouse line. Again, this could potentially be attributed to the exact involved mutations or to general differences between the murine and human bone metabolism. In summary, there are specific observations that argue against the suitability of the Wnt1+/R235W mice as a model for human EOOP, although these mice displayed a low bone mass phenotype. One possibility for future research might therefore be the development of a mouse model for OI‐XV by introducing another pathogenic mutation into the murine Wnt1 gene in order to reflect the various skeletal pathologies that can be caused by different Wnt1 mutations.
Regardless of these limitations, it is important to state that the Wnt1R235W/R235W mice represent the first animal model carrying a ubiquitous Wnt1 mutation displaying a bone phenotype without associated lethality or obvious defects of the central nervous system. This suggests that the most critical function of Wnt1 is related to bone remodeling, which is further supported by the fact that human WNT1 mutations have only been linked to OI or EOOP so far, ie, there is no WNT1 mutation reported that exclusively affects brain development without influencing the skeleton. Considering that Wnt1 was thought to be primarily required in the central nervous system only 6 years ago, this paradigm shift is quite remarkable. Although it is still required to identify molecular interaction partners and downstream effectors mediating the influence of Wnt1 on osteoblasts, it is important that such a Wnt1 knock‐in model is now available for the scientific community. In fact, these mice can be utilized to address various key questions in future experiments. First, it might be useful to evaluate whether a pathogenic Wnt1 mutation interferes with fracture healing or with the response to mechanical stimulation, where a key role of Wnt1 has been suggested.(41,42) Second, it will be important to apply unbiased screening approaches to understand the mechanisms controlling bone remodeling downstream of Wnt1. Third, and most importantly, it is required to identify a specific receptor for Wnt1, since such a protein could represent a suitable target for osteoanabolic medication. Although it is reasonable to speculate that Wnt1 would mediate its actions on bone formation and matrix quality through one of the 10 known members of the Fzd family,(43) there might be alternative interaction partners because Fzd‐independent Wnt receptor complexes have been identified recently, at least for Wnt7.(44)
Disclosures
All authors state that they have no conflicts of interest.
Acknowledgments
The authors thank Mona Neven, Olga Winter, and Gudrun Arndt for expert technical assistance and the UKE research animal facility for their services.
The research leading to these results has received funding from the Deutsche Forschungsgemeinschaft (SCHI 504/6‐1, DA 1067/5‐1, and YO 299/1‐1), the European Community's Seventh Framework Programme under grant agreement no. 602300 (SYBIL), and the German Federal Ministry of Education and Research (BMBF) within the project “Detection and Individualized Management of Early Onset Osteoporosis (DIMEOS).”
Authors' roles: Study design: TAY, TR, MK, JPD, RO, MA, and TS. Study conduct: TAY, NV, FL, WZ, AB, LR, IH‐B, and AS. Data collection: TR, JS, and RO. Data analysis: TAY, TR, AS, RO, and TS. Data interpretation: TAY, TR, MK, JPD, MA, and TS. Drafting manuscript: TAY, RO, MA, and TS.
References
Author notes
The peer review history for this article is available at https://publons.com/publon/10.1002/jbmr.4043.
