


ABSTRACT
The impact of adult bone traits on changes in bone structure and mass during aging is not well understood. Having shown that intracortical remodeling correlates with external size of adult long bones led us to hypothesize that age‐related changes in bone traits also depend on external bone size. We analyzed hip dual‐energy X‐ray absorptiometry images acquired longitudinally over 14 years for 198 midlife women transitioning through menopause. The 14‐year change in bone mineral content (BMC, R2 = 0.03, p = 0.015) and bone area (R2 = 0.13, p = 0.001), but not areal bone mineral density (aBMD, R2 = 0.00, p = 0.931) correlated negatively with baseline femoral neck external size, adjusted for body size using the residuals from a linear regression between baseline bone area and height. The dependence of the 14‐year changes in BMC and bone area on baseline bone area remained significant after adjusting for race/ethnicity, postmenopausal hormone use, the 14‐year change in weight, and baseline aBMD, weight, height, and age. Women were sorted into tertiles using the baseline bone area‐height residuals. The 14‐year change in BMC (p = 0.009) and bone area (p = 0.001) but not aBMD (p = 0.788) differed across the tertiles. This suggested that women showed similar changes in aBMD for different structural and biological reasons: women with narrow femoral necks showed smaller changes in BMC but greater increases in bone area compared to women with wide femoral necks who showed greater losses in BMC but without large compensatory increases in bone area. This finding is opposite to expectations that periosteal expansion acts to mechanically offset bone loss. Thus, changes in femoral neck structure and mass during menopause vary widely among women and are predicted by baseline external bone size but not aBMD. How these different structural and mass changes affect individual strength‐decline trajectories remains to be determined. © 2017 American Society for Bone and Mineral Research.
Introduction
Reducing the incidence of bone fragility fractures is an important public health goal.(1) The increased risk of fragility fractures in the elderly arises in part from variation in adult bone mineral density (BMD), and changes in BMD, bone structure, and material properties.(2, 3, 4, 5, 6) Peak BMD accounts for most of the variation in BMD measured for elderly individuals.(4, 7) However, little is understood about how variation in adult bone traits affects subsequent changes in bone structure and mass during aging, particularly during the menopausal transition (MT) among women, a life stage characterized by declines in BMD,(8) strength indices,(9) and periosteal expansion.(3, 6, 10, 11) To date, however, most longitudinal analyses of bone parameters have been limited largely to analyses of cross‐sectional population mean values. Thus, a major gap in knowledge is that we know very little about how changes in BMD and bone structure vary among individuals and whether the interindividual variation in bone aging is influenced by peak bone traits.
We propose that understanding the different ways that bones are constructed during growth will provide important insight into the skeletal traits which contribute to the variation in peak BMD as well as the age‐related changes in bone structure and mass. For long‐bone diaphyses, it is well established that individuals acquire a specific set of morphological and compositional traits by adulthood depending on their external bone size,(12, 13, 14, 15, 16) which is a mechanically relevant trait that is established postnatally(17, 18, 19, 20) and measured using existing technologies (eg, bone width from plain film X‐rays, total cross‐sectional area from quantitative computed tomography [CT]). The skeletal system coordinately adjusts cortical area, matrix mineralization, and intracortical porosity during growth, so by adulthood individuals with narrow diaphyses acquire a set of traits (small width, high relative cortical area, high mineralization, low porosity) that is mechanically functional but that differs from the set of traits acquired by individuals with wide diaphyses (large width, low relative cortical area, low mineralization, high porosity).
This phenomenon has been widely studied for diaphyseal bone and, to a lesser extent, for fracture prone cortical‐cancellous structures such as the hip. For the femoral neck, negative correlations reported between neck width and cortical thickness and trabecular mass(21, 22, 23) suggest that individuals with narrow femoral necks tend to have a proportionally thicker cortex and higher trabecular mass compared to individuals with wide femoral necks (Fig. 1). aBMD is calculated as the ratio of bone mineral content (BMC) to projected bone area. Variation in neck width directly affects projected bone area, and also includes the covariation of traits affecting X‐ray attenuation (eg, cortical area, trabecular mass, mineralization, porosity) thus affecting BMC. However, how these coordinately adjusted traits affect aBMD is not known. Studying how aBMD relates to these coordinately adjusted traits represents a novel approach to systematically relate aBMD to bone structure.
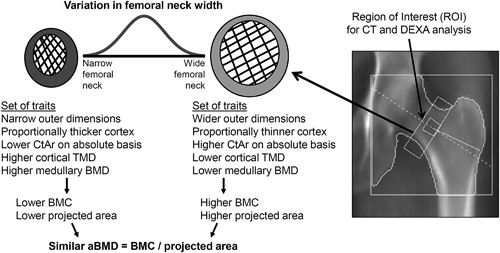
Schematic showing how the interindividual variation in femoral neck width is associated with coordinated changes in several cortical and trabecular traits that lead to individuals acquiring different sets of bone traits by adulthood and that are predictable by external bone size.
External bone size, because of its association with intracortical remodeling,(16) may also affect skeletal aging by establishing individualized strength‐decline trajectories. The significant positive association between intracortical porosity and external bone size found for adult tibial diaphyses suggested that the skeletal system regulates intracortical remodeling to increase tissue‐stiffness in slender bones by decreasing porosity while minimizing mass in wide bones by increasing porosity.(16) Because age‐related increases in cortical porosity result from increases in pore volume and not pore number,(24) we hypothesize that the association between external bone size and pore density may result in wider bones showing greater bone loss with aging compared to slender bones. This hypothesis is supported by prior work in cadaver tissue showing that wide femoral necks showed a steeper age‐related decline in cortical area and overall bone strength compared to narrow femoral necks.(23) These different strength‐decline trajectories in cadaveric tissue warrant confirmation using longitudinal data in living human populations.
The goals of this study were to: (1) test whether femoral neck traits are coordinately adjusted relative to external bone size consistent with prior studies, (2) systematically evaluate how the natural variation in femoral neck width and the accompanying set of traits affect aBMD, and (3) test the hypothesis that age‐related changes in dual‐energy X‐ray absorptiometry (DXA)‐derived bone traits (aBMD, BMC, bone area) depend on baseline external bone size. These goals were accomplished using longitudinally acquired data for women transitioning through menopause. Finding predictable differences in how bone structure changes among women during the MT would be an important clinical advance for personalizing diagnostic and treatment regimens and for identifying women that may benefit from early intervention.
Subjects and Methods
Study population
Subjects included women who were enrolled at the Pittsburgh site of the Study of Women's Health Across the Nation (SWAN), which has been described.(25) Briefly, SWAN is a multisite, prospective cohort study of women transitioning through menopause. Eligibility criterion at baseline in 1996 included 42 to 52 years of age, having an intact uterus, and at least one menstrual period in the previous 3 months. Women had approximately 14 annual study visits (visits 0 to 13) that included measurements such as DXA scans of the hip and spine. A subset of women at the Pittsburgh site also had a clinical quantitative computed tomography (CT) scan at study visit 11 conducted between 2008 and 2009. This subset consisted of all women who agreed to participate in this additional substudy. Substudy participants have a similar 2:1 ratio of white to black women as the Pittsburgh site and also showed similar race/ethnicity based age, height, weight, and hip aBMD measures compared to all SWAN Hip Strength Study participants.(26) Among the 213 Pittsburgh SWAN women with a CT scan available, nine were excluded due to missing data and six were excluded because of bisphosphonates use for more than 1 year of follow‐up, leaving 198 women available for the analytic sample. Informed consent was obtained at each study visit from all subjects, and the study was approved by the University of Pittsburgh institutional review board.
Measures
DXA scans were performed on a QDR 4500 Bone Densitometer (Hologic Inc., Marlborough, MA, USA) using standard protocols to measure aBMD of the proximal femurs as described.(27) Briefly, osteodyne positioners were used for femur measurements. A standard quality‐control program, conducted in collaboration with Synarc, Inc. (Newark, CA, USA), included daily phantom measurements, 6‐month cross‐calibration with a circulating anthropomorphic spine standard, local site review of all scans, central review of scans that met problem‐flagging criteria, and central review of a 5% random sample of scans. Short‐term in vivo measurement variability was 0.016 g/cm2 (2.2%) for the femoral neck. Hip aBMD, BMC, and projected bone area were quantified using the manufacturer's software.
Clinical CT scans of the proximal femur were acquired on a GE Hi‐Speed ZXi CT system (Milwaukee, WI, USA) with 1‐mm slice thickness for a subcohort of women during study visit 11. The CT scans were analyzed previously for morphology and strength estimates,(28) but were reanalyzed in the current study using different methods. In the current study, the region of interest (ROI) was standardized to coincide with the region used to measure hip aBMD from DXA images.(29) The superolateral corner of the ROI, which was 1.5 cm wide, was placed at the intersection of the neck with the medial face of the greater trochanter. MicroView v2.2 Advanced Bone Analysis Application (GE Healthcare Pre‐Clinical Imaging, London, ON, Canada) was used to manually segment the cortical bone and medullary areas, threshold the ROI using the method of Otsu,(30) and calculate the medullary volumetric bone mineral density of the medullary space (Med.vBMD) and the average total cross‐sectional area (Tt.Ar), cortical area (Ct.Ar), cortical tissue mineral density (Ct.vBMD), and medullary area (Med.Ar) over the ROI. Relative cortical area (RCA) was defined as Ct.Ar/Tt.Ar. The image analysis was conducted by a single researcher (AK) whose average coefficient of variation for a repeatability analysis was 3% to 6% for five randomly selected scans. Bone density values were established by using a phantom with known densities (Image Analysis, Inc., Columbia, KY, USA), which was scanned with each subject.
Statistical analysis
Analysis 1 (visit 11)
The first analysis related aBMD data from visit 11 to CT data also collected at visit 11. Cortical bone and the medullary space could not be reliably segmented from the CT scans for 8 women, leaving 190 women available for this analysis. Linear regression analysis was used to examine associations between measures of external bone size (eg, Tt.Ar from CT, projected bone area from DXA) and measures of bone mass (Ct.Ar, Med.vBMD) and cortical tissue mineral density (Ct.vBMD). Next, linear regression analysis was used to test how aBMD depended on each of the CT‐derived bone traits (Tt.Ar, Ct.Ar, Med.vBMD, Ct.vBMD). Finally, multivariate linear regression analysis was conducted to test how well the CT‐derived traits together predicted aBMD measured from DXA.
Analysis 2 (Baseline to visit 13)
To address the hypothesis that age‐related changes in DXA derived bone traits (aBMD, BMC, bone area) depend on baseline external bone size, we used linear regression analysis to test for significant associations between height adjusted baseline bone area (bone area‐height residuals) and the 14‐year change in BMC, bone area, and aBMD. Because taller women tend to have wider bones, it was important to adjust bone area for height by using the residuals calculated from a linear regression between baseline bone area and height. The changes in aBMD, BMC, and bone area were calculated as the difference in trait values between baseline and visit 13, which spanned 14.3 years on average. To minimize the impact of modest fluctuations in aBMD, BMC, and bone area on the calculation of 14‐year changes in these traits, the values of aBMD, BMC, and bone area at baseline and at visit 13 were estimated from a linear regression of aBMD, BMC, and bone area as a function of visit number. Individual aBMD, BMC, and bone area data points were removed for 12 individuals (17 data points) that showed a change in aBMD, BMC, or bone area between adjacent visits of more than 20%; this magnitude of change between successive annual visits was 10 times the standard deviation of the average annual change and was not considered part of the normal aging process. Multivariate linear regression was used to confirm whether the correlation between baseline bone area and the 14‐year change in aBMD, BMC, and bone area were attenuated after considering the contributions of race/ethnicity, use of hormone therapy (HT), the 14‐year change in body weight, and baseline aBMD, age, weight, and height. HT‐users were identified as those women that used HT for more than a year and prior to visit 11. The rationale for this decision was that extended use of HT (>1 year) during the first 85% of annual study visits may affect the calculation of 14‐year changes in structure and mass in the femoral neck.(31)
Finally, women were sorted into tertiles (narrow for height, intermediate for height, wide for height) using the baseline bone area‐height residuals. Differences in 14‐year changes in aBMD, BMC, and bone area were compared across tertiles using ANOVA and Tukey's post hoc test. Differences in baseline height, weight, and age among the tertiles were determined using ANOVA, and differences in race/ethnicity and HT use were determined using chi‐square test. A sensitivity analysis was conducted by repeating the tertile analysis after removing HT‐users. Statistical analyses were conducted using Prism (version 7; GraphPad Software, La Jolla, CA, USA), with the exception of the multivariate analyses which were conducted using Minitab (version 16.2.4; Minitab, Inc., State College, PA, USA).
Results
At baseline, the average age was 45.7 ± 2.5 years and did not differ between black and white women (p = 0.130, data not shown). Unadjusted trait values for white and black women at visit 11 are shown in Table 1. White women were less heavy and had lower hip aBMD, Ct.vBMD, and Med.vBMD, but greater Tt.Ar and Med.Ar compared to black women.
Unadjusted Body Size and Femoral Neck Traits for White and Black Women Measured at Visit 11 (2008–2009)
| Trait | White (n = 127) | Black (n = 63) | p |
| Age (years) | 57.2 ± 2.6 | 56.6 ± 2.3 | 0.120 |
| Weight (kg) | 76.6 ± 16.7 | 84.1 ± 17.6 | 0.004 |
| Height (cm) | 161.7 ± 6.1 | 161.4 ± 6.3 | 0.720 |
| DXA‐derived traits | |||
| aBMD (g/cm2) | 0.77 ± 0.10 | 0.86 ± 0.12 | 0.001 |
| BMC (g) | 3.79 ± 0.56 | 4.15 ± 0.62 | 0.001 |
| Bone area (cm2) | 4.93 ± 0.32 | 4.85 ± 0.32 | 0.140 |
| CT‐derived traits | |||
| Tt.Ar (cm2) | 3.17 ± 5.61 | 2.99 ± 0.79 | 0.036 |
| Ct.Ar (cm2) | 1.25 ± 2.02 | 1.27 ± 2.20 | 0.682 |
| RCA | 0.40 ± 0.04 | 0.43 ± 0.06 | 0.001 |
| Med.Ar (cm2) | 1.92 ± 4.17 | 1.73 ± 3.66 | 0.003 |
| Ct.vBMD (mg/cm3) | 4200 ± 417 | 4340 ± 471 | 0.037 |
| Med.vBMD (mg/cm3) | 1145 ± 313 | 1389 ± 393 | 0.001 |
Values are mean ± SD. Bold values are significant.
aBMD = areal bone mineral density; BMC = bone mineral content; Tt.Ar = total area; Ct.Ar = cortical area; RCA = relative cortical area (Ct.Ar/Tt.Ar); Med.Ar = medullary area; Ct.vBMD = cortical volumetric bone mineral density; Med.vBMD = medullary volumetric bone mineral density.
Analysis 1 (visit 11)
The relationships among traits measured from images acquired from CT and DXA scans were analyzed for 190 women, of whom 63 were black and 127 were white. Linear regression analysis confirmed a significant positive association between Tt.Ar and Ct.Ar (R2 = 0.55, p = 0.001, Fig. 2A) and significant negative associations between Tt.Ar and RCA (R2 = 0.17, p = 0.001, Fig. 2B) and Ct.vBMD (R2 = 0.18, p = 0.001, Fig. 2C). Med.vBMD correlated with bone area measured from DXA (R2 = 0.10, p = 0.001, Fig. 2D), but not Tt.Ar measured from CT (R2 = 0.01, p = 0.310, data not shown). These regressions were consistent with the schematic depicted in Fig. 1, indicating that women with narrow femoral necks had lower absolute Ct.Ar but higher RCA combined with higher Ct.vBMD and Med.vBMD compared to women with wide femoral necks.
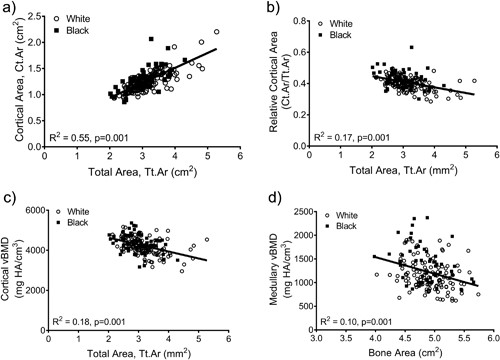
Linear regression analysis showing associations between measures of external bone size (Tt.Ar measured from CT images or bone area measured from DXA images) and (A) cortical area, (B) relative cortical area, (C) cortical tissue mineral density, and (D) medullary vBMD. HA = hydroxyapatite.
aBMD did not correlate with Tt.Ar (R2 = 0.01, p = 0.251; Fig. 3A), but was significantly correlated with Ct.Ar (R2 = 0.14, p = 0.001, Fig. 3B), Ct.vBMD (R2 = 0.10, p = 0.001, Fig. 3C), and Med.vBMD (R2 = 0.59, p = 0.001; Fig. 3D). A multivariate regression analysis showed that the cortical and trabecular traits (Tt.Ar, Ct.Ar, Ct.vBMD, Med.vBMD) derived from the CT images explained 62% of the variation in aBMD (p = 0.001, data not shown). Including body weight, height, age, and race/ethnicity in this regression increased the adjusted R2 to 72% (Table 2); significant independent predictors included body weight, height, Ct.vBMD, and Med.vBMD.
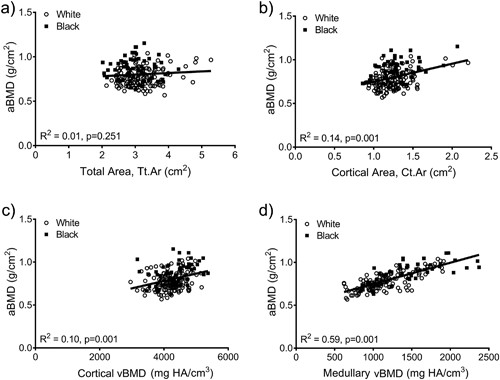
Linear regression analysis showing associations between aBMD from DXA and (A) total area, (B) cortical area, (C) cortical tissue mineral density, and (D) medullary vBMD. HA = hydroxyapatite.
Multivariate Regression Analysis Between Femoral Neck aBMD and the Underlying CT‐Derived Traits Measured at Visit 11
| Term | B coefficient | Standard error | p |
| Black race/ethnicity | 0.0201 | 0.0110 | 0.069 |
| Age (years) | 0.0017 | 0.0019 | 0.368 |
| Weight (kg) | 0.0020 | 0.0004 | 0.001 |
| Height (cm) | 0.0020 | 0.0009 | 0.028 |
| Ct.Ar (cm2) | 0.0759 | 0.0423 | 0.075 |
| Tt.Ar (cm2) | –0.005 | 0.0167 | 0.746 |
| Ct.vBMD (mg HA/cm3) | 0.0001 | 0.00001 | 0.001 |
| Med.vBMD (mg HA/cm3) | 0.0002 | 0.00002 | 0.001 |
Adjusted R2 = 0.72, p = 0.001. Bold values are significant.
Ct.Ar = cortical area; Tt.Ar = total area; Ct.vBMD = cortical volumetric bone mineral density; HA = hydroxyapatite; Med.vBMD = medullary volumetric bone mineral density.
Analysis 2 (Baseline to visit 13)
Linear regression analysis showed interindividual differences in the way bone structure and mass changed during the MT. Because the average 14‐year change in aBMD (black: –0.088 ± 0.092 g/cm2 versus white: –0.073 ± 0.072 g/cm2; p = 0.185), BMC (black: –0.26 ± 0.51 g versus white: –0.23 ± 0.35 g; p = 0.673), and bone area (black: 0.19 ± 0.19 cm2 versus white: 0.16 ± 0.17 cm2; p = 0.227) did not differ significantly between black and white women, all data were combined to maximize statistical power. The residuals from a linear regression between baseline bone area and height (Fig. 4) were used to adjust femoral neck size relative to body size. The 14‐year change in BMC (R2 = 0.03, p = 0.015) and bone area (R2 = 0.13, p = 0.001), but not aBMD (R2 = 0.00, p = 0.931) correlated negatively with the baseline bone area‐height residuals. The dependence of the 14‐year changes in BMC and bone area on baseline bone area remained significant after considering the effects of ethnicity, HT‐use, the 14‐year change in body weight, and baseline aBMD, weight, height, and age (Table 3).
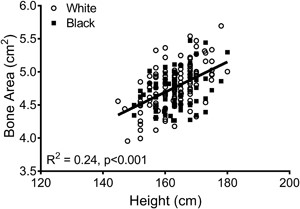
Linear regression analysis showing that bone area measured from DXA increases with body height at baseline.
Multivariate Regression Analysis for 14‐Year Changes in aBMD, BMC, and Bone Area
| 14‐Year change in aBMD | 14‐Year change in BMC | 14‐Year change in bone area | |||||||
| Variable | B | SE | p | B | SE | p | B | SE | p |
| Black race/ethnicity | 0.073 | 0.067 | 0.276 | 0.051 | 0.068 | 0.452 | –0.068 | 0.075 | 0.365 |
| HT‐use | 0.042 | 0.060 | 0.483 | –0.018 | 0.061 | 0.765 | –0.129 | 0.067 | 0.057 |
| Baseline age | 0.062 | 0.061 | 0.314 | 0.086 | 0.062 | 0.167 | 0.039 | 0.068 | 0.559 |
| Baseline weight | 0.027 | 0.073 | 0.711 | 0.036 | 0.074 | 0.624 | 0.055 | 0.081 | 0.501 |
| Baseline height | –0.022 | 0.072 | 0.762 | 0.044 | 0.073 | 0.549 | 0.209 | 0.081 | 0.010 |
| Baseline aBMD | –0.413 | 0.075 | 0.001 | –0.338 | 0.077 | 0.001 | 0.036 | 0.084 | 0.669 |
| Baseline bone area | –0.101 | 0.074 | 0.175 | –0.335 | 0.075 | 0.001 | –0.514 | 0.083 | 0.001 |
| 14‐Year change in weight | 0.444 | 0.059 | 0.001 | 0.409 | 0.061 | 0.001 | –0.072 | 0.066 | 0.281 |
| Adjusted R2 | 0.34 | 0.001 | 0.31 | 0.001 | 0.19 | 0.001 | |||
Standardized beta coefficients shown. Bold values are significant.
HT = hormone therapy.
Women were sorted into tertiles (n = 66/tertile) using the baseline bone area‐height residuals. Baseline weight (p = 0.008, ANOVA) but not height (p = 0.303, ANOVA) or the 14‐year change in body weight (p = 0.320, ANOVA; data not shown) differed among the tertiles (Table 4). The tertile comprised of narrow femoral necks had more black women (45%) compared to the middle (30%) and wide (26%) tertiles (p = 0.044, chi‐square test). The age at baseline (p = 0.008, ANOVA), but not the percentage HT‐users (p = 0.681, chi‐square test), differed among the tertiles. Baseline bone area (p = 0.001, ANOVA) and BMC (p = 0.017, ANOVA), but not aBMD (p = 0.145, ANOVA), differed significantly among the tertiles. Importantly, the 14‐year change in BMC (p = 0.009, ANOVA Fig 5B) and bone area (p = 0.001, ANOVA Fig 5C), but not aBMD (p = 0.788, ANOVA Fig 5A), differed among the tertiles confirming that women with narrow femoral necks showed smaller changes in BMC but greater increases in bone area compared to women with wide femoral necks. Removing HT‐users did not change the significance of the tertile analysis for the 14‐year change in aBMD (p = 0.806), BMC (p = 0.035), and bone area (p = 0.001).
Baseline Data for Women Segregated Into Tertiles Based on Bone Area–Height Residuals
| Trait | Narrow (n = 66) | Intermediate (n = 66) | Wide (n = 66) | p |
| Age (years) | 45.0 ± 2.3b | 45.7 ± 2.6 | 46.4 ± 2.5b | 0.008 |
| Height (cm) | 163.8 ± 6.6 | 162.0 ± 6.5 | 163.0 ± 7.0 | 0.303 |
| Weight (kg) | 71.9 ± 15.1 | 68.3 ± 14.6c | 76.8 ± 17.1c | 0.008 |
| aBMD (g/cm2) | 0.89 ± 0.13 | 0.86 ± 0.12 | 0.85 ± 0.13 | 0.145 |
| BMC (g) | 3.97 ± 0.61b | 4.07 ± 0.63 | 4.29 ± 0.69b | 0.017 |
| Bone area (cm2) | 4.46 ± 0.24a,b | 4.75 ± 0.18a,c | 5.05 ± 0.24b,c | 0.001 |
| Race/ethnicity (% black) | 45 | 30 | 26 | 0.0449 |
| % Having used HT | 47 | 54 | 50 | 0.6819 |
Values are mean ± SD.
a,b,cTukey post hoc tests for baseline data: ap = 0.05 for narrow versus intermediate tertiles; bp = 0.05 for narrow versus wide tertiles; cp = 0.05 for intermediate versus wide tertiles.
Chi‐square test.
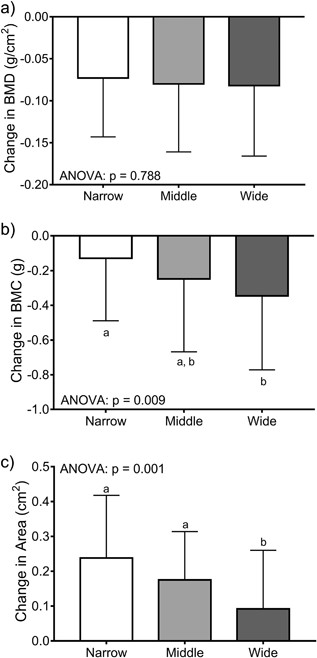
The 14‐year changes in (A) aBMD, (B) BMC, and (C) bone area were compared across tertiles using ANOVA. Women were sorted into tertiles based on the residuals from a linear regression between bone area and height measured at baseline. The result of post hoc analyses are indicated by the lower case letters; tertiles with different letters indicate p = 0.05.
Discussion
Analysis of longitudinally acquired hip DXA and CT images for perimenopausal women revealed two important outcomes (Fig. 6); first, women in our cohort acquired a unique set of cortical and trabecular traits in the femoral neck by adulthood, and second, these individual sets of traits were associated with differences in the way bone structure and mass changed across the MT. The MT, which is a critical period of change in reproductive function unique to women, defines the early phase of bone strength decline that contributes to sex‐differences in many health outcomes,(32, 33, 34, 35, 36, 37) including the nearly twofold greater lifetime fracture risk of women compared to men.(38) Women show rapid changes in sex‐hormones over a short timeframe during the MT,(39, 40) which have been associated with declines in population mean values for BMD,(8) bone strength estimates,(9) and periosteal expansion.(3, 6, 10, 11) The current study moved beyond an analysis limited to reporting only population mean values by specifically testing for interindividual differences in how bone changes with age.

Schematic depicting the differences in how femoral neck structure and mass change during menopause for women with narrow femoral necks at baseline compared to women with wide femoral necks at baseline.
The first important outcome of this study was finding that cortical area (Ct.Ar), cortical tissue mineral density (Ct.vBMD), and Med.vBMD correlated significantly with external bone size measured either from CT or DXA images (Fig. 2). These associations reflect how the skeletal system coordinately adjusts the amount of bone (Ct.Ar, Med.vBMD) and tissue‐mineral density (Ct.vBMD) relative to external bone size.(18, 41) These associations were consistent with those reported in prior work for the human proximal femur(4, 21, 23) and the mouse vertebral body.(42, 43, 44) Further, the associations among traits of the femoral neck cortical shell were consistent with those reported for human(12, 13, 14, 45, 46, 47, 48, 49) and mouse(50, 51, 52) long‐bone diaphyses. The CT images examined in the current study were acquired when women were 53 to 64 years of age. Thus, significant associations among cortical and trabecular traits were apparent during a period of rapid bone change and despite external‐size–dependent differences in how BMC and bone area changed over time (Fig. 5). Because load is shared between cortical and trabecular tissues,(53) it was not surprising to find increased Med.vBMD in slender bones given that these bones have a lower cortical area and thus may be expected to shift a greater proportion of load to the trabecular tissue. Further, the combination of Ct.Ar, Ct.vBMD, and Med.vBMD together explained 72% of the variation in aBMD. The significant correlations found among cortical and trabecular traits are clinically meaningful because they suggest that whole‐bone mechanical function should be evaluated based on the particular suite of traits acquired by an individual, not a single intermediate bone trait. Consideration of these trait‐trait interactions may be important for identifying genetic or environmental factors that affect whole‐bone mechanical function.(54)
The second major finding of this study was the observation that 14‐year changes in BMC and bone area varied with baseline external bone size (Fig. 5). The changes in BMC and bone area were not reflected in changes in aBMD, indicating that women showed similar changes in aBMD for different structural and thus biological reasons. Women with narrow femoral necks showed smaller losses in BMC but larger increases in bone area, whereas women with wide femoral necks showed larger losses in BMC but smaller increases in bone area. Although women with narrow bones were on average 1 year younger at baseline compared to women with wide bones, the nonsignificant contribution of baseline age to the change in aBMD, BMC, or bone area (Table 3) suggested that this minor age difference did not account for the differences in the 14‐year changes in structure and mass among the tertiles. The manner in which the 14‐year change in BMC and bone area differed among the tertiles suggested that bone strength was being maintained or possibly increasing in women with narrow bones but decreasing in women with wide bones. Assessing the impact of these structural and mass changes on bone strength using the available hip DXA images has not been done and would require modifying the hip structure analysis (HSA) algorithm(55) to include the significant negative correlation between the relative proportions of cortical and trabecular bone volumes and external bone size (Fig. 2B).
The pattern of change in BMC relative to the change in bone area provided important new insight into the association between bone loss and periosteal expansion. The increased periosteal expansion with aging is thought to mechanically offset the age‐related loss in mass and tissue‐level mechanical properties.(10, 17, 56, 57) The stimulus for this expansion is unknown, but has often been assumed to be triggered by endocortical bone loss.(58) Our results would be entirely consistent with the current dogma that a change in bone area mechanically offsets bone loss if only the average changes in BMC and bone area were examined. However, segregating the data into tertiles based on height‐adjusted external bone size provided data that contradicts this dogma: women with narrow bones showed greater periosteal expansion despite having only a small loss in BMC, whereas women with wide bones showed a greater loss in BMC but without greater periosteal expansion. The opposite outcome (ie, narrow bones showing less periosteal expansion compared to wide) would be expected from an engineering perspective when considering how external size affects periosteal expansion and when assuming the skeletal system adapts its structure to maintain strength with aging.(59, 60) Thus, our data provide new insight into this important aspect of aging and suggest that the amount of periosteal expansion depends on external bone size in addition to the amount of bone loss and that the system may not be acting to maintain strength uniformly across women during the MT.
Although our results appear to contradict those of Ahlborg and colleagues,(10) it is noteworthy to point out that that article reported associations between periosteal expansion and endocortical loss only among postmenopausal women. The decrease in BMC reported herein reflects the net loss of both cortical and trabecular tissues in the region of interest for perimenopausal women. One limitation of using data derived from DXA images is that we do not know the anatomical location of resorption leading to age‐related decreases in BMC and whether the amount and location of resorption also varies with baseline external bone size. An additional limitation is that we do not know to what extent the age‐related increase in bone area contributed to variation in the decline in BMC among tertiles. Nevertheless, a similar phenomena has been reported for elderly men who also show greater loss in BMC(61) and aBMD(62) with greater baseline bone area. Interestingly, in the former study, smaller baseline bone area was associated with greater aBMD loss and a greater increase in bone area over time.(61) Although we did not see differences in the change in aBMD among the height‐adjusted bone area tertiles, our finding that midlife women having smaller baseline bone area show greater increases in bone area over time is consistent with this prior study in elderly men.
The fact that women with wide bones showed greater loss in BMC without a concomitant change in periosteal expansion may help explain why prior work reported that having wide femoral necks is associated with greater risk of fragility fractures in postmenopausal women.(63) Our data suggested that the structural changes that may lead to increased fragility for women with wide femoral necks are readily observable during the MT using existing technologies. Thus, the interindividual differences in skeletal changes during the MT may help inform clinical decision‐making regarding potential benefits of early intervention.(40) Our data suggest that women with wide femoral necks would benefit from slowing the resorption leading to the rapid decline in BMC and/or stimulating greater compensatory periosteal expansion.
The difference in 14‐year changes in BMC across the tertiles confirms similar size‐dependent structural and strength changes observed for cadaveric femurs.(23) Although the underlying cellular and molecular basis for these differences in bone loss are not fully understood, work by us(12) and others(24, 64) showing a significant association between external size and intracortical remodeling provides a reasonable explanation for why the 14‐year change in BMC was associated with baseline external bone size (Fig. 5). Because bone loss with aging occurs through expansion of existing pores,(24) external bone size–dependent differences in baseline pore density may help explain why the loss in BMC during the MT was greater for wide bones compared to narrow bones. Much work remains to better understand these associations at a histomorphometric level and to identify the molecular mechanisms responsible for the association between pore density and external bone size. Further, the associations between external bone size and the 14‐year change in bone area and BMC were significant but only explained 20% to 30% of the variation when combined with other baseline parameters (Table 3). Our analysis was limited to measuring the total change in BMC, bone area, and aBMD over 14 years. We expect to improve the strength of these associations with additional analyses that take into consideration the nonlinear change in structural and hormonal parameters relative to the final menstrual period.(8, 9)
A limitation of this study involves how the resolution of the DXA and CT images affected the quantification of cortical and trabecular traits. BMC and bone area traits derived from DXA images were calculated using the manufacturer's proprietary algorithms. We attempted to minimize potential size‐dependent errors by segregating women into tertiles based on the bone area‐height residuals so there was overlap in the absolute value of bone area among the tertiles. Changes in bone area from a DXA scan arise from expansion of the outer (ie, periosteal) bone surface because the width of the ROI is standardized for all scans. Because bone area measured from DXA is not entirely reliable and associated with within‐subject variability,(62) follow‐up studies using higher‐resolution imaging are needed to confirm the interindividual differences in bone loss and periosteal expansion. Internal repeatability studies indicated minimum changes in hip aBMD of 0.016 g/cm2 for the femoral neck, which is consistent with other studies,(65) and is well below the changes in aBMD that occurred during the MT. The clinical CT images were acquired at 1‐mm voxel resolution for the current study. Similar relationships among traits were found at 0.16‐mm pixel size for cadaveric femurs,(23) suggesting that the limited resolution of the current CT images did not adversely affect the associations shown in Fig. 2. The limited resolution may have contributed to the nonsignificant association between Med.vBMD and Tt.Ar. Nevertheless, Med.vBMD did correlate significantly with bone area measured from DXA, suggesting that there may be an association, albeit weak, between the amount of trabecular bone and external bone size. Additional testing of cadaveric tissue using higher‐resolution imaging is expected to identify more detailed information about the cortical (porosity, mineralization) and trabecular (BV/TV, Tb.Th, Tb.N) traits that are coordinately regulated relative to external bone size. Finally, the limited number of individuals in this study did not allow testing for race/ethnic differences in how BMC and bone area changed during the MT. Analysis of DXA images across all SWAN study sites is needed to test for the effects of race/ethnicity and to expand the analysis to identify additional factors (eg, physical activity, prior medication use, diet) that affect aging in addition to external bone size.
In conclusion, our data showed that women build proximal femurs by assembling different sets of traits that are predictable from external bone size but not aBMD, and that these different sets of traits are associated with clinically important interindividual differences in how bone structure and mass change during the MT. The interactions among traits found for the proximal femur contributes to a growing literature showing that people build bones differently(21, 22, 23) and thus women begin the aging process at different starting points.(63) A major outcome of this study was finding that interindividual differences in how bone structure and mass changed during the initial phase of bone loss contradicted current dogma regarding how periosteal expansion may act to mechanically offset bone loss. Studying interindividual differences rather than limiting the analysis to population mean values suggested that the amount of periosteal expansion relative to the amount of bone loss may depend on baseline bone size rather than a compensatory relationship between periosteal expansion and bone loss to maintain strength. Finally, we reported that women with wide femoral necks showed the greatest loss in BMC without a large compensatory increase in periosteal expansion; this structural change may contribute to the greater risk of fracturing later in life for a subset of women that is readily apparent during the MT using existing technologies. Thus, studying interindividual differences provides an opportunity to give a voice to a silent disease(66) and to open the possibility of identifying women that are losing bone mass early without compensatory changes in periosteal expansion and that may benefit from early intervention.
Disclosures
All authors state that they have no conflicts of interest.
Acknowledgments
This work was supported in part by grants from the NIH (AG026463 to JAC; AR065424 to KJJ) and a career development award from the University of Michigan Older Americans Independence Center, supported by the NIH (AG024824‐10 to CK‐G). The Study of Women's Health Across the Nation (SWAN) has grant support from the NIH, DHHS, through the National Institute on Aging (NIA), the National Institute of Nursing Research (NINR), and the NIH Office of Research on Women's Health (ORWH) (grants U01NR004061; U01AG012505, U01AG012535, U01AG012531, U01AG012539, U01AG012546, U01AG012553, U01AG012554, U01AG012495). The content of this article is solely the responsibility of the authors and does not necessarily represent the official views of the NIA, NINR, ORWH, or the NIH. We thank the study staff at each site and all the women who participated in SWAN. Clinical Centers: University of Michigan, Ann Arbor – Siobán Harlow, PI 2011–present, Mary Fran Sowers, PI 1994–2011; Massachusetts General Hospital, Boston, MA – Joel Finkelstein, PI 1999–present; Robert Neer, PI 1994–1999; Rush University, Rush University Medical Center, Chicago, IL – Howard Kravitz, PI 2009–present; Lynda Powell, PI 1994–2009; University of California, Davis/Kaiser – Ellen Gold, PI; University of California, Los Angeles – Gail Greendale, PI; Albert Einstein College of Medicine, Bronx, NY – Carol Derby, PI 2011–present, Rachel Wildman, PI 2010–2011; Nanette Santoro, PI 2004–2010; University of Medicine and Dentistry – New Jersey Medical School, Newark – Gerson Weiss, PI 1994–2004; and the University of Pittsburgh, Pittsburgh, PA – Karen Matthews, PI. NIH Program Office: National Institute on Aging, Bethesda, MD – Winifred Rossi 2012–present; Sherry Sherman 1994–2012; Marcia Ory 1994–2001; National Institute of Nursing Research, Bethesda, MD – Program Officers. Central Laboratory: University of Michigan, Ann Arbor – Daniel McConnell (Central Ligand Assay Satellite Services). Coordinating Center: University of Pittsburgh, Pittsburgh, PA – Maria Mori Brooks, PI 2012–present; Kim Sutton‐Tyrrell, PI 2001–2012; New England Research Institutes, Watertown, MA – Sonja McKinlay, PI 1995–2001. Steering Committee: Susan Johnson, Current Chair. Chris Gallagher, Former Chair
Authors' roles: Study design: KJJ, AK, SDH, CK‐G, and JC. Study conduct: AK, EMRB, SHS, RG, and JC. Data collection: AK, EMRB, SHS, and RG. Data analysis: KJJ and CK‐G. Data interpretation: KJJ, AK, SDH, JC, and CK‐G. Drafting manuscript: KJJ, AK, SDH, and CK‐G. Revising manuscript content: KJJ, SDH, and CK‐G. Approving final version of manuscript: KJJ, AK, EMRB, SHS, RG, SDH, JC, and CK‐G. KJJ and CK‐G take responsibility for the integrity of the data analysis.
