


ABSTRACT
It has been suggested that normalization of bone turnover may improve clinical outcome in Paget's disease of bone (PDB) by preventing complications such as fractures and the development of osteoarthritis. Here we investigated the long‐term effects of a treatment strategy that aimed to normalize bone turnover in PDB with that of symptomatic treatment. The study group comprised 502 subjects who were enrolled into a 3‐year extension of the Paget's Disease: Randomized Trial of Intensive versus Symptomatic Management (PRISM) study. Intensive bisphosphonate therapy was continued in 270 of these subjects with the aim of normalizing bone turnover using zoledronic acid as the treatment of first choice. Symptomatic treatment continued in 232 subjects in whom bisphosphonates were only given for the treatment of bone pain. The primary outcome was fracture and secondary outcomes were orthopedic procedures, quality of life, and bone pain, adjusted for baseline characteristics. Serum total alkaline phosphatase (ALP) concentrations were significantly lower in the intensive group on entry to the study and the differences between groups increased as the study progressed. There were no clinically important differences in quality of life measures or bone pain between the treatment groups. Intensive treatment was associated with a nonsignificant increase in fracture risk (hazard ratio = 1.90; 95% CI, 0.91 to 3.98; p = 0.087), orthopedic procedures (1.81; 95% CI, 0.71 to 4.61; p = 0.214), and serious adverse events (relative risk 1.28; 95% CI, 0.96 to 1.42). We conclude that long‐term intensive bisphosphonate therapy confers no clinical benefit over symptomatic therapy and is associated with a nonsignificant increase in the risk of fractures, orthopedic events, and serious adverse events. The results of this study suggest that in patients with established PDB, bisphosphonate therapy should focus on control of symptoms rather than suppression of bone turnover. © 2016 American Society for Bone and Mineral Research.
Introduction
Paget's disease of bone (PDB) is a common skeletal disorder with a strong genetic component that affects up to 2% of whites over the age of 55 years.(1) It is characterized by increased bone resorption, coupled to increased and disorganized bone formation at one or more skeletal sites. Many patients with PDB never come to medical attention,(2) but bone deformity, pathological fracture, deafness, and secondary osteoarthritis and bone pain are common in those that do present clinically, significantly impairing quality of life.(3, 4) Bisphosphonates are highly effective at suppressing the elevated bone turnover that is characteristic of PDB(5, 6, 7, 8)and are an effective treatment for bone pain associated with PDB.(9) It has been suggested that normalisation of bone turnover with bisphosphonates might prevent complications of PDB,(10) but this remains unproven.(11) Nonetheless, the Endocrine Society clinical guidelines recently advised that bisphosphonates should be administered to most patients with PDB with the aim of normalizing bone turnover in the hope this will prevent complications.(12)
The Paget's Disease Randomised Trial of Intensive versus Symptomatic Management (PRISM) study(13) showed that intensive bisphosphonate therapy and symptomatic treatment had similar effects on clinical outcome of PDB with respect to the occurrence of fractures, orthopedic procedures, hearing loss, bone pain, quality of life and adverse events. Here we report the results of a 3‐year extension of the PRISM trial (PRISM, extension with zoledronic acid; PRISM‐EZ) in which the same treatment strategies were continued but where the highly potent bisphosphonate zoledronic acid(14)was used as the treatment of first choice in the intensive arm.
Patients and Methods
Study design
The design of the PRISM study has previously been reported.(13) In brief, the treatment goal in the intensive arm was to supress bone turnover by reducing and maintaining serum total alkaline phosphatase (ALP) concentrations within the reference range whereas the treatment goal in the symptomatic arm was to treat bone pain thought to be due to PDB with analgesics or with bisphosphonates if the response to analgesics was inadequate. Participants who completed the PRISM study were invited to take part in a 3‐year extension in which the same treatment strategies were continued but where zoledronic acid was used as the bisphosphonate of first choice in the intensive arm. Enrolment into the study commenced in January 2007 and the study ended in January 2012.
Randomisation and study treatment
Patients were randomized into one of the two treatment groups on entry to PRISM using a minimisation algorithm to ensure balance for key prognostic variables as described.(13) During PRISM‐EZ participants were continued on the same treatment strategy as they had been randomized to in the PRISM study. Participants in the intensive arm were prescribed bisphosphonates as required to supress and maintain ALP concentrations within the normal range. Zoledronic acid was the treatment of first choice. Participants in the symptomatic arm received treatment with bisphosphonates only if bone pain was present that was considered to be due to increased metabolic activity of PDB. Both groups of subjects received analgesics and nonsteroidal anti‐inflammatory drugs (NSAIDs) as required.
Outcome measures
The primary outcome was clinical fracture. Other secondary outcomes included orthopedic procedures, serum total ALP concentrations; bone pain, and health‐related quality of life. Quality of life was measured using various tools including the Medical Outcomes Study 36 Item Short‐Form Health Survey (SF‐36) questionnaire(15); the Stanford Health Assessment Questionnaire Disability Index (HAQ)(16); the EuroQoL questionnaire (EQ‐5D); and the arthritis‐specific version of SF36 (ASHI).(17) Bone pain was recorded and physicians were asked to assess whether they considered that the bone pain was attributable to PDB. The commonest criteria used by physicians for attributing bone pain to PDB were; localization of pain to an affected site; response of pain at that site to previous treatment with bisphosphonate; pain at rest and pain at night.(13) Information on fractures, orthopedic procedures, and serious adverse events were collected on a continuous basis. Measurements of ALP, quality of life, and bone pain were made annually. Data on adverse events were collated annually based on patient diaries. Fractures and orthopedic procedures were validated against medical records by assessors blinded to treatment allocation. Serum total ALP was measured according to standard techniques by the biochemistry laboratories at participating centers. The measured ALP values were normalized to the upper limit of the local laboratories’ reference range to give adjusted ALP values so that results could be compared across centres. The adjusted values were categorized into four groups: low‐normal (ALP below the 50th centile of the local reference range); normal (between the 50th and 100th centile of the reference range); high (up to three times above the upper limit of the reference range); and very high (more than three times above the upper limit of the reference range).
Statistical analysis
We did not perform a power calculation because this was an extension of an existing study. The statistics are reported as number and percentages or numbers and mean ± standard deviation (SD) as appropriate unless otherwise stated. We used propensity scoring(18) to adjust for differences between groups in baseline characteristics including age, gender, age at diagnosis, family history of PDB, sites of involvement, deafness, renal function, bone pain, bone deformity, previous fractures, previous orthopedic surgery for PDB, and quality of life measures. The propensity scores were derived from the standardized mean differences between groups shown in Supporting Table 1. Unless otherwise stated, the analyses performed used inverse probability of treatment weighting (IPTW) in logistic regression models with propensity scores as explanatory variables and treatment as the independent variable. Flexible parametric models were used for the time‐to‐event outcomes of fracture and orthopedic procedures.(19) Estimates of the effect sizes are presented as hazard ratios with 95% CIs. The quality of life data and ALP measurements were analysed using linear mixed models with a random effect for participant and center to reflect the repeated measures nature of the data. All available data at each follow‐up time‐point was used and no adjustment was made for missing data.(20) All statistical analyses were IPTW‐adjusted unless otherwise stated.
Ethics
All participants gave written informed consent to be included in the study. The trial was approved by the UK Multicentre Research Ethics Committee for Scotland (MREC01/0/53); by local ethical review boards in the participating study centres and by the Medicines & Healthcare Products Regulatory Authority (CTA 21583/0002/001‐0001). The study was included in the controlled clinical trials register (www.controlled-trials.com) and assigned the reference number ISRCTN12989577.
Patient involvement
The research questions in the PRISM study were developed in consultation with patient representatives from the Paget's Association—a UK‐based patient support organisation and a representative from the Paget's Association served as a member of the trial steering committee on both PRISM and PRISM‐EZ.
Results
Characteristics of the study population
The disposition of subjects is shown in Fig. 1. We invited 949 patients who completed the PRISM study to take part in the extension study and 502 (52.8%) agreed. The symptomatic group in PRISM‐EZ comprised 232 patients (47.7% of those in the symptomatic arm that completed PRISM) whereas the intensive group comprised 270 subjects (53.5% of those in the intensive arm that completed PRISM). Relevant baseline characteristics of patients that consented to participate in PRISM‐EZ as compared with those that did not are shown in Supporting Table 2. The clinical characteristics of both groups were similar except that patients who consented to take part in PRISM‐EZ were about 4 years younger than those who did not participate. In total, 191 subjects in the symptomatic group (82.3%) and 213 subjects in the intensive group (78.8%) completed the study, providing 613 patient‐years of follow‐up in the symptomatic group and 698 patient years of follow‐up in the intensive group. Relevant demographic and clinical characteristics of the study population at the baseline visit of PRISM‐EZ are shown in Table 1. Prior to entering PRISM‐EZ, participants had been followed for an average of 4.3 years since enrolment in PRISM, giving a total duration of 7.3 years treatment and follow‐up. The groups were well matched for most variables at entry to PRISM‐EZ with the exception of serum total adjusted ALP concentrations, which were lower at baseline in the intensive treatment group, and bisphosphonate use, which was more common in the intensive group (Table 1). Supporting Table 1 shows that there were some imbalances for some variables between the treatment groups but that after IPTW adjustment these were minimized, indicating that the adjustment was successful in ensuring that the groups were matched.
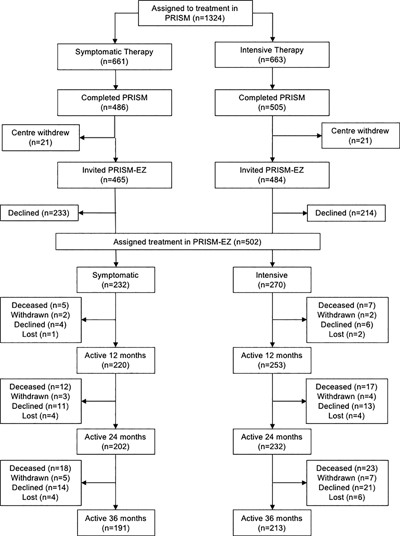
Disposition of study subjects from the start of PRISM to the end of PRISM‐EZ. Withdrawn indicates that the patient was withdrawn by the clinician; declined indicates that the patient declined further follow up. Lost indicates that the patient was lost to follow up.
Baseline Characteristics of the Study Population
| Intensive (n = 270) | Symptomatic (n = 232) | |
| Male | 149 (55.2) | 125 (53.9) |
| Age at entry to PRISM‐EZ (years) | 75.6 ± 8.1 | 76.0 ± 8.2 |
| Years since enrolment in PRISM | 4.3 ± 0.8 | 4.3 ± 0.8 |
| Age at diagnosis of PDB (years) | 63.4 ± 10.2 | 63.8 ± 10.4 |
| Family history | 45 (16.7) | 43 (18.5) |
| Number of affected bones | ||
| One | 97 (35.9) | 95 (37.1) |
| Two | 78 (28.8) | 67 (28.8) |
| Three | 54 (20.0) | 41 (17.6) |
| Four or more | 41 (15.1) | 29 (12.5) |
| Affected sites | ||
| Skull | 66 (24.4) | 62 (26.7) |
| Spine | 104 (38.5) | 82 (35.3) |
| Pelvis | 181 (67.0) | 142 (61.2) |
| Femur | 98 (36.3) | 71 (30.6) |
| Tibia | 53 (19.6) | 42 (18.1) |
| Other | 96 (35.6) | 78 (33.6) |
| Deafness | 46 (17.0) | 38 (16.4) |
| Serum adjusted ALP2 | 0.9 ± 0.7 | 1.1 ± 1.0* |
| Low‐normal ALP | 96 (36.8) | 77 (34.4) |
| Normal ALP | 100 (38.3) | 66 (29.5) |
| High ALP | 62 (23.8) | 73 (32.6) |
| Very high ALP | 3 (1.1) | 8 (3.6) |
| Serum creatinine (μmol/L) | 92.0 ± 24.9 | 94.6 ± 30.1 |
| Bone pain3 | 166 (61.5) | 149 (64.2) |
| Bone pain due to PDB4 | 68 (25.2) | 72 (31.0) |
| SF36 Physical Component Summary | 37.5 ± 11.5 | 38.3 ± 11.6 |
| SF36 Bodily pain | 41.5 ± 11.4 | 41.9 ± 11.7 |
| SF36 Mental Component Summary | 47.3 ± 11.8 | 48.9 ± 12.3 |
| Bone deformity | 134 (49.6) | 108 (46.6) |
| Previous fractures | 121 (44.8) | 103 (44.4) |
| Fracture in Pagetic bone | 31 (11.5) | 27 (11.6) |
| Orthopedic surgery for PDB | 70 (25.9) | 48 (20.7) |
| Previous bisphosphonate therapy | 214 (79.3) | 138 (59.5)*** |
| Bisphosphonate use in PRISM | 202 (74.8) | 123 (53.0)*** |
| Bisphosphonates administered in PRISM | ||
| Alendronate | 4 (1.5) | 5 (2.2) |
| Risedronate | 154 (57.0) | 41 (17.7) |
| Etidronate | 6 (2.2) | 10 (4.3) |
| Tiludronate | 8 (3.0) | 50 (21.6) |
| Pamidronate | 64 (23.7) | 51 (22.0) |
| Clodronate | 3 (1.1) | 1 (0.4) |
| Zoledronic acid | 5 (1.9) | 3 (1.3) |
Values are mean ± SD or n (%).
A value of 1.0 is equivalent to the upper limit of the reference range. Data were available for ALP in 261 of the intensive and 224 of the symptomatic group; for SF36 summary scores in 208 of the intensive and 180 of the symptomatic group; and for SF36 bodily pain in 216 of the intensive and 188 or the symptomatic group.
Patient reported bone pain.
Bone pain considered by the clinician to be due to Paget's disease.
*p = 0.02 between groups.
***p < 0.0001 between groups.
Treatment received
There was a significant difference between the two groups in the range and type of bisphosphonates given for PDB during the study, which was consistent with the study protocol (Supporting Table 3). Zoledronic acid was given to a higher proportion of patients in the intensive group (28.1% versus 10.3%, p < 0.001) whereas fewer patients in the intensive group received pamidronate (4.8% versus 15.5%, p < 0.001). The proportion of patients who received risedronate and etidronate was similar in both treatment groups. Some patients also were receiving bisphosphonate treatment for osteoporosis (alendronic acid 70 mg weekly, risedronate 35 mg weekly; and ibandronate 150 mg monthly or 3 mg intravenously every 3 months) but there was no significant difference in the proportion of patients who received these medications between the groups. Use of analgesics and NSAID in the treatment groups are summarized in Table 2. These agents were used by a high proportion of patients with no significant differences between the treatment groups.
Analgesic Use During Study
| Intensive (n = 270) | Symptomatic (n = 232) | Relative risk (95% CI) | |
| Any analgesic | 200 (74.1) | 182 (78.4) | 0.94 (0.85–1.04) |
| Paracetamol | 122 (45.2) | 120 (51.7) | 0.87 (0.72–1.05) |
| Compound analgesics | 87 (32.2) | 64 (27.6) | 1.18 (0.89–1.57) |
| Dihydrocodeine or tramadol | 33 (12.2) | 33 (14.2) | 0.92 (0.58–0.48) |
| Antineuropathic drugs | 3 (1.1) | 5 (2.2) | 0.40 (0.09–1.72) |
| Opioids | 12 (4.4) | 11 (4.7) | 0.89 (0.39–2.05) |
| NSAID | 70 (25.9) | 64 (27.6) | 0.97 (0.72–1.30) |
Values are n (%) of patients who received analgesics during the study.
Serum ALP
Changes in adjusted serum total ALP concentrations are shown in Fig. 2a. Serum ALP concentrations were significantly lower in the intensive group at baseline and the differences between groups increased as the study progressed. At the baseline visit 75.1% of the intensive group had normal or low normal ALP values compared with 63.8% of the symptomatic group (Table 1). The proportion of subjects with low‐normal, normal, high and very high ALP concentrations during the study are shown in Fig. 2, panels b‐d. At year 1, ALP values were low‐normal or normal in 80.7% of the intensive group and 70.5% of the symptomatic group (Fig. 2b). At year 2, ALP values were normal or low normal in 86.4% of the intensive group compared with 64.1% of the symptomatic group (Fig. 2c) and corresponding values at year 3 were 85.3% and 70.3% (Fig. 2d). The difference between groups was statistically significant at all time points. Biochemical relapse, defined as the occurrence of an elevated ALP during the study in patients where ALP concentrations were normal or low normal at baseline, occurred in 29 patients (8.5%), of whom 17 (58.6%) were in the symptomatic group and 12 (41.3%) were in the intensive group.
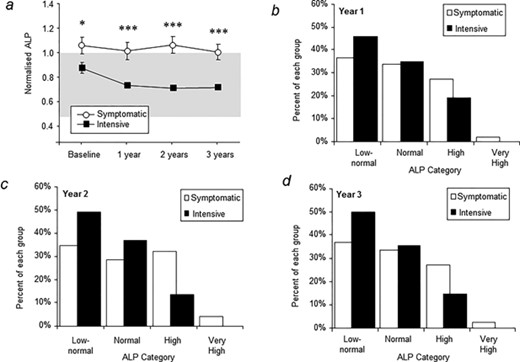
Serum alkaline phosphatase concentrations. (A) Changes in adjusted alkaline phosphatase during the study. The symbols are means and vertical bars standard error of the mean. The reference range is indicated by the shaded area. *p = 0.02 between groups; ***p < 0.001 between groups. (B–D) Proportion of patients with serum alkaline phosphatase values in each category at years 1 to 3. The differences between groups were significant at year 1 (p = 0.009), year 2 (p < 0.0001) and year 3 (p < 0.0001). Low normal: at or below the 50th centile of the normal range; Normal: between the 50th centile and the upper limit of normal; High: up to three times normal; very high: more than three times normal.
Quality of life and bone pain
Quality of life summary scores assessed by the SF36 questionnaire are shown in Table 3. There was no sustained difference in quality of life measures in favor of one group or the other during the study. Changes in the physical component summary score (+1.6, p = 0.04) and arthritis‐specific health index (+2.7, p < 0.001) were observed at year 1 in favor of the intensive treatment group whereas changes in the mental component summary score at year 3 favored the symptomatic treatment group (–2.4, p = 0.019). Changes in the Stanford disability index favored the symptomatic group at year 1 (–0.06, p = 0.05). There was no significant difference in EQ5D scores between treatment groups (data not shown). Changes in the SF36 subscales are shown in Supporting Table 4. Differences in physical function (+1.7, p = 0.049) and bodily pain (+2.8, p < 0.001) were observed, which favored the intensive group at year 1 but not at other time points. The magnitude of change in SF36 scores were in all cases less than the five‐point threshold, which is considered clinically significant.(15) There was no significant difference in SF36 bodily pain values in relation to serum adjusted ALP values (Supporting Table 5). The proportion of patients with bone pain was not different between groups during the study (Table 3), but for bone pain rated by the physician as being due to PDB there was a marginal benefit at year 2 in favor of the intensive group (+1.3, p = 0.009).
Effect of Treatment on Quality of Life Summary Scores and Bone Pain
| Time | Intensive (n = 270) | Symptomatic (n = 232) | Standardized mean difference (95% CI) | p | |
| Physical component summary | Year 1 | 185 (37.5 ± 0.9) | 153 (37.0 ± 0.9) | 1.6 (0.1–3.1) | 0.04 |
| Year 2 | 136 (36.1 ± 1.0) | 120 (36.9 ± 1.1) | 0.8 (−1.5 to 3.2) | 0.49 | |
| Year 3 | 172 (36.4 ± 0.9) | 160 (35.6 ± 0.9) | 0.9 (−1.1 to 2.9) | 0.39 | |
| Arthritis‐specific health index | Year 1 | 185 (37.6 ± 1.0) | 153 (36.4 ± 1.0) | 2.7 (1.3–4.0) | <0.001 |
| Year 2 | 136 (35.7 ± 1.2) | 120 (36.6 ± 1.2) | 0.7 (−1.6 to 2.9) | 0.57 | |
| Year 3 | 172 (36.6 ± 1.0) | 160 (36.1 ± 1.0) | 0.8 (−1.4 to 3.1) | 0.46 | |
| Mental component summary | Year 1 | 185 (46.9 ± 0.9) | 153 (47.6 ± 1.0) | 0.6, (−1.2 to 2.4) | 0.54 |
| Year 2 | 136 (46.6 ± 1.0) | 120 (48.2 ± 1.0) | −0.2 (−2.2 to 1.9) | 0.88 | |
| Year 3 | 172 (46.7 ± 0.9) | 160 (49.0 ± 1.0) | −2.4 (−4.3 to −0.4) | 0.019 | |
| Standard disability index | Year 1 | 185 (0.92 ± 0.06) | 153;1.02 ± 0.6) | −0.06 (−0.13 to 0.00) | 0.05 |
| Year 2 | 136 (1.05 ± 0.07) | 120 (1.03 ± 0.6) | −0.03 (−0.17 to 0.12) | 0.71 | |
| Year 3 | 172 (1.09 ± 0.07) | 160 (1.15 ± 0.7) | 0.04 (−0.10 to 0.19) | 0.56 | |
| Alternative disability index | Year 1 | 185 (0.72 ± 0.06) | 153 (0.76 ± 0.06) | 0.00 (−0.06 to 0.07) | 0.99 |
| Year 2 | 136 (0.84 ± 0.07) | 120 (0.80 ± 0.07) | −0.03 (−0.15 to 0.08) | 0.57 | |
| Year 3 | 172 (0.86 ± 0.06) | 160 (0.87 ± 0.06) | 0.04 (−0.09 to 0.17) | 0.57 | |
| Bone pain10 | Year 1 | 148 (54.8) | 115 (49.6) | 0.52 (−0.5 to 1.5) | 0.29 |
| Year 2 | 123 (45.6) | 104 (44.8) | 0.02 −0.6 to 0.7) | 0.94 | |
| Year 3 | 130 (48.1) | 112 (48.3) | 0.68 (−0.1 to 1.5) | 0.09 | |
| Bone pain due to PDB11 | Year 1 | 44 (16.3) | 40 (17.2) | −0.57 (−1.7 to 0.6) | 0.34 |
| Year 2 | 40 (14.8) | 36 (15.5) | 1.30 (0.3–2.3) | 0.009 | |
| Year 3 | 34 (12.6) | 37 (15.9) | −0.71 (−2.0 to 0.5) | 0.26 |
Values are n (mean ± SE) or n (%) as indicated. Positive scores for standardized mean difference favor the intensive group and negative scores the symptomatic group. Comparison between groups is adjusted for IPTW (%).
IPTW = inverse probability of treatment weighted.
Patient reported bone pain.
Bone pain considered by the clinician to be due to Paget's disease.
Fractures and orthopedic procedures
Fractures and orthopedic procedures that occurred during the study are summarized in Table 4. There was a nonsignificant excess of patients with fractures in the intensive group (22 versus 12; adjusted hazard ratio 1.90; 95% CI, 0.91 to 3.98; p = 0.087). The same was true of orthopedic procedures (15 versus 7; adjusted hazard ratio 1.81; 95% CI, 0.71 to 4.61; p = 0.214). Most fractures occurred in unaffected bone and might have been due to osteoporosis, but a similar trend was observed for fractures and orthopedic procedures in bone that was affected by PDB. No fractures were observed that met the ASBMR criteria for atypical femoral fractures.(21) However, six of the seven fractures (85%) that occurred in Pagetic bone affected the subtrochanteric or diaphyseal region of deformed femurs. One of these occurred in a patient in the intensive group at the site of a preexisting stress fracture and was preceded by the occurrence of local pain. Twelve patients in the intensive group (4.4%) had previously suffered a fracture during PRISM as compared with 22 in PRISM‐EZ (8.1%). By comparison, 13 patients (5.6%) in the symptomatic group suffered a fracture during PRISM as compared with 12 in PRISM‐EZ (5.2%). Only one patient who suffered a fracture during PRISM also fractured in PRISM‐EZ, but different bones were affected. There was no significant association between low ALP values and the occurrence of fractures; of the 34 patients who suffered a fracture during PRISM‐EZ, 17 (50%) were recorded as having a low ALP value, compared with 247 of 468 patients (52.7%) with a low ALP that did not suffer a fracture (p = 0.85, Fishers exact test). Fractures and orthopedic procedures, when combined, were significantly more common in the intensive group (adjusted hazard ratio 1.92; 95% CI, 1.04 to 3.53; p = 0.036) although caution should be exercised in the interpretation of this result because it was not a prespecified analysis in the study protocol.
Effect of Treatment on Fractures and Orthopedic Procedures
| Intensive (n = 270) | Symptomatic (n = 232) | Hazard ratio (95% CI) | p | |
| Patients with fracture, n (%) | 22 (8.1) | 12 (5.2) | 1.90 (0.91–3.98) | 0.087 |
| Fractures, n | 24 | 12 | ||
| Fractures in Pagetic bone, n | 5 | 2 | ||
| Patients requiring orthopedic surgery, n (%) | 15 (5.6) | 7 (3.0) | 1.81 (0.71–4.61) | 0.214 |
| Number of procedures, n | 16 | 9 | ||
| Procedures in Pagetic bone, n | 7 | 4 | ||
| Joint replacements | 11 | 4 | ||
| Osteotomy | 2 | 2 | ||
| Other procedures | 1 | 3 | ||
| Patients with fracture or orthopedic surgery, n (%) | 34 (12.6) | 17 (7.3) | 1.92 (1.045–3.53) | 0.036 |
| Patients with fracture and orthopedic surgery, n | 3 | 3 | ||
| Fractures and orthopedic procedures, n | 40 | 22 |
Comparison between groups is adjusted using IPTW. The hazard ratio and p values are for time to first event.
IPTW = inverse probability of treatment weighted.
Exposure to bisphosphonates and skeletal events
Because both treatment groups received bisphosphonates during the study we conducted an exploratory analysis to evaluate possible associations between bisphosphonate use during PRISM‐EZ and skeletal events. The results for fracture are shown in Supporting Table 6 and for orthopedic procedures in Supporting Table 7. This showed that fractures were more common in patients that received bisphosphonates in the intensive group (12.7% versus 3.1%, p = 0.0036), the symptomatic group (12.7% versus 0%, p < 0.0001), and both groups combined (14.1% versus 1.5%, p < 0.0001). There was no association between treatment with individual bisphosphonates and fracture. There was no significant excess of orthopedic procedures in patients that received bisphosphonates as compared with those that did not, in the intensive group (4.0% versus 7.6%, p = 0.285), the symptomatic group (5.1% versus 1.5%, p = 0.076), or both groups combined (4.4% versus 4.4%, p = 1.00).
Adverse events
Adverse events reported during the study are summarized in Table 5. There was a nonsignificant excess of serious adverse events in the intensive group (32.2% versus 28.4%; relative risk 1.28; 95% CI, 0.96 to 1.42). However, the proportion of patients with nonserious adverse events was almost identical in both groups (relative risk 0.99; 95% CI, 0.92 to 1.08). Some rare adverse events that have previously been associated with bisphosphonates were numerically more common in the intensive group including osteonecrosis of the jaw (1 versus 0), uveitis (1 versus 0), arrhythmias (14 versus 5), and delayed fracture healing (2 versus 1).
Adverse Events Reported During Study
| Intensive (n = 270) | Symptomatic (n = 232) | Relative risk (95% CI) | |
| Serious adverse events | 87 (32.2) | 66 (28.4) | 1.28 (0.96–1.72) |
| Total number of adverse events | 226 (83.7) | 196 (84.5) | 0.99 (0.92–1.08) |
| Cardiovascular | 67 (24.8) | 49 (21.1) | 1.080 (0.76–1.52) |
| Cerebrovascular | 4 (1.5) | 3 (1.3) | 1.027 (0.20–5.18) |
| CNS | 28 (10.4) | 28 (12.1) | 0.918 (0.54–1.56) |
| Endocrine | 28 (10.4) | 21 (9.1) | 1.628 (0.92–2.87) |
| ENT | 28 (10.4) | 26 (11.2) | 1.020 (0.59–1.75) |
| Gastrointestinal | 54 (20.0) | 46 (19.8) | 1.014 (0.69–1.48) |
| Genitourinary | 41 (15.2) | 39 (16.8) | 1.024 (0.67–1.57) |
| Hematological | 10 (3.7) | 9 (3.9) | 1.081 (0.43–2.71) |
| Musculoskeletal | 123 (45.6) | 104 (44.8) | 1.063 (0.86–1.31) |
| Miscellaneous | 33 (12.2) | 32 (13.8) | 0.993 (0.61–1.62) |
| Respiratory | 48 (17.8) | 43 (18.5) | 0.911 (0.61–1.35) |
| Ophthalmic | 34 (12.6) | 41 (17.7) | 0.685 (0.44–1.07) |
| Skin | 41 (15.2) | 33 (14.2) | 1.108 (0.70–1.74) |
Values are n (%) of people with at least one event.
CNS = central nervous system; ENT = ear, nose, or throat.
Discussion
The aim of the PRISM‐EZ study was to determine whether long‐term suppression of bone turnover with intensive bisphosphonate therapy conferred any clinical advantage over symptomatic treatment in patients with established PDB. On entry to PRISM‐EZ, participants had already been treated with intensive or symptomatic therapy for an average of 4.3 years, which when added to treatment given during PRISM‐EZ, provided a total duration of treatment and follow up of 7.3 years. As expected, serum ALP concentrations were significantly lower in the intensive group at baseline and the differences between groups increased as the study progressed. However, we observed no consistent differences in patient reported outcomes such as quality of life, bodily pain, or bone pain between the two treatment groups. There were statistically significant differences at year 1 in bodily pain, physical component summary score, and arthritis‐specific health index favoring the intensive group, but the effect size was small and below the five‐point threshold that is considered clinically significant. Bone pain rated by the physician as being due to PDB was less common at year 2 in the intensive group but the magnitude of effect was small and differences were not observed at other time‐points. The pain data are consistent with the findings of Reid and colleagues,(6) who reported that zoledronic acid treatment improved SF36 bodily pain score by a margin of about two points when compared with risedronate. Taken together, these observations suggest that zoledronic acid may have a slightly greater effect on pain and quality of life than less potent bisphosphonates. In the PRISM‐EZ study, however, the effects of intensive bisphosphonate therapy on pain and quality of life were transient and below the threshold that is considered clinically significant. Also there was no clear association between suppression of bone turnover and symptom control, emphasized by the fact that SF36 bodily pain scores were similar in subgroups of patients with low ALP, normal ALP, and high ALP throughout the study.
There was a nonsignificant increase in the risk of fractures, orthopedic procedures, and serious adverse events with intensive therapy. We also found that in both treatment groups, patients who suffered fractures were more likely to have received bisphosphonates than those who had not suffered fractures. Because the number of events was small it is difficult to draw firm conclusions, but the data raise the possibility that prolonged suppression of bone turnover in PDB might increase the risk of fracture. In this regard, oversuppression of bone turnover has been associated with an increased risk of atypical fractures in both osteoporosis(22, 23) and PDB.(24)
Like all trials, the PRISM‐EZ study has weaknesses. The number of fractures and orthopedic procedures was small and although there was an excess of both events in the intensive group, this could have been a chance finding. It is also important to emphasize that participants in PRISM‐EZ were a selected group because only about one‐half of the subjects who completed PRISM went onto take part in PRISM‐EZ. Nonetheless, the clinical characteristics of patients who participated in PRISM‐EZ were similar to those that did not, apart from the fact that they were about 4 years younger. Finally, the study focused on patients with established PDB, most of whom had previously been treated with bisphosphonates and had already developed complications such as bone pain, fractures, and deformity. It is therefore important to emphasize that the lack of benefit of intensive bisphosphonate treatment on clinical outcome may not apply to previously untreated patients with early PDB. The PRISM‐EZ study has several strengths, however. It is the largest and longest running clinical trial ever to be conducted in PDB and is the only trial that has examined the effects of treatment on fractures and orthopedic procedures. Because the participants that entered PRISM‐EZ were typical of those being treated in secondary care in the UK, it is likely that the results are generalizable to patients with established PDB who have already been treated with bisphosphonates. The results reported here do not support the recommendations made by the Endocrine Society guideline group,(12) which suggested that most patients with PDB should be treated with potent bisphosphonates with the aim of restoring ALP values to within the lower part of the reference range. On the contrary, the PRISM‐EZ study demonstrates that this strategy is not associated with clinical benefit and might be harmful. Rather, the data from PRISM‐EZ suggests that a more appropriate indication for bisphosphonate treatment in PDB is to control bone pain thought to be due to disease activity.
Disclosures
SHR reports having received consulting fees on behalf of his institution from Novartis and Merck and research grants to his institution from Amgen, Eli Lilly, and UCB. WDF reports having received consultancy fees from Siemens, Becton Dickinson, and Roche. PLS reports having received consultancy fees from Internis. The other authors have no conflicts to declare.
Acknowledgments
The study was supported by grants from Arthritis Research UK (Ref: 18304) and the Paget's Association (UK). The funders had no role in the study design, data collection or analysis, preparation of the manuscript, or decision to publish. Anonymized patient level data from the PRISM‐EZ study are available on application to the corresponding author. We thank all the participants without whose help the study would never have succeeded. Thanks are also due Lyndsey Milne for administrative support; members of the independent members of the trial steering committee Maarten Boers (Chair), Juliet Compston, Philip Hannaford, Marilyn McCallum, and R Graham Russell, and to the Data Monitoring Committee: Ernest Choy (Chair 2001‐2006), Sarah Hewlett, and Chris Roberts.
Authors’ roles: SHR had full access to all the data in the study and takes responsibility for integrity of the data and accuracy of the data analysis. Study concept and design: SHR. Acquisition of data: SHR, KG, AT, AW, PLS. Analysis and Interpretation of data: GSM, JH, SHR, AW, AT, WDF, PLS. Drafting of the manuscript: AT, SHR. Critical revision of the manuscript for important intellectual content: SHR, AT, KG, GSM, PLS, WDF, AW. Statistical Analysis: JH, GSM. Obtaining Funding: SHR, PLS, WDF. Study Supervision: KG, SHR, AW.
Members of the PRISM‐EZ Research Group
Clinical Centres: Aberdeen Royal Infirmary, UK, Vera Herd, Stuart H Ralston*; University Hospital Aintree, UK, Jacqui O'Hare, Mashood Siddiqi*; Musgrave Park Hospital, Belfast, UK, Val Ferguson, Richard Wallace*; Royal Bolton Hospital, UK, Keatley RH Adams*, Mary Adams; Western General Hospital Edinburgh, UK, Cathy Hall, Stuart H Ralston; Ninewells Hospital, Dundee, UK, Vera Herd, Graham Leese*, Ellen Malcolm; Medway Maritime Hospital, Gillingham, UK, Paul Ryan*, Gwen Worcester; Western Infirmary, Glasgow, UK, Alastair McLellan*, Debby Nelson; Huddersfield Royal Infirmary, UK, Allan Fairclough, Cheryl Fernandes*; Raigmore Hospital, Inverness, UK, Fiona McGhie, Malcolm Steven*; Airedale Hospital, Keighley, UK, Stuart H Ralston*; Leicester Royal Infirmary & Leicester General Hospital, UK, Margaret Coe, S Javed Iqbal*, Geraldine McHugh; Royal Liverpool University Hospital, UK, William D Fraser*, Ya‐Wen Jessica Huang; King's College Hospital, London, UK, Rama Chandra, Tina Mangion, Caje Moniz*; Manchester Royal Infirmary, UK, Caroline Dacre, Peter L Selby*; Freeman Hospital, Newcastle, UK, Terry Aspray*, Christine King; Norfolk & Norwich University Hospital, UK, Jane Leeder, David GI Scott*; Robert Jones & Agnes Hunt Orthopaedic Hospital, Oswestry, UK, Michael Davie*, Teresa Jones, Clare Mathews; Nuffield Orthopaedic Centre, Oxford, UK, M Kassim Javaid*, Nicola McHugh; Llandough Hospital, Penarth, UK, Roz Broadbent, Jane Turton*; Harold Wood Hospital, Romford, UK, Kuntal Chakravarty*; Oldchurch Hospital, Romford, UK, Christine Heron, Christopher Kelsey*; Hope Hospital, Salford, UK, Penny Storrs, Terence W O'Neill*; Northern General Hospital, Sheffield, UK, Jenny Cliffe, Eugene McCloskey*; Southampton General Hospital, UK, Janet Cushnaghan, Cyrus Cooper*; Royal National Orthopaedic Hospital, Stanmore, UK, Richard Keen*, Jeanette Brown; The Great Western Hospital, Swindon, UK, Lynne Kerton, Elizabeth Price*; Arrowe Park Hospital, Wirral, UK, Eddie George*, Nicky Allan; Yeovil District Hospital, UK, Rebecca Rowland Axe, Clare Buckley, Raj Sengupta*. (*Principal Investigators at each center are indicated by asterisks.)
References
Author notes
Public clinical trial registration: http://www.isrctn.com/ISRCTN12989577. Multi‐center Randomized Controlled Trial of Symptomatic Versus Intensive Bisphosphonate Therapy for Paget's Disease.
For a Commentary on this article, please see Cundy (J Bone Miner Res. 2017;32:1163–1164. DOI: 10.1002/jbmr.3156).
