


ABSTRACT
The Skeletal Histomorphometry in Patients on Teriparatide or Zoledronic Acid Therapy (SHOTZ) study assessed the progressive effects of teriparatide (TPTD) and zoledronic acid (ZOL) on bone remodeling and material properties in postmenopausal women with osteoporosis. Previously, we reported that biochemical and histomorphometric bone formation indices were significantly higher in patients receiving TPTD versus ZOL. Here we report bone mineralization density distribution (BMDD) results based on quantitative backscattered electron imaging (qBEI). The 12‐month primary study was randomized and double blind until the month 6 biopsy, then open label. Patients (TPTD, n = 28; ZOL, n = 31) were then eligible to enter a 12‐month open‐label extension with their original treatment: TPTD 20 μg/d (subcutaneous injection) or ZOL 5 mg/yr (intravenous infusion). A second biopsy was collected from the contralateral side at month 24 (TPTD, n = 10; ZOL, n = 10). In cancellous bone, ZOL treatment was associated at 6 and 24 months with significantly higher average degree of mineralization (CaMEAN, +2.2%, p = 0.018; +3.9%, p = 0.009, respectively) and with lower percentage of low mineralized areas (CaLOW, –34.6%, p = 0.029; –33.7%, p = 0.025, respectively) and heterogeneity of mineralization CaWIDTH (–12.3%, p = 0.003; –9.9%, p = 0.012, respectively), indicating higher mineralization density and more homogeneous mineral content versus TPTD. Within the ZOL group, significant changes were found in all parameters from month 6 to 24, indicating a progressive increase in mineralization density. In sharp contrast, mineralization density did not increase over time with TPTD, reflecting ongoing deposition of new bone. Similar results were observed in cortical bone. In this study, TPTD stimulated new bone formation, producing a mineralized bone matrix that remained relatively heterogeneous with a stable mean mineral content. ZOL slowed bone turnover and prolonged secondary mineralization, producing a progressively more homogeneous and highly mineralized bone matrix. Although both TPTD and ZOL increase clinical measures of bone mineral density (BMD), this study shows that the underlying mechanisms of the BMD increases are fundamentally different. © 2016 The Authors. Journal of Bone and Mineral Research published by Wiley Periodicals, Inc. on behalf of American Society for Bone and Mineral Research (ASBMR).
Introduction
The Skeletal Histomorphometry in Patients on Teriparatide or Zoledronic Acid Therapy (SHOTZ) study assessed the progressive effects of 2 years of treatment with teriparatide, a known osteoanabolic agent, and zoledronic acid, a prototypical antiresorptive agent, on bone remodeling and material properties in postmenopausal women with osteoporosis. Previously, we reported the marked difference in the mechanism of action of teriparatide and zoledronic acid based on histomorphometric analysis of bone biopsies from postmenopausal women at months 6 and 24.(1, 2) Bone formation indices were consistently higher for patients receiving teriparatide versus zoledronic acid at both early and later time points. The dynamic indices, particularly mineralizing surface/bone surface, provided the best discrimination between the two classes of drug.
In this analysis, we report results for bone mineralization density distribution (BMDD), measures that describe the frequency distribution of calcium concentrations occurring in the bone matrix.(3) BMDD reflects bone turnover, mineralization kinetics, and average bone matrix age; provides additional insight into the structure‐function relation of the bone matrix, including its elasticity, strength, and toughness; and differs from bone mineral density (BMD) as measured by dual‐energy X‐ray absorptiometry (DXA), which is an estimate of mean areal mineral density in a scanned area of whole bone (organ level).
Although BMD has been shown to be correlated with bone strength, structural and material properties of bone matrix are important factors in determining the mechanical competence of bone.(4, 5, 6, 7, 8) The goal of the current analysis was to compare the BMDD of patients treated with teriparatide versus zoledronic acid over time in cancellous and cortical bone of postmenopausal women with osteoporosis using quantitative backscattered electron imaging (qBEI), a validated measure of BMDD in bone biopsies that detects even small changes in mineralization resulting from therapeutic interventions.(3) This is the first head‐to‐head study to compare the effects of an anabolic versus an antiresorptive agent on BMDD over time
Materials and Methods
Patients
SHOTZ (Clinicaltrials.gov# NCT00927186) was a phase 4 randomized, double‐blind, active‐comparator controlled, cross‐sectional biopsy study conducted at 12 US and Canadian centers. The study protocol was approved by the study centers' ethical review boards, and all patients provided written informed consent. The rationale, objectives, and design of the SHOTZ study have been described.(1, 2) In brief, SHOTZ was a 2‐year study to assess the biological effects of teriparatide and zoledronic acid based on histomorphometric indices and material properties (mineralization density, crystallinity, and collagen maturity) in ambulatory postmenopausal women with osteoporosis aged 55 to 89 years. The 12‐month, primary study was randomized and double‐blind up to the month 6 biopsy; after that biopsy, the study became open label for 6 additional months (Fig. 1, study design). Patients who completed the primary SHOTZ study and had a biopsy at month 6 were eligible to enroll in the 12‐month extension and assigned open label to their original treatment regimen: TPTD 20 μg/d (subcutaneous injection) or ZOL 5 mg/yr (intravenous infusion) (Fig. 1). A second transiliac crest biopsy was collected from the contralateral side at month 24.
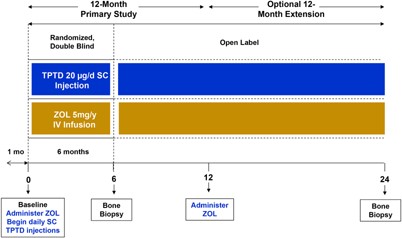
Study design.
Quantitative backscattered electron imaging
Quantitative backscattered electron imaging (qBEI) was used to obtain BMDD measurements from the same bone samples used for the histomorphometric analysis. This process has been described in detail in previous publications.(3) In brief, the physical principle of the technique is based on a quantification of the intensity of electrons backscattered from the surface of a sectioned bone area. The obtained signal is proportional to the weight fraction of calcium (Ca wt.%) present locally in the resin‐embedded bone tissue. In this study, qBEI images with a pixel resolution of 4 μm per pixel were obtained from the entire longitudinal section of the biopsy cylinder containing the two cortical plates and the cancellous bone compartment. Cancellous and cortical bone images were analyzed separately for cancellous and cortical BMDD, respectively.
Although bone histomorphometry findings may vary widely among healthy individuals,(9) BMDD in healthy human adults has been found to be essentially constant for cancellous bone; biological factors, including ethnicity, sex, age, and skeletal site have not been shown to statistically significantly influence BMDD parameters in adult individuals.(10, 11) Therefore, a reference BMDD was calculated using the qBEI method on cancellous bone samples from 52 healthy adult humans in order to quantify deviations from normal mineralization.(10) Cortical BMDD reference data were measured in transiliac bone biopsy samples from 73 healthy women aged 25 to 48 years.(11) BMDD parameters are described in Table 1. A BMDD with a higher CaMEAN and CaPEAK relative to the normal reference BMDD was designated as a shift to higher mineralization density. A BMDD with lower CaMEAN and CaPEAK relative to normal was a shift to lower mineralization density. For BMDDs with broader or narrower peaks than normal, we applied the terms more heterogeneous or more homogeneous, respectively.
BMDD Parameters Assessed
| CaMEAN (wt% Ca): |
| Mean calcium concentration in the area of bone measured |
| CaPEAK (wt% Ca): |
| The most frequent calcium concentration occurring in the area of bone measured |
| CaWIDTH (Δwt% Ca): |
| A measure of variability of calcium concentrations in the measured bone area (heterogeneity of mineralization) |
| CaLOW (% bone area): |
| A measure of the percentage of bone area with low calcium concentrations (below 17.68 wt% Ca, which represents areas undergoing primary mineralization) |
| CaHIGH (% bone area): |
| A measure of the percentage of bone area with high calcium concentrations (above 25.30 wt% Ca, which represents predominantly fully mineralized, interstitial bone) |
Ca = calcium.
Additionally, the BMDD parameters of cancellous bone were analyzed for correlation with previously obtained cancellous mineralizing surface per bone surface (MS/BS), a primary histomorphometric index of bone formation/turnover.(1, 2)
Statistical analysis
Demographics and baseline characteristics were summarized by treatment group for the overall population and for the subset of patients with biopsies at both 6 and 24 months (paired biopsy subset). Categorical variables were summarized by frequencies and percentages. Continuous variables were summarized by means and standard deviations (SDs). Categorical variables were analyzed using Fisher's exact text, and continuous variables were analyzed using a t test at a two‐sided alpha level of 0.05. Efficacy analyses were performed on the modified intent to treat population of patients who entered the study and received at least 1 dose of study drug. Efficacy variables were analyzed using a paired t test within treatment group and using ANOVA models between treatment groups. Correlation coefficients r and corresponding p values between two response variables are based on Pearson Product Moment correlations.
Results
Of 59 patients who had evaluable biopsies at month 6 (teriparatide = 28; zoledronic acid = 31), 21 entered the 12‐month study extension (teriparatide, n = 10; zoledronic acid, n = 11). Ten patients receiving teriparatide and 10 patients receiving zoledronic acid had evaluable biopsies for both months 6 and 24 (Fig. 2). A biopsy was not collected at month 24 for 1 patient in the zoledronic acid group. The baseline characteristics were well balanced between treatment groups (Table 2).
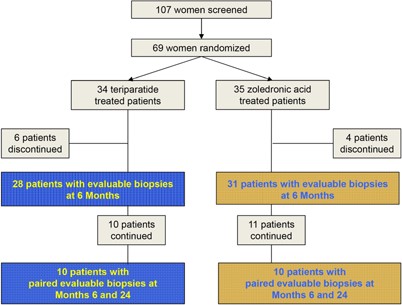
Patient disposition.
Baseline Characteristics
| Overall population | Paired biopsy subset | |||
| Measure | TPTD (n = 34) | ZOL (n = 35) | TPTD (n = 10) | ZOL (n = 10) |
| Age, years (mean ± SD) | 65 ± 7 | 64 ± 6 | 67 ± 8 | 64 ± 5 |
| Race (n, %) | ||||
| Black or African American | 1 (2.9) | 1 (2.9) | 1 (10.0) | 1 (10.0) |
| White | 33 (97.1) | 34 (97.1) | 9 (90.0) | 9 (90.0) |
| T‐score (mean ± SD) | ||||
| Lumbar spine | −2.79 ± 0.8 | −2.93 ± 0.8 | –2.92 ± 0.8 | –2.63 ± 1.1 |
| Femoral neck | −2.25 ± 0.7 | −2.29 ± 0.7 | –2.56 ± 0.5 | –2.06 ± 0.5* |
| Total hip | −1.78 ± 0.8 | −1.88 ± 0.9 | –1.81 ±0.6 | –1.74 ± 0.6 |
| Previous fracture (n, % yes) | 14 (41.2) | 17 (48.6) | 5 (50.0) | 7 (70.0) |
| Previous osteoporosis therapy (n, % yes) | 17 (50.0) | 21 (60.0) | 0 (0.0) | 2 (20.0) |
| Bone turnover markers (mean ± SD)4 | ||||
| P1NP (μg/L) | 49.18 ± 18.3 | 52.88 ± 19.4 | 46.20 ± 15.8 | 55.38 ± 17.8 |
| CTX (ng/mL) | 0.43 ± 0.2 | 0.42 ± 0.2 | 0.38 ± 0.2 | 0.45 ± 0.2 |
| OC (μg/L) | 25.05 ± 8.4 | 24.92 ± 8.5 | 24.84 ± 8.3 | 22.89 ± 7.2 |
CTX = serum carboxy terminal cross‐linking telopeptide of type 1 collagen; OC = osteocalcin; P1NP = serum type 1 procollagen (N‐terminal).
*p < 0.05 between treatment groups (t test).
Modified intent‐to‐treat population.
Fig. 3 shows the distinct differences between the treatment groups in the qBEI images acquired from the bone biopsy samples. In the TPTD‐treated samples, new bone packets with predominantly low mineral content (blue arrows) can be identified at both 6 and 24 months. In contrast, in the ZOL‐treated samples, bone packets with comparably low mineral content are lacking. At 6 months, the bone packets with the lowest level of mineral content with ZOL treatment (orange arrows) have a higher degree of mineralization compared with those with TPTD treatment. At 24 months of ZOL treatment, all the bone packets have a rather similar high mineral content.
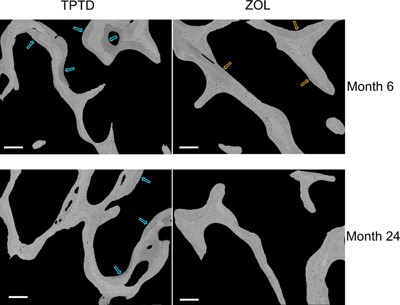
Examples of qBEI images of cancellous bone from paired biopsy samples. qBEI images from one TPTD‐ and one ZOL‐treated patient; brighter pixels indicate higher mineral content. For TPTD, low mineralized bone packets (blue arrows) at both 6 and 24 months suggest recently formed bone matrix. For ZOL, at 6 months bone packets with the lowest mineral content (orange arrows) have greater mineralization versus TPTD treatment. Scale bars = 250 μm.
Differences between treatment groups (TPTD versus ZOL)
The mean BMDD curves for the treatment groups (Fig. 4) at month 6 showed a distinctly broader peak (more heterogenous matrix mineralization) for the TPTD group compared with that for the ZOL group. At month 24, the TPTD group still had a broader peak than the ZOL group, and additionally, the BMDD curve of the ZOL group was shifted to the right, including values indicating higher matrix mineralization above that of the reference BMDD curve. Conversely, the TPTD BMDD curve was shifted leftward, including values indicating lower matrix mineralization below the reference BMDD curve.
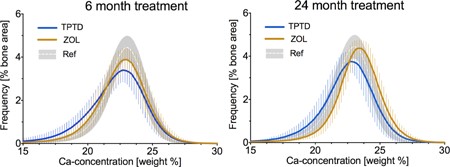
Cancellous BMDD curves at month 6 and month 24 of TPTD versus ZOL treatment. The BMDD solid lines represent group means of each histogram bin interconnected by line. Error bars correspond to ± 1 SD of each mean histogram bin value. Ref indicates cancellous reference BMDD for healthy adults (gray area shows mean ± 1 SD).(10)
Statistical analysis of the BMDD parameters derived from the BMDD curves revealed significant differences between the treatment groups. In cancellous bone, CaMEAN, CaWIDTH, and CaLOW provided the clearest distinction between TPTD and ZOL at months 6 and 24 (Table 3). In the ZOL group, CaMEAN (+2.2 %, p = 0.018; +3.9 %, p = 0.009 at months 6 and 24, respectively) was significantly higher, whereas CaWIDTH (–12.3%, p = 0.003; –9.9%, p = 0.012) and CaLOW (–34.6%, p = 0.029; –33.7%, p = 0.025) were significantly lower at both time points. In cortical bone, similar group differences to those in cancellous bone were observed (Table 3, Supplemental Table S1). These BMDD differences indicate a higher mineralization density and a more homogeneous mineral content with zoledronic acid compared with teriparatide at both time points.
BMDD Parameters Findings: Cancellous and Cortical Bone
| Month 6 | Month 24 | ||||||
| Parameter | TPTD n = 28 | ZOL n = 31 | p Value TPTD versus ZOL at month 6 | TPTD n = 10 | ZOL n = 10 | p Value TPTD versus ZOL at month 24 | Reference BMDD6 |
| Cancellous | |||||||
| CaMEAN (wt% Ca) | 21.66 (0.88) | 22.14 (0.62) | 0.018 | 22.04 (0.82) | 22.90*** (0.42) | 0.009 | 22.20 (0.45) |
| CaPEAK (wt% Ca) | 22.57 (0.88) | 22.84 (0.58) | 0.176 | 22.75 (0.71) | 23.34* (0.41) | 0.036 | 22.96 [22.70; 23.14] |
| CaWIDTH (Δwt% Ca) | 4.30 (0.81) | 3.77 (0.39) | 0.003 | 3.73** (0.36) | 3.36*** (0.15) | 0.012 | 3.29 [3.12; 3.47] |
| CaLOW (% bone area) | 7.48 (5.84) | 4.89 (1.32) | 0.029 | 5.43 (2.16) | 3.60*** (0.32) | 0.025 | 4.52 [3.87; 5.79] |
| CaHIGH (% bone area) | 6.06 (4.12 | 7.12 (4.90) | 0.374 | 7.07 (5.84) | 12.04* (5.91) | 0.075 | 4.62 [3.52; 6.48] |
| Cortical | |||||||
| CaMEAN (wt% Ca) | 21.51 (0.72) | 22.06 (0.57) | 0.002 | 21.92 (0.67) | 22.66** (0.34) | 0.006 | 22.10 (0.55) |
| CaPEAK (wt% Ca) | 22.56 (0.63) | 22.82 (0.55) | 0.096 | 22.58 (0.70) | 23.20* (0.35) | 0.021 | 22.86 (0.53) |
| CaWIDTH (Δwt% Ca) | 4.72 (1.04) | 4.21 (0.46) | 0.021 | 4.21 (0.50) | 3.83** (0.24) | 0.050 | 3.73 [3.53; 4.27] |
| CaLOW (% bone area) | 8.83 (4.68) | 5.44 (1.84) | 0.001 | 5.21*** (1.36) | 3.46*** (0.57) | 0.003 | 5.47 (1.85) |
| CaHIGH (% bone area) | 5.96 (3.60) | 7.32 (4.59) | 0.213 | 6.72 (5.86) | 9.95 (4.62) | 0.188 | 5.72 [3.91; 8.49] |
Data are presented as mean (standard deviation) or median [25th; 75th percentiles].
Reference BMDD: Cancellous reference BMDD was obtained from bone samples of different skeletal sites from 52 healthy individuals aged 25 to 97 years(19); cortical reference BMDD was measured in transiliac bone biopsy samples from 73 premenopausal healthy women aged 25 to 48 years.(11)
***p < 0.001, **p < 0.01, *p < 0.05 within treatment group, 6 versus 24 months.
Differences within treatment groups (6 versus 24 months)
In the TPTD‐treated patients, none of the cancellous BMDD parameters was significantly altered from 6 to 24 months of treatment with the exception of CaWIDTH, which was decreased (–13.3%, p = 0.005). In cortical bone, the continuation of TPTD treatment decreased CaLOW (–41.0%, p < 0.001) (Table 3, Supplemental Table S1).
In the ZOL‐treated patients, all cancellous BMDD parameters were significantly affected by the ongoing treatment. CaMEAN (+3.4%, p < 0.001), CaPEAK (+2.2%, p = 0.014), and CaHIGH (+69.1%, p = 0.012) increased, whereas CaWIDTH (–10.9%, p < 0.001) and CaLOW (–26.4%, p < 0.001) decreased from 6 to 24 months of ZOL treatment. Similarly in cortical bone, CaMEAN (+2.7%, p = 0.003) and CaPEAK (+1.7%, p = 0.043) increased, whereas CaWIDTH (–9.0%, p = 0.002) and CaLOW (–36.4%, p < 0.001) decreased during continuation of ZOL therapy (Table 3, Supplemental Table S1). When BMDD parameters were assessed for the paired biopsy subset, similar numerical trends were observed both between and within the treatment groups (Fig. 5).
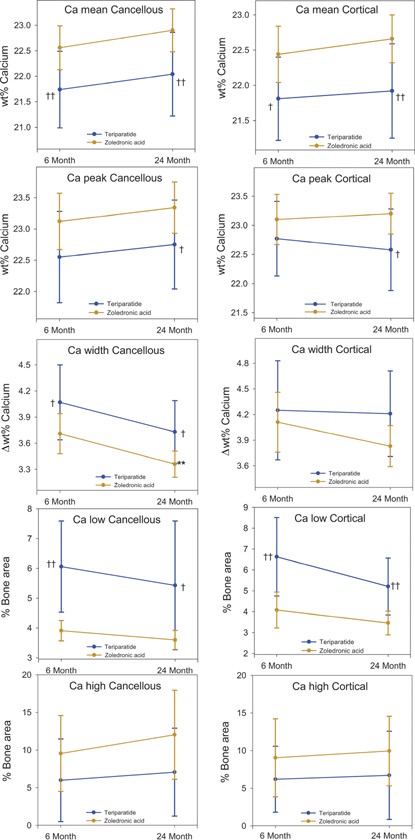
BMDD parameters in cancellous and cortical bone at 6 and 24 months from patients with paired biopsies. Values are shown as mean (SD). p values: within group between 6 and 24 months, paired t test (**p < 0.01); between groups at 6 and at 24 months, two‐sample t test (†p < 0.05; ††p < 0.01).
The relationship between cancellous and cortical CaMEAN was analyzed for both treatment groups separately (Fig. 6). Although cancellous CaMEAN was correlated with cortical CaMEAN at both 6 months and 24 months of TPTD treatment, this correlation was only found at 6 months of ZOL treatment. At 24 months of ZOL treatment, both cancellous and cortical CaMEAN were relatively high and showed only a low variation within this treatment group (Fig. 6).
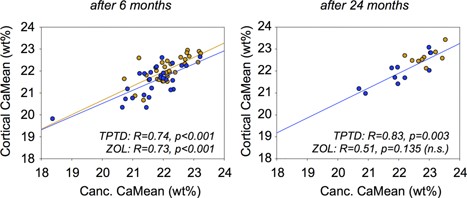
Cancellous (Canc.) CaMEAN versus cortical CaMEAN for each patient after 6 months (left) and 24 months (right) of therapy (blue = TPTD; bronze = ZOL). The data suggest a strong correlation between the average degree of mineralization in both compartments. The data from the ZOL 24‐month group were not significantly correlated because the variation of both cancellous CaMean and cortical CaMean is too low.
Relationship of BMDD parameters to histomorphometric mineralizing surface per bone surface
A significant negative correlation was observed in cancellous bone at 6 months for MS/BS versus CaMEAN in the TPTD treatment group (Fig. 7). MS/BS was also significantly correlated with CaPEAK (r = –0.70, p < 0.001) CaWIDTH (r = 0.81, p < 0.001), and CaLOW (r = 0.86, p < 0.001) from TPTD‐treated patients at 6 months. MS/BS was not significantly correlated with BMDD parameters in the smaller 24‐month data set for the TPTD group or with BMDD parameters at 6 or 24 months in the ZOL treatment group, with the exception of a negative correlation with CaLOW at 24 months (r = –0.71, p = 0.034).
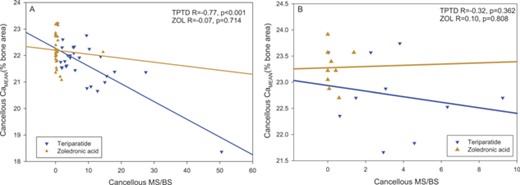
Correlation of mineralizing surface per bone surface (MS/BS) with average mineral content (CaMean) in cancellous bone at (A) 6 months and (B) 24 months of treatment. No significant relationship was observed with ZOL treatment (bronze symbols), whereas with TPTD, MS/BS outcomes were predictive for CaMean at 6 months (blue symbols). For the TPTD group excluding the robust responder, in cancellous bone at 6 months r = –0.46, p = 0.015.
Discussion
In this study, TPTD stimulated new bone formation, producing a bone matrix mineralization that remained relatively heterogeneous with a stable mean mineral content with continuation of therapy, whereas treatment with ZOL slowed the bone turnover rate, which would prolong secondary mineralization, producing a more homogeneous and, over time, a more highly mineralized bone matrix.
Our findings reflect the typical changes in bone matrix mineralization expected with changes in bone turnover. When bone turnover is increased, a higher proportion of younger, newly formed bone packets having a relatively lower calcium concentration are present. Thus, increased bone turnover leads to a higher percentage of the entire bone area having lower calcium concentrations (increasing CaLOW and CaWIDTH) and to lower average calcium concentrations (CaMEAN).(12, 13) In this study, these characteristic changes are clearly observed in the TPTD compared with ZOL‐treated patients after both 6 and 24 months of treatment. In terms of tissue mineralization, 6 months of treatment is rather brief; therefore, it is notable that the differences in the mechanism of action of TPTD and ZOL are clearly visible after 6 months of therapy. These data confirm and extend the previous biochemical observations that the large changes in turnover with these two agents move in opposite directions and do so early in the course of treatment.(1) Furthermore, the significant correlation between cancellous and cortical BMDD parameters in each treatment group suggests that both bone compartments responded in a similar manner to the different agents.
The lower mineralization density in the TPTD arm in the present trial is consistent with data from patients receiving TPTD in the pivotal Fracture Prevention Trial, where bone matrix was evaluated by FTIR microspectroscopy.(14) Patients were treated with TPTD 20 and 40 μg/d and underwent bone biopsies after 12 months of treatment. Patients receiving either dose of TPTD exhibited significantly lower mineral to matrix ratios in all envelopes evaluated (periosteal, endocortical, and cancellous) compared with placebo.
In another study, Misof and colleagues evaluated BMDD at the iliac crest by qBEI using paired biopsies from men and women with osteoporosis before and after treatment with TPTD.(15) Both men and women treated for 18 to 36 months experienced greater heterogeneity of mineralization and broadening of CaWIDTH, reflecting an increased percentage of newly formed bone matrix with lower mineral density. Furthermore, changes in CaPEAK and CaWIDTH were correlated with bone formation rate per bone surface (BFR/BS) and osteoid perimeter showing that the higher the bone formation indices, the lower the CaPEAK and the higher the CaWIDTH. This relationship with histomorphometric bone turnover is consistent with the findings in the present study, where MS/BS was significantly correlated with cancellous CaMEAN at 6 months in the TPTD treatment group (Fig. 7).
The shift toward BMDD with lower mineralization density and peak broadening with TPTD presents a striking contrast to the treatment effect of bisphosphonates, which generally increase the degree and the homogeneity of mineralization compared with baseline or placebo.(16, 17, 18) This is consistent with the BMDD data from the current trial, which contrasted the effects of ZOL with those of TPTD. Potential hypermineralization has been discussed in connection with long‐term bisphosphonate therapy. In several studies of up to 5 years' treatment duration with oral bisphosphonates, evidence of hypermineralization was not observed.(19, 20, 21, 22) Moreover, in the Fracture Interventional Trial Long‐Term extension study of alendronate, the average mineral content of bone after 10 years of treatment did not exceed that of normal healthy adults.(19) However, in a recent qBEI study of patients in the HORIZON trial who were treated with IV zoledronic acid 5 mg/yr, the average mineralization density after 3 years of therapy was not only higher than that of placebo‐treated controls but also higher than the reference range in healthy individuals.(23)
Although the BMDD effects of continuation of therapy have been extensively studied for bisphosphonate treatment as mentioned above, there is much less information with regard to parathyroid hormone treatment. The changes with treatment in the ZOL group over time were readily apparent, with significant differences found between month 6 and month 24 in four of the five BMDD variables in both cancellous and cortical bone, reflecting progressive increases in mineralization density (Table 3). In contrast, there were few changes over time in the TPTD arm, with the only significant differences found in CaWIDTH in cancellous bone and CaLOW in cortical bone (Table 3). This is consistent with ongoing new bone formation and secondary mineralization of new bone matrix with TPTD treatment.
Treatment‐induced increases in clinically measured BMD are the sum of increases in bone volume and in the degree of bone matrix mineralization.(24) The lack of change over time in the degree of mineralization in the TPTD treatment group rules out the latter possibility and, therefore, our data are consistent with an increase in bone volume leading to higher BMD as reported previously.(25, 26) The increase in the degree of mineralization in the ZOL‐treated patients is consistent with previous findings after bisphosphonate therapy(18) and contributes to the increase in BMD reported for bisphosphonate therapy (eg, reviewed by Papapoulos(27)). These distinct and different effects of TPTD and ZOL on the skeleton are thought to contribute to the beneficial effect on fracture risk reduction.(28, 29)
The strength of the present bone biopsy study is that it is a longitudinal head‐to‐head comparison of the mechanism of action of two different anti‐fracture drugs on bone histomorphometric and matrix mineralization properties in a well‐defined cohort of patients. Limitations include that baseline biopsy samples were not available and that there were relatively low numbers of patients in the 24‐month extension groups, which limited the number of paired samples for evaluation of changes over time in the same patients. However, despite the low sample size, distinct differences could be observed because of the differences in the action of the drugs and because of the sensitivity of the qBEI method. It would be of interest in future studies to assess both BMDD and BMD in patients in whom anabolic therapy was followed by an antiresorptive agent. We hypothesize that because of the decrease in bone turnover rate, the BMDD peak would become narrower and shift toward higher calcium concentrations, similar to the effects observed generally after antiresorptive treatment. It is expected that such increases in average calcium concentration would contribute to further increases in BMD.
In conclusion, it has been demonstrated numerous times that both TPTD and ZOL increase clinical measures of BMD and reduce fracture risk. However, this study shows that the underlying mechanism for the BMD increase with each drug is fundamentally different. These results help to contrast the mechanisms of action of the two drugs, which result in markedly different effects on the material properties of both cancellous and cortical bone matrix.
Disclosures
DWD has received research grants from Eli Lilly and Co.; is a consultant and on advisory boards for Eli Lilly and Co., Amgen, and Merck; is on the speakers bureau at Eli Lilly and Co. and Amgen; and has received honoraria from Eli Lilly and Co., Amgen, Novartis, and Merck. JA, VAR, and KAT are employees of Eli Lilly and Co. All other authors state that they have no conflicts of interest.
Acknowledgments
The authors thank Daniela Gabriel, Petra Keplinger, Sonja Lueger, and Phaedra Messmer for sample preparation and quantitative backscatter electron imaging measurements at the Bone Material Laboratory of the Ludwig Boltzmann Institute of Osteology, Vienna, Austria, and Fangqui Zhang, formerly of inVentiv Health Clinical, Toronto, Canada, for statistical support. Thomas Melby of inVentiv Health Clinical, Cary, NC, USA, provided support in preparing the manuscript. This work was sponsored by Lilly USA, LLC.
Authors' roles: Study design: KAT and DWD. Study conduct: KAT and VAR. Data collection: DWD, KAT, VAR, JA, BMM, HZ, PR, EPP, and KK. Data analysis: JA, BMM, PR, EPP, and KK. Data interpretation: DWD, PR, BMM, HZ, KAT, VAR, JA, EPP, and KK. Drafting manuscript: KAT, DWD, BMM, PR, EPP, and KK. Revising manuscript content: KAT, JA, DWD, BMM, PR, EPP, and KK. Approving final version of manuscript: DWD, PR, BMM, HZ, KAT, VAR, JA, EPP, and KK. JA and PR take responsibility for the integrity of the data analysis.
References
Author notes
DWD and PR contributed equally to this work.
