


ABSTRACT
Previously, we reported the effects of teriparatide (TPTD) and zoledronic acid (ZOL) on bone formation based on biochemical markers and bone histomorphometry of the cancellous envelope at month 6 in postmenopausal women with osteoporosis who participated in the 12‐month primary Skeletal Histomorphometry in Subjects on Teriparatide or Zoledronic Acid Therapy (SHOTZ) study. Patients were eligible to enter a 12‐month extension on their original treatment regimen: TPTD 20 μg/day (s.c. injection) or ZOL 5 mg/year (i.v. infusion). A second biopsy was performed at month 24. Here we report longitudinal changes between and within each treatment group in the cancellous, endocortical, intracortical, and periosteal bone envelopes in patients with evaluable biopsies at months 6 and 24 (paired data set: TPTD, n = 10; ZOL, n = 9). Between‐group differences are also reported in the larger set of patients with evaluable biopsies at month 6 (TPTD, n = 28; ZOL, n = 30). Data from the cancellous envelope at month 6 or month 24 provided a reference to compare differences across envelopes within each treatment group. The 24‐month results extend our earlier report that TPTD and ZOL possess different tissue‐level mechanisms of action. Moreover, these differences persisted for at least 2 years in all four bone envelopes. Few longitudinal differences were observed within or across bone envelopes in ZOL‐treated patients, suggesting that the low bone formation indices at month 6 persisted to month 24. Conversely, the magnitude of the effect of TPTD on bone formation varied across individual envelopes: median values for mineralizing surface (MS/BS) and bone formation rate (BFR/BS) at month 6 were approximately 3‐fold to 5‐fold higher in the endocortical and intracortical envelopes compared to the cancellous envelope. Although MS/BS and BFR/BS declined in these envelopes at month 24, median values continued to exceed, or were not significantly different from, those in the cancellous envelope. This study demonstrates for the first time that bone formation indices are higher with TPTD treatment than with ZOL in all four bone envelopes and the difference persists for at least 2 years. Moreover, the magnitude of the effect of TPTD in cortical bone remains robust at 24 months. © 2016 The Authors. Journal of Bone and Mineral Research published by Wiley Periodicals, Inc. on behalf of American Society for Bone and Mineral Research (ASBMR).
Introduction
Bone histomorphometry after tetracycline labeling allows quantification of bone structure and cellular activity.(1, 2) However, relatively few studies have evaluated the progressive effects of osteoporosis therapies using histomorphometric analysis.(3, 4, 5, 6, 7, 8, 9, 10) Furthermore, no previous study has directly compared the effects of an anabolic versus an antiresorptive agent on bone remodeling over time.
The Skeletal Histomorphometry in Subjects on Teriparatide or Zoledronic Acid Therapy (SHOTZ) study was a 2‐year trial to assess the biological effects of teriparatide (TPTD), an established anabolic agent, and zoledronic acid (ZOL), a prototypical antiresorptive agent, in ambulatory postmenopausal women with osteoporosis. Previously, we reported biochemical marker data from the primary 12‐month SHOTZ study,(11) showing that TPTD and ZOL have fundamentally different tissue‐level mechanisms of action at 6 months, with opposite effects on bone formation. Histomorphometric analyses showed that cancellous mineralizing surface/bone surface (MS/BS), the primary study endpoint, was substantially higher in the TPTD than the ZOL group (median 5.60% versus 0.16%, p < 0.001) and provided the best discrimination between the two classes of drug.
The current analysis of histomorphometric data through month 24 helps to characterize the longer‐term effects of an anabolic versus an antiresorptive drug. Data from a subset of study participants with paired biopsies at months 6 and 24 allow us to evaluate the effects of each treatment in the same patients at early and later time points. In addition to the standard histomorphometric analysis of the cancellous envelope, we extended the investigation to the endocortical, intracortical, and periosteal envelopes. We used data from the cancellous envelope at month 6 or month 24 as references to compare effects across bone envelopes within each treatment group.
Patients and Methods
Patients
SHOTZ was a phase 4 randomized, double‐blind, active‐comparator controlled, cross‐sectional biopsy study conducted at 12 U.S. and Canadian centers (ClinicalTrials.gov; NCT00927186). The study protocol was approved by the study centers' ethical review boards. All patients provided written consent to release information before enrollment. The rationale, objectives, and design of the SHOTZ study have been described.(11) In brief, the SHOTZ study assessed the biological effects of TPTD and ZOL based on histomorphometric indices and bone turnover markers in ambulatory postmenopausal women with osteoporosis aged 55 to 89 years. The 12‐month, primary study was randomized and double‐blind up to the month 6 biopsy; after month 6, the study was open label for 6 additional months (Supporting Fig. 1). Patients who completed the primary SHOTZ study and had a biopsy at month 6 were eligible to enroll in the 12‐month extension and assigned open label to their original treatment regimen: TPTD 20 μg/day (s.c. injection) or ZOL 5 mg/year (i.v. infusion). A second transiliac crest biopsy from the contralateral side was collected at month 24.
Assessments
Preparation and histomorphometric analysis of bone biopsies were performed as described.(11, 12) For the 24‐month biopsy, patients were tetracycline labeled using the same protocol and the same fluorochrome as for the 6 month biopsy(11); ie, tetracycline labeling began 25 days before biopsy and followed a 3:14:3:5–day schedule. In the 24‐month biopsies, which displayed both sets of labels, labels on the bone surface, with or without overlying osteoid seams, were defined as 24‐month labels, whereas labels buried within bone, either partially or completely, were defined as 6‐month labels. All parameters were defined, measured, calculated, and expressed according to the most recent guidelines from the ASBMR.(1) We measured a standard panel of dynamic and static indices that play a key role in defining the tissue‐level mechanism of action (MOA) of bone‐active drugs in four bone envelopes: cancellous, endocortical, intracortical, and periosteal.(1) Each envelope has distinct remodeling characteristics(6, 8, 9, 11, 13, 14) and potentially different responses to various therapeutic manipulations. The four envelopes were defined as follows.(15) All interior bone surfaces in contact with bone marrow were defined as the endosteal envelope; ie, the cancellous and endocortical envelopes. The endocortical envelope was defined, and distinguished from the cancellous envelope, as the inner boundary of the cortex. In sections in which there were spaces containing bone marrow within the perimeter of, or straddling the projected endosteal surface, such spaces were considered to be bone marrow extensions when the thickness through the trabecula separating the space from the bone marrow cavity was equal to or less than the radius of the space under question; such spaces were excluded from the endocortical envelope. The periosteal bone envelope was defined as the outer boundary of cortex. The intracortical envelope was defined as the Haversian canal surface. Data were collected from the endocortical, intracortical, and periosteal surfaces only when a biopsy specimen presented two completely intact cortices (see Statistical analyses).
This report presents a subset of dynamic and static variables that reasonably reflect modulations in bone remodeling.(1, 16) Dynamic variables included MS/BS, bone formation rate/bone surface (BFR/BS), mineral apposition rate (MAR), and activation frequency (Ac.f). MS/BS was calculated as the length of double labels plus half the length of single labels; if no label was present, MS/BS was assigned a value of zero. MAR was measured on double labels or assigned a value of 0.3 μm/day if only single labels were present; if no label was present, MAR was treated as missing. BFR/BS and Ac.f were calculated using the measured value of MAR on double labels or MAR was assigned a value of 0.3 μm/day if only single labels were present; if no label was present, these indices were assigned a value of zero. Ac.f was not measured in the periosteal or intracortical envelopes.
Static variables of interest were osteoid surface (OS/BS), eroded surface (ES/BS), osteoid thickness (O.Th), and wall thickness (W.Th). We also assessed cortical porosity (Ct.Po) in the intracortical envelope by measuring the sum of the area of enlarged Haversian canals equal to or larger than 50 μm. Endocortical bone marrow extensions were distinguished from Haversian canals as described in the assessments section above where the four bone envelopes are defined. Static indices were not measured in the periosteal envelope and W.Th was not measured in the intracortical envelope.
Statistical analyses
The overall study population (n = 69) included all individuals that signed informed consent and participated in either the primary phase or the extension. The overall study population data set was used for safety analyses. Of the 69 individuals, 58 individuals provided evaluable biopsies at month 6 and of these, 19 individuals provided biopsies at month 24. For continuous endpoints, data were presented using median, with treatment effects compared using a nonparametric test. An ANOVA model was used to investigate differences in changes from month 6 to 24 between the two treatment groups. A ranked ANOVA model was used for skewed data. For categorical measures, summary statistics included sample size, frequency, and percentages and, unless otherwise noted, a Fisher's exact test was used. All tests of treatment effects were conducted at a two‐sided α‐level of 0.05, unless otherwise stated. No adjustments were made for multiplicities. All indices are shown as medians (interquartile range). Values of p for label frequency are from Fisher's exact test for both between‐group and within‐group differences. Values of p for other parameters are from Wilcoxon rank sum tests for between‐group differences for TPTD versus ZOL and for within‐group differences at month 24 versus month 6.
Across‐envelope comparisons
For the across‐envelope comparisons within individual time points, we only included samples in which all envelopes were intact. Therefore in the month 6 across‐envelope comparison, five samples in the TPTD group and one sample in the ZOL group were excluded due to missing cortices. Similarly, for the month 24 across‐envelope comparison, one biopsy sample from each treatment group was excluded. For longitudinal comparisons across envelopes, only those patients who contributed data at both time points were included in the statistical analysis (TPTD, n = 6; ZOL, n = 8). Across‐envelope comparison p values were generated using Wilcoxon rank sum tests.
Results
Baseline demographics and characteristics
Of the 58 patients with evaluable biopsies at month 6 (TPTD = 28; ZOL = 30), 21 entered the 12‐month study extension (TPTD, n = 10; ZOL, n = 11). Ten patients receiving TPTD and nine receiving ZOL had paired evaluable biopsies for months 6 and 24 (Fig. 1). Baseline characteristics (Table 1) were well‐balanced between the treatment groups in the overall study population (n = 69), the month 6 biopsy population (n = 58), and the paired biopsy data set (n = 19).
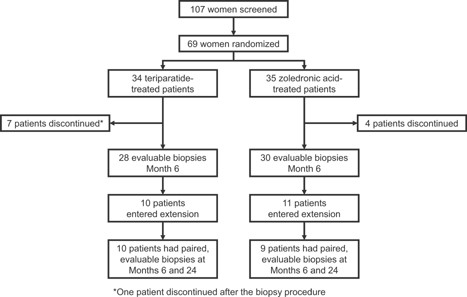
Patient disposition.
Baseline Demographics and Characteristics
| Overall study population | Month 6 biopsy population | Paired biopsy data set | ||||
| Variable | TPTD (n = 34) | ZOL (n = 35) | TPTD (n = 28) | ZOL (n = 30) | TPTD (n = 10) | ZOL (n = 9) |
| Age (years), mean ± SD | 65 ± 7 | 64 ± 6 | 65 ± 7 | 64 ± 6 | 67 ± 8 | 63 ± 6 |
| Race, n (%) | ||||||
| Black or African American | 1 (2.9) | 1 (2.9) | 1 (3.6) | 1 (3.3) | 1 (10.0) | 1 (11.1) |
| White | 33 (97.1) | 34 (97.1) | 27 (96.4) | 29 (96.7) | 9 (90.0) | 8 (88.9) |
| T‐score, mean ± SD | ||||||
| Lumbar spine | −2.79 ± 0.8 | −2.93 ± 0.8 | −2.85 ± 0.8 | −2.94 ± 7.8 | −2.92 ± 0.8 | −2.68 ± 1.1 |
| Femoral neck | −2.25 ± 0.7 | −2.29 ± 0.7 | −2.24 ± 0.6 | −2.24 ± 0.8 | −2.56 ± 0.5 | −2.10 ± 0.5 |
| Total hip | −1.78 ± 0.8 | −1.88 ± 0.9 | −1.71 ± 0.7 | −1.84 ± 1.0 | −1.81 ± 0.6 | −1.73 ± 0.6 |
| Previous fracture, n (% yes) | 14 (41.2) | 17 (48.6) | 10 (35.7) | 15 (50.0) | 5 (50.0) | 6 (66.7) |
| Previous osteoporosis therapy, n (% yes) | 17 (50.0) | 21 (60.0) | 14 (50.0) | 17 (56.7) | 6 (60.0) | 3 (33.3) |
Differences between treatment groups in the paired biopsy data set
Results for histomorphometric parameters in the paired biopsy data set are shown in Fig. 2. MS/BS was significantly higher in the TPTD group in all bone envelopes at both time points except the periosteal envelope at month 6 (Fig. 2A). Results for BFR/BS mirrored those for MS/BS. Ac.f was significantly higher in the TPTD versus the ZOL group in the cancellous and endocortical envelopes at both time points; Ac.f was not measured in the periosteal or intracortical envelopes. There were no differences in MAR between groups, except in the endocortical envelope at month 6 where MAR was significantly higher in the TPTD arm. The differences in labeled cancellous and cortical surfaces between the groups can be visually appreciated in images from representative patients shown in Fig. 3. There were few labels in the ZOL samples at months 6 or 24, consistent with a persistently low median value for MS/BS seen in this group. In contrast, there was ample labeled surface in the TPTD group; labels administered at both months 6 and 24 can be seen, allowing visualization of new bone laid down in the intervening 18 months (Fig. 3A, lower right panel).
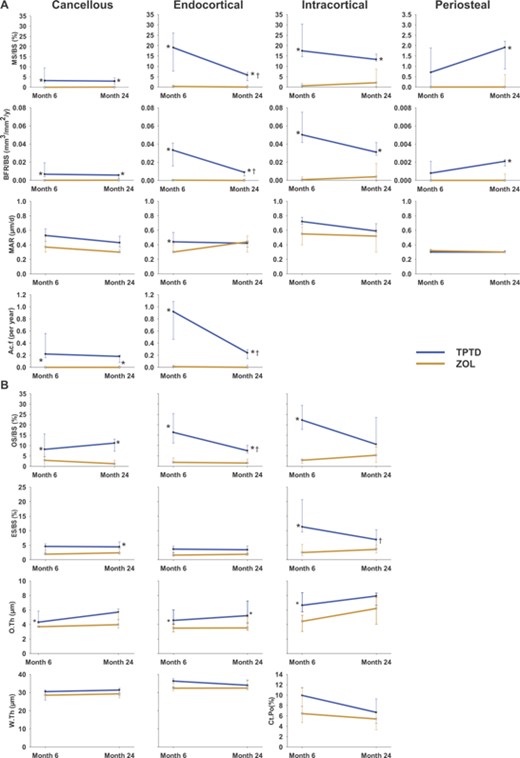
(A) Dynamic and (B) static indices for the paired data set. Due to the considerably lower median values for MS/BS and BFR/BS in the periosteal envelope, the y‐axes for these indices appears as one‐tenth that of the three other envelopes displayed. Cancellous endpoints: n = 10 for TPTD; n = 9 for ZOL. Endocortical, intracortical, and periosteal endpoints: n = 7 for TPTD; n = 9 for ZOL. *p < 0.05 between‐group difference at either month 6 or 24; †p < 0.05 within‐group difference (month 24 versus month 6). MS/BS = mineralizing surface/bone surface; BFR/BS = bone formation rate/bone surface; MAR = mineral apposition rate; Ac.f = activation frequency; OS/BS = osteoid surface/bone surface; ES/BS = eroded surface/bone surface; O.Th = osteoid thickness; W.Th = wall thickness; Ct.Po = cortical porosity.
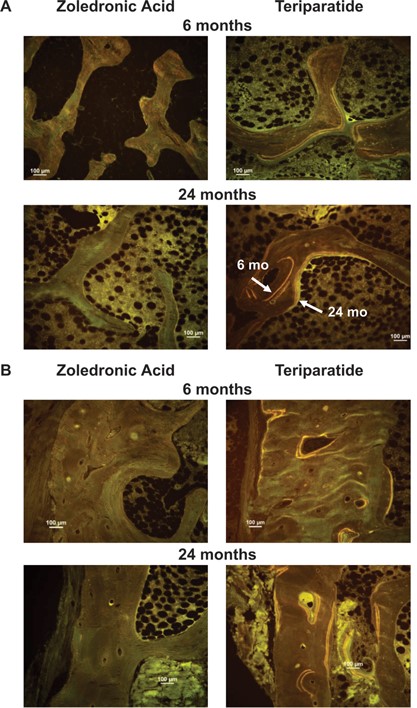
Tetracycline labels in (A) cancellous bone and (B) cortical bone, showing endocortical, intracortical, and periosteal surfaces at 6 and 24 months. Note extensive labeling on all bone surfaces in the TPTD group compared with few labels in the ZOL group. (A) In the lower right image, the labels administered at 6 and 24 months can both be seen, allowing visualization of new bone laid down in the intervening 18 months. (B) In the upper right image, note the smooth cement line underlying the convex packet of new bone on the endocortical envelope. This suggests that this bone was formed by modeling‐based, rather than remodeling‐based, formation. Further, in the lower right image, there is a Haversian system that was in the formation phase of the cycle at 6 months, but which is closed at month 24.
For the static parameters, median values for OS/BS for patients receiving TPTD were significantly higher than for those receiving ZOL (Fig. 2B) in all bone compartments evaluated at both time points, except for the intracortical envelope at month 24. ES/BS was significantly higher for TPTD than ZOL in the intracortical envelope at month 6 and in the cancellous envelope at month 24. O.Th was significantly higher in patients treated with TPTD than ZOL at months 6 and 24 in the endocortical envelope and at month 6 in the cancellous and intracortical envelopes.
Envelope‐specific changes over time within each treatment group in the paired biopsy data set
In the ZOL group, there were no significant changes over time for any of the dynamic or static indices (Fig. 2). In the TPTD group, there was no significant change in the median values for MS/BS and BFR/BS at month 24 versus month 6 in the cancellous, intracortical, and periosteal envelopes, although these indices did decline significantly in the endocortical envelope (Fig. 2A). Similarly, the median values for Ac.f decreased from month 6 to month 24 in the endocortical, but not in the cancellous envelope. There was no significant change in MAR over time. Further, there were no significant temporal changes in any of the static indices (Fig. 2B) with the exception of OS/BS, which declined in the endocortical envelope and ES/BS, which similarly declined in the intracortical envelope.
Comparison of histomorphometric indices at month 6 between groups
This analysis included 58 evaluable biopsies collected at month 6 and provided greater power to make statistical comparisons (Table 2). In this data set, all histomorphometric indices were significantly greater in the TPTD group than the ZOL group in each envelope in which they were measured with the exception of MAR in the periosteal envelope. As distinct from the paired analysis data set (Fig. 2B), cortical porosity in the month 6 data set was significantly higher in the TPTD group than in the ZOL group.
Histomorphometric Indices at Month 6 (n = 58)
| Cancellous | Endocortical | Intracortical | Periosteal | |||||
| TPTD | ZOL | TPTD | ZOL | TPTD | ZOL | TPTD | ZOL | |
| MS/BS (%)2 | 5.60§ | 0.16 | 18.64§ | 0.30 | 22.92§ | 0.84 | 0.71§ | 0.00 |
| (3.00, 11.75) | (0.00, 0.58) | (9.25, 21.96) | (0.00, 0.84) | (12.09, 32.88) | (0.00, 1.84) | (0.00, 1.89) | (0.00, 0.00) | |
| n = 28 | n = 30 | n = 23 | n = 29 | n = 23 | n = 29 | n = 23 | n = 29 | |
| BFR/BS (mm3/mm2/year) | 0.0116§ | 0.0002 | 0.0307§ | 0.0003 | 0.0626§ | 0.0009 | 0.0008§ | 0.0000 |
| (0.0051, 0.0265) | (0.0000, 0.0010) | (0.0182, 0.0411) | (0.0000, 0.0014) | (0.0351, 0.0893) | (0.0000, 0.0043) | (0.0000, 0.0021) | (0.0000, 0.0000) | |
| n = 28 | n = 30 | n = 23 | n = 29 | n = 23 | n = 29 | n = 23 | n = 29 | |
| MAR (μm/day)3 | 0.56* | 0.49 | 0.50‡ | 0.30 | 0.75§ | 0.46 | 0.30 | 0.30 |
| (0.48, 0.62) | (0.37, 0.51) | (0.43, 0.56) | (0.30, 0.44) | (0.69, 0.80) | (0.32, 0.66) | (0.30, 0.50) | (0.30, 0.30) | |
| n = 28 | n = 18 | n = 23 | n = 15 | n = 23 | n = 21 | n = 16 | n = 5 | |
| Ac.f (per year) | 0.37§ | 0.01 | 0.83§ | 0.01 | – | – | – | – |
| (0.17, 0.82) | (0.00, 0.03) | (0.49, 1.09) | (0.00, 0.04) | |||||
| n = 28 | n = 30 | n = 23 | n = 29 | |||||
| OS/BS (%) | 11.34§ | 2.51 | 16.33§ | 1.87 | 22.28§ | 3.05 | – | – |
| (6.58, 16.52) | (1.27, 4.58) | (13.57, 24.34) | (1.08, 3.99) | (17.09, 29.34) | (2.05, 4.05) | |||
| n = 28 | n = 30 | n = 23 | n = 29 | n = 23 | n = 29 | |||
| ES/BS (%) | 4.59§ | 2.71 | 4.06* | 1.87 | 12.28§ | 4.23 | – | – |
| (3.14, 6.01) | (1.73, 3.21) | (1.92, 6.32) | (1.54, 3.33) | (9.72, 17.12) | (2.72, 5.82) | |||
| n = 28 | n = 30 | n = 23 | n = 29 | n = 23 | n = 29 | |||
| O.Th (μm) | 4.92§ | 3.77 | 4.94§ | 3.70 | 6.91§ | 4.44 | – | – |
| (4.29, 6.68) | (3.51, 4.22) | (4.41, 5.87) | (2.99, 4.82) | (6.26, 8.38) | (3.19, 5.28) | |||
| n = 28 | n = 30 | n = 23 | n = 29 | n = 23 | n = 29 | |||
| W.Th (μm) | 31.29* | 28.63 | 36.30* | 32.39 | – | – | – | – |
| (28.80, 33.26) | (27.16, 30.43) | (34.27, 37.62) | (29.45, 36.20) | |||||
| n = 28 | n = 30 | n = 23 | n = 29 | |||||
| Ct.Po (%) | – | – | – | – | 9.62† | 5.64 | – | – |
| (7.82, 11.68) | (4.14, 8.58) | |||||||
| n = 23 | n = 29 | |||||||
All indices are shown as medians (interquartile range); n = number of patients with valid measurements at 6 months. The number of samples for some indices varies due to absent label or missing cortices (see Patients and Methods). Ac.f and W.Th were not measured in the intracortical or periosteal envelopes. OS/BS, ES/BS, O.Th, W.Th, and Ct.Po were not measured in the periosteal envelope. Ct. Po was not measured in the cancellous, endocortical, or periosteal envelopes. Values of p for histomorphometric parameters are from Wilcoxon rank sum tests for between‐group differences for TPTD versus ZOL. Symbols indicate significant differences between treatment groups: *p < 0.05, †p < 0.01, ‡p = 0.001, §p < 0.001.
MS/BS (mineralizing surface/bone surface) was calculated as the length of double labels plus half the length of single labels; if no label was present, MS/BS was measured as a value of zero.
MAR (mineral apposition rate) was measured on double labels or assigned a value of 0.3 μm/day if only single labels were present; if no label was present, MAR was treated as missing.
Comparison of dynamic indices at month 6 across bone envelopes
Figure 4 allows comparison of the dynamic indices in the three other envelopes to the cancellous envelope for both groups at month 6 (n = 52). In the TPTD arm, the median values for MS/BS and BFR/BS in the endocortical and intracortical envelopes were significantly higher than in the cancellous envelope by approximately 3‐fold to 5‐fold (all p ≤ 0.02). In the ZOL group, the median values for MS/BS and BFR/BS were significantly higher in the intracortical envelope than the cancellous envelope (both p ≤ 0.02), whereas there were no differences between the endocortical and cancellous envelope. In both groups, MS/BS and BFR/BS were significantly lower in the periosteal envelope than in the cancellous envelope.
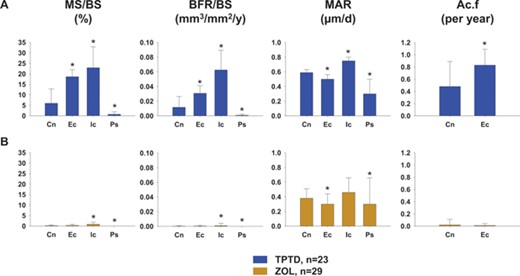
Dynamic indices in the four bone envelopes at 6 months (n = 52). (A) TPTD; (B) ZOL. *p < 0.05 for other bone envelopes versus cancellous envelope within each figure. Cn = cancellous; Ec = endocortical; Ic = intracortical; Ps = periosteal.
Comparison of dynamic indices across bone envelopes in the paired biopsy data set at months 6 or 24
Table 3 presents a comparison of the dynamic indices in the 3 other envelopes to the cancellous envelope within each individual time point in the paired biopsy data set. In the TPTD group, the comparison of individual dynamic indices across envelopes at month 6 was similar to the results reported for the larger 6 month data set (n = 52); eg, the median values for MS/BS and BFR/BS at month 6 in the intracortical envelope were significantly higher than in the cancellous envelope by approximately 3‐fold (all p = 0.007). At month 24, similar findings were seen when comparing the dynamic indices in the other three envelopes to the cancellous envelope. For patients receiving ZOL, there were few differences between the median values for any of the indices measured in the other three envelopes compared with the cancellous envelope at month 6 or 24 (Table 3), with the exception of the intracortical envelope at month 24, where the median values for MS/BS and BFR/BS were significantly higher than the values in the cancellous envelope (both p ≤ 0.01).
Across‐Envelope Comparisons of Dynamic Histomorphometric Indices at Months 6 or 24 for Teriparatide and Zoledronic Acid in the Paired Biopsy Set
| Month 6 | Month 24 | |||||||
| Indices | Cancellous | Endocortical | Intracortical | Periosteal | Cancellous | Endocortical | Intracortical | Periosteal |
| Teriparatide | ||||||||
| MS/BS (%) | 4.44 | 19.06 | 17.49† | 0.71* | 3.06 | 5.82 | 13.34‡ | 1.91 |
| (2.18, 10.75) | (7.67, 26.05) | (14.67, 30.36) | (0.00, 1.89) | (1.49, 4.58) | (3.10, 7.08) | (12.55, 15.87) | (0.87, 2.21) | |
| n = 7 | n = 7 | n = 7 | n = 7 | n = 9 | n = 9 | n = 9 | n = 9 | |
| BFR/BS (mm3/mm2/year) | 0.0110 | 0.0334 | 0.0502† | 0.0008* | 0.0057 | 0.0090 | 0.0310‡ | 0.0021 |
| (0.0040, 0.0231) | (0.0159, 0.0411) | (0.0417, 0.0750) | (0.0000, 0.0021) | (0.0022, 0.0061) | (0.0049, 0.0100) | (0.0276, 0.0416) | (0.0016, 0.0023) | |
| n = 7 | n = 7 | n = 7 | n = 7 | n = 9 | n = 9 | n = 9 | n = 9 | |
| Ac.f (per year) | 0.35 | 0.92 | — | — | 0.19 | 0.24 | — | — |
| (0.16, 0.74) | (0.46, 1.09) | (0.08, 0.20) | (0.14, 0.29) | |||||
| n = 7 | n = 7 | n = 9 | n = 9 | |||||
| MAR (μm/day) | 0.59 | 0.44 | 0.72* | 0.30 | 0.41 | 0.42 | 0.59‡ | 0.30* |
| (0.50, 0.63) | (0.42, 0.57) | (0.68, 0.78) | (0.30, 0.30) | (0.37, 0.51) | (0.37, 0.45) | (0.57, 0.69) | (0.30, 0.32) | |
| n = 7 | n = 7 | n = 7 | n = 5 | n = 9 | n = 9 | n = 9 | n = 8 | |
| Zoledronic acid | ||||||||
| MS/BS (%) | 0.00 | 0.32 | 0.58 | 0.00 | 0.04 | 0.00 | 2.09* | 0.00 |
| (0.00, 0.15) | (0.00, 0.80) | (0.00, 1.84) | (0.00, 0.00) | (0.00, 0.30) | (0.00, 0.91) | (0.31, 8.60) | (0.00, 0.06) | |
| n = 9 | n = 9 | n = 9 | n = 9 | n = 8 | n = 8 | n = 8 | n = 8 | |
| BFR/BS (mm3/mm2/year) | 0.0000 | 0.0003 | 0.0007 | 0.0000 | 0.0000 | 0.0000 | 0.0039* | 0.0000 |
| (0.0000, 0.0002) | (0.0000, 0.0009) | (0.0000, 0.0037) | (0.0000, 0.0000) | (0.0000, 0.0004) | (0.0000, 0.0016) | (0.0003, 0.0186) | (0.0000, 0.0007) | |
| n = 9 | n = 9 | n = 9 | n = 9 | n = 8 | n = 8 | n = 8 | n = 8 | |
| Ac.f (per year) | 0.00 | 0.01 | — | — | 0.00 | 0.00 | — | — |
| (0.00, 0.01) | (0.00, 0.03) | (0.00, 0.01) | (0.00, 0.04) | |||||
| n = 9 | n = 9 | n = 8 | n = 8 | |||||
| MAR (μm/day) | 0.37 | 0.30 | 0.55 | 0.32 | 0.30 | 0.44 | 0.52 | 0.30 |
| (0.30, 0.51) | (0.30, 0.40) | (0.40, 0.65) | (0.30, 0.34) | (0.30, 0.32) | (0.30, 0.52) | (0.30, 0.61) | (0.30, 0.30) | |
| n = 3 | n = 5 | n = 5 | n = 2 | n = 4 | n = 3 | n = 7 | n = 2 | |
Values are shown as median (interquartile range). Note: The median values for MS/BS and BFR/BS at 24 months either continued to exceed (intracortical envelope; p < 0.05) or were similar to (endocortical envelope; NS, p ≥ 0.7) the values observed in the cancellous envelope at month 6 (TPTD, n = 6 at both time points; ZOL, n = 8 at both time points). Values of p are from the Wilcoxon rank sum test. Symbols indicate significant differences between the other 3 envelopes and the cancellous envelope at month 6 or month 24: *p < 0.05,†p ≤ 0.01, ‡p ≤ 0.001.
TPTD = teriparatide; ZOL = zoledronic acid. Values are shown as median (interquartile range); values in the cancellous envelope are in bold type as they served as a reference to compare the activity in the other 3 bone envelopes at either 6 or 24 months.
Safety
During the overall study, treatment‐emergent adverse events were experienced by 91.3% of patients (94.1% receiving TPTD and 88.6% receiving ZOL). As previously described,(11) seven patients discontinued during the 12‐month primary study because of adverse events (5 receiving TPTD and 2 receiving ZOL). No patient discontinued because of an adverse event during the 12‐month study extension. There were five serious adverse events in the overall study population: two in the TPTD group (noncardiac chest pain and preexisting benign mixed tumor of the parotid gland) and three in the ZOL group (preexisting liver hemangioma that worsened, ophthalmic aneurysm, and asthmatic bronchitis). No serious adverse event was considered by the investigators to be related to study drug, and no patient withdrew from the study because of a serious adverse event. There were no deaths in this study.
Discussion
This analysis of histomorphometric data through month 24 of the SHOTZ trial extends our earlier report(11, 17) that TPTD and ZOL possess fundamentally different tissue‐level MOAs. In addition, we now show that these differences persist for at least 2 years and are observed in all four bone envelopes. As in the primary SHOTZ study, the dynamic indices, particularly MS/BS and BFR/BS, provided the best discrimination between the two classes of drug at both early and later time points.
In the paired biopsy dataset, BFR/BS was higher with TPTD than with ZOL in all four bone envelopes at both time points with the exception of the periosteum at month 6. Note that BFR/BS was significantly higher with TPTD than with ZOL in the periosteal envelope at month 24. Furthermore, the persistently higher BFR/BS on the endocortical envelope with TPTD provides a mechanistic basis for the reported increase in cortical thickness with this agent.(6, 8, 9) Enhanced bone formation on the endocortical envelope also helps to offset any potential negative effects from an early increase in Ct.Po seen with TPTD in the 6 month (n = 58) dataset.(18) This study also shows that higher Ct.Po with TPTD compared with ZOL may be attributed to the higher intracortical remodeling rate with TPTD. This is important because the transient increase in Ct.Po due to the increase in Ac.f with TPTD will decrease as the Haversian remodeling rate declines with time on treatment and closure of the remodeling space ensues. This higher intracortical remodeling rate with TPTD may also be expected to confer long‐term skeletal health benefits because older bone is replaced by new bone, a process that is visually apparent in the lower right panel of Fig. 3B where a cortical osteon that was in the bone formation phase of the remodeling cycle at month 6 has been completely filled in by month 24. In the context of untreated osteoporosis, high bone turnover is damaging to cortical bone and may predispose to loss of cortical bone strength. In the context of osteoanabolic therapy with activation of new cortical bone formation, this transient increase in porosity may ultimately confer increased bone strength and long‐term nonvertebral fracture prevention.
In this study, we also explored longitudinal changes within treatment groups in each bone envelope. In the paired dataset, dynamic indices (MS/BS, BFR/BS, and Ac.f) declined from month 6 to 24 within the endocortical envelope in the TPTD group (Fig. 2A). However, these indices did not decline in the other three envelopes. Furthermore, the across‐envelope analysis (Table 3) revealed an important distinction; the magnitude of the bone formation indices varied considerably among the different envelopes.
Note the approximately 3‐fold to 5‐fold higher median values at month 6 for MS/BS and BFR/BS in the endocortical and intracortical envelopes compared with the cancellous envelope (Fig. 4). When evaluating the subsequent decline of these indices at month 24 (Fig. 2A), it is important to note that the median values for MS/BS and BFR/BS in the endocortical and intracortical envelopes either continued to exceed or were similar to the values observed in the cancellous envelope at month 24 or, indeed, at month 6 (Table 3). These findings suggest that treatment with TPTD affects bone formation across all four bone envelopes with the greatest and most durable effects occurring in the endocortical and intracortical envelopes.
Measurement of serum procollagen type I N‐terminal propeptide (P1NP) is often used as a surrogate marker to assess the global effects of bone‐active drugs on bone formation. The SHOTZ study evaluated P1NP in patients on either TPTD or ZOL for the first 12 months of study. The results of the SHOTZ trial and many others(3, 19, 20, 21, 22) show that treatment with TPTD stimulates a rapid increase in P1NP that peaks between 6 and 12 months and thereafter plateaus at a level that remains significantly above baseline throughout the duration of treatment, which has been studied for up to 36 months.(3, 11, 20, 21, 22, 23) This plateau has often been interpreted as a signal that bone formation is waning. This misconception has been supported by histomorphometry data, which generally have been obtained later in the course of treatment and only in the cancellous envelope. However, data from the current study provide an opportunity to interpret the changes observed in P1NP based on tissue‐level activity observed within individual bone envelopes during treatment with TPTD. Over time, bone formation may decline in some envelopes; however, the magnitude of the bone formation rate in the endocortical and intracortical envelopes at later time points continues to equal or exceed the magnitude of the bone formation rate in the cancellous envelope at an early time point. This may create equilibrium in bone formation across envelopes, which is reflected in serum P1NP as a plateau at later time points.
Importantly, this study demonstrates that at the tissue level, the so‐called anabolic window(24) remains open for at least 2 years. Furthermore, increases in BMD reported from pivotal clinical trials with TPTD are consistent with our data; lumbar spine BMD continues to increase between 6 and 24 months in postmenopausal women with osteoporosis (data on file)(25, 26) and between 6 and 36 months in patients with glucocorticoid‐induced osteoporosis.(23)
In marked contrast to the TPTD group, no compelling differences in bone histomorphometric indices were seen within individual bone envelopes in the ZOL group over time (Fig. 2); in fact, the data suggest that the low bone formation rate seen at month 6 persisted through 24 months. The across‐envelope analysis yielded similar results, except in the intracortical envelope (Table 3). Here, the median values for MS/BS and BFR/BS, were significantly higher at month 24 in the intracortical envelope compared with the cancellous envelope. These findings suggest that the intracortical envelope may be less sensitive to ZOL or that the effect of ZOL in this envelope is waning, considering that the last dose was administered 12 months prior to the 24‐month biopsy. These data are consistent with other data suggesting that bisphosphonates may have limited access to the intracortical envelope, unlike TPTD and denosumab, which are not bound to the bone matrix.(27)
This study has two important strengths. First, we analyzed histomorphometric indices in four bone envelopes and, second, we analyzed patients with paired biopsies at both months 6 and 24. The comprehensive analysis across all four bone envelopes broadens our understanding of the effects of TPTD and ZOL in different envelopes over time and provides greater context to the totality of response previously interpreted primarily by bone histomorphometry limited to cancellous bone or by biochemical bone markers.
Our study also had some limitations. There was no placebo group, and the cross‐sectional design did not allow us to assess histomorphometric changes compared with baseline. Biochemical markers were only measured in the primary 12‐month study. Further, intact paired biopsies were only available in a subset of the participants.
Both TPTD and ZOL are effective agents for the treatment of osteoporosis.(25, 28) Both drugs lower the risk of vertebral and nonvertebral fracture and both increase BMD. However, the tissue‐level mechanisms underlying the increase in BMD seen with each drug are fundamentally different. This study demonstrates for the first time that bone formation indices are higher with TPTD treatment than with ZOL in all four bone envelopes and that this marked difference persists for at least 2 years. Moreover, the magnitude of the effect of TPTD in cortical bone remains robust at 24 months.
Disclosures
DWD has received research grants from Eli Lilly; is a consultant and on advisory boards for Eli Lilly, Amgen, and Merck; is on the speakers' bureau at Eli Lilly and Amgen; and has received honoraria from Eli Lilly, Amgen, Novartis, and Merck. JPB is a consultant and on advisory boards for Amgen and Eli Lilly; has received research grants from Amgen, Eli Lilly, Novartis, and Merck; and has served on the speakers' bureau for Amgen and Eli Lilly. CPR has served as a consultant for Eli Lilly and Novartis. DLK is a consultant for Pfizer, Eli Lilly, and Merck; has received grants from Eli Lilly, Astellas, and AstraZeneca; and has received honoraria from Amgen. EML has received research grants from Amgen, Eli Lilly, and Merck; and is a consultant for Amgen, Eli Lilly, Merck, Radius Health, AgNovos Healthcare, Theranova, Alexion, NPS, and AbbVie. DAH has received grants from Eli Lilly; and serves on the speakers' bureau for Eli Lilly and Novartis. SDR is on the speakers' bureau for Eli Lilly. PDM has received research grants from Alexion, Amgen, Boehringer Ingelheim, Immunodiagnostics, Eli Lilly, Merck, Merck Serrano, NBHA, Novartis, Novo Nordisk, Radius Pharma, Roche Diagnostics, and Takeda; has served on advisory boards for Alexion, Amgen, AgNovos, Eli Lilly, Merck, Radius Pharma, and Roche; and is on the speakers' bureau for Alexion Pharmaceutical, Amgen, and Radius Health. RL has received research grants from, has been a consultant for, and has served on the advisory council for Eli Lilly; has been a speaker for Amgen and Novartis; and has received honoraria from Eli Lilly and Amgen. NB has received research support from Amgen, Eli Lilly, Merck, Opko Ireland, and GE Heathcare Lunar; and is a consultant for Eli Lilly, Merck, and Amgen. ERG was an employee of inVentiv Health Company, whose work is funded by Eli Lilly. JA, VAR, and KAT are employees of Eli Lilly or one of its subsidiaries and own stock in the company.
Acknowledgments
This study was sponsored by Eli Lilly and Company, Indianapolis, IN, USA. We are grateful for statistical support from Abby Wu of Eli Lilly and Co. and Fangqiu Zhang, who was an employee of inVentiv Health Clinical during manuscript preparation.
Authors' roles: Study design: DWD, RL, and KAT. Study conduct: DWD, HZ, RRR, JPB, CPR, DLK, EML, DAH, DSR, PDM, GCW, VAR, and KAT. Data collection: DWD, HZ, RRR, JPB, CPR, DLK, EML, DAH, DSR, and VAR. Data analysis: DWD, JA, and KAT. Data interpretation: DWD, HZ, RRR, MAB, CPR, DLK, EML, DSR, PDM, RL, JA, VAR, ERG, and KAT. Drafting the manuscript: DWD, ERG, and KAT. Revising manuscript content: DWD, HZ, RRR, JPB, MAB, CPR, DLK, EML, DAH, DSR, PDM, RL, JA, VAR, ERG, and KAT. Approving final version of the manuscript: DWD, HZ, RRR, JPB, MAB, CPR, DLK, EML, DAH, DSR, PDM, GCW, RL, NB, JA, VAR, ERG, and KAT. Takes responsibility for integrity of data analysis: JA.
References
Author notes
Public clinical trial registration: http://clinicaltrials.gov/show/NCT00927186. Skeletal Histomorphometry in Patients on Teriparatide or Zoledronic Acid Therapy.
