


Abstract
In forensic toxicology, high-performance liquid chromatography tandem mass spectrometry (LC–MS-MS) is increasingly used for the fast and sensitive measurement of a wide range of drugs. For our routine casework, a LC atmospheric pressure chemical ionization MS-MS method for the quantification of Δ9-tetrahydrocannabinol (Δ9-THC), cannabinol (CBN) and cannabidiol (CBD) in hair was established and fully validated. Separation was achieved using a Kinetex® C18 column (100 mm × 2.1 mm, 100 Å, 1.7 μm, Phenomenex) at a flow rate of 0.5 mL/min. Measurements were performed on a QTRAP 5500 mass spectrometer (Sciex, Darmstadt, Germany). Unexpected signals were observed in authentic THC-positive hair samples. First, a signal with a slightly shifted retention time of THC whose origin could be assigned to the isomer Δ8-THC was detected. Second, additional peaks exhibiting the same fragments as CBN and Δ9-THC but eluting at different retention times were detected. Spiking experiments and enhanced product ion scans pointed to the origin of these additional signals as result of in-source decarboxylation of Δ9-tetrahydrocannabinolic acid A (Δ9-THCA-A) into Δ9-THC and further partial oxidation of Δ9-THC into CBN, respectively. Positive findings of Δ9-THCA-A in hair have been shown to derive from external contamination; therefore, the herein described artifacts may be used as indirect markers for external contamination.
Introduction
Cannabis products are among the most widely abused psychoactive drugs in the world (1). Considerations and efforts to legalize cannabis have been started in many countries. By 2020, 11 states in the USA, Uruguay and Canada have legalized the recreational use of cannabis (2–4). In Switzerland, the use of cannabidiol (CBD)-rich cannabis products with a Δ9-tetrahydrocannabinol (Δ9-THC) content <1.0% has been legalized in 2019 (5). Cannabis use can be detected by measuring Δ9-THC, the main psychoactive compound of cannabis, and its metabolites 11-hydroxy-Δ9-tetrahydrocannabinol (11-OH-Δ9-THC) and 11-nor-Δ9-tetrahydrocannabinol-9-carboxylic acid (Δ9-THC-COOH) in blood and urine (e.g., 6–9). The extent of cannabis use can be estimated by determining free and glucuronidated Δ9-THC-COOH and especially Δ9-THC and 11-OH-Δ9-THC glucuronides in urine (10). Δ9-THC-COOH levels in blood can be used to differentiate between occasional and regular cannabis use because of the long plasma half-life of Δ9-THC-COOH and its accumulation after frequent cannabis use (11, 12). Serial urine monitoring of Δ9-THC-COOH-to-creatinine ratios is recommended to differentiate between recent drug use and residual Δ9-THC-COOH excretion caused by regular cannabis use (13, 14).
In contrast, hair testing gives a cumulative image of long-term drug exposure ranging from weeks to months. Due to the wide detection window, this approach is often used to test for, e.g., drug abstinence. Hair has been proposed as an additional matrix for the detection of cannabis use (15, 16). However, it is not the method of choice to monitor cannabis use or abstinence from cannabis for several reasons. Δ9-THC and especially its acidic metabolites are poorly bound to melanin, yielding low incorporation rates into the hair matrix (17). Hence, in cases of occasional cannabis use, hair analysis often lacks sensitivity, leading to false-negative results as shown in a retrospective study involving individuals with documented cannabis use (18, 19). Furthermore, external contamination of hair via hands of cannabis users, sebum/sweat or cannabis smoke has to be taken into account (20–23). The detection of Δ9-THC-COOH indicates actual cannabis use (24), but the compound is even less favorably incorporated into hair compared to Δ9-THC (18, 25, 26). Moreover, Δ9-THC-COOH was shown to be present in hair segments that have already grown before Δ9-THC intake due to sweat-assisted diffusion into distal segments (22).
Furthermore, Δ9-tetrahydrocannabinolic acid A (Δ9-THCA-A) has been proposed as marker for external contamination (17, 27). About 90% of the total Δ9-THC is available in its prodrug form Δ9-THCA-A in fresh plant material (28). When heated or smoked, Δ9-THCA-A becomes partially decarboxylated (29, 30). Δ9-THCA-A is detectable in blood and urine samples of cannabis users (31) and in Δ9-THC-positive hair samples (17). Δ9-THCA-A is not incorporated into hair through the bloodstream after oral intake (17, 22) and only in negligible amounts by contamination through side stream smoke (32). In fact, the major part of Δ9-THCA-A found in authentic hair samples derives from external contamination caused by direct transfer through contaminated fingers (21, 23).
Despite these limitations, hair testing can be a valuable tool to confirm contact (intake or handling) with cannabis products. Therefore, the aim of the present study was to establish a simple and robust LC–MS-MS method for the detection of Δ9-THC, CBN and CBD in hair samples, which can be applied in our routine casework. During method development, artifacts were detected in THC-positive hair samples. Here, we present the elucidation of the origin of these artifacts and discuss their potential to reveal additional information.
Experimental Part
Chemicals and reagents
Ethanolic or methanolic solutions (1 mg/mL) of the standards (--)-trans-delta9-tetrahydrocannabinol (Δ9-THC), (--)-trans-delta8-tetrahydrocannabinol (Δ8-THC), cannabinol (CBN), cannabidiol (CBD), tetrahydrocannabinolic acid A (Δ9-THCA-A), (--)-Δ9-tetrahydrocannabinol-d3 (Δ9-THC-d3) and cannabinol-d3 (CBD-d3) were purchased from Lipomed (Arlesheim, Switzerland). Water for decontamination of hair samples was processed by a PURELAB Option-Q system by ELGA LabWater (Labtec Services AG, Villmergen, Switzerland). Acetone (pro analysis ≥ 99.5%), acetonitrile (LC–MS grade), formic acid (p.a., ≥ 98%), ammonium formate (≥ 99%), hexane (p.a., ≥ 99%), methanol (LC–MS grade or p.a., ≥ 99.8%) and water (LC–MS grade or p.a., ≥ 99.8%) were purchased from Sigma-Aldrich (St Louis, MO, USA).
Hair samples
Drug-free head hair was collected from drug-abstinent donors at our laboratory. After testing negative for THC, these samples were pooled for use as calibrators and blank hair samples. THC-positive hair samples were obtained from 10 different donors from our routine casework (n = 10). Seven samples were head hair and the remaining three samples were body hair. The proximal 4–5 cm of head hair and the entire length of the body hair (range: 1.0–2.5 cm) were investigated. Furthermore, pooled THC-positive hair samples were prepared (Pools 1, 2 and 3). The study was performed in full conformance with Swiss laws (statement of Cantonal Ethics Board of the Canton of Zurich: BASEC-Nr. Req-2017-00946).
Sample preparation
Each hair sample was successively washed with 15 mL of water, 10 mL of acetone and 10 mL of hexane. Each washing step was carried out for 2 min under shaking. Samples were air dried at room temperature for about 2 h and chopped into snippets with scissors. Approximately 20 mg of the snippets were weighed into Eppendorf tubes and 1.4 mL of methanol and 0.1 mL of internal standard (IS) solution (containing 60 ng of Δ9-THC-d3 and CBD-d3, respectively) were added. The Eppendorf tubes were placed into a Retsch ball mill (Type MM 400, Retsch GmbH & Co. KG, Haan, Germany) and shaken in the presence of one tungsten carbide ball at 10 Hz for 90 min. After the centrifugation at 9,000 rpm for 25 min, 75 µL of the supernatant were transferred into an LC vial with a silanized glass inlet (Thermo Scientific, Waltham, MA) and 75 µL of a solution of 2 mM aqueous ammonium formate were added and vortexed.
LC–MS-MS conditions
Method 1 (detection of Δ9-THC, CBN and CBD)
Ten microliters of each sample were injected into an LC–MS-MS system consisting of a Shimadzu Prominence high-performance liquid chromatography (HPLC) system (Shimadzu, Duisburg, Germany) and a QTRAP 5500 mass spectrometer (Sciex, Darmstadt, Germany). Separation was achieved using a Kinetex® C18 column (100 mm × 2.1 mm, 100 Å, 1.7 μm, Phenomenex) operated at a flow rate of 0.5 mL/min with a total run time of 15 min. A linear gradient consisting of a mobile phase A (water containing ammonium formate [1 mM] and formic acid [0.1%]) and mobile phase B (acetonitrile containing ammonium formate [1 mM] and formic acid [1 mM]) was used. The gradient was programmed as follows: 0.01–1.5 min, 40% Eluent B; 1.5–1.6 min increasing to 60% Eluent B; 1.6–10 min increasing to 65% Eluent B; 10–11 min, 95% Eluent B; 11–12 min hold at 95% Eluent B; 12–12.01 min decreasing to 40% Eluent B, 12.01–15 min starting conditions (40% Eluent B). The column oven was set at 40°C. The MS instrument was operated using atmospheric pressure chemical ionization (APCI) in positive mode. Source parameters were 450°C source temperature and 5,500 V capillary voltage. The main parameter settings were as follows: Gas 1, 50; Gas 2, 60; curtain gas, 30 and nebulizer current was set to 3.0. The samples were acquired in the ‘scheduled Multiple Reaction Monitoring’ (sMRM) mode using a target scan time of 2.0 s and an MRM detection window of 90 s. Identification and quantification were achieved using one quantifier and one qualifier. MS parameters and retention times are given in Table I.
For characterization, enhanced product ion (EPI) scans were performed using the same LC conditions and ion source parameters as described above. Information-dependent acquisition (IDA) was used to automatically trigger EPI scans by analyzing MRM signals. The EPI scans were performed for product ions at a scan rate of 10,000 Da/s, with dynamic fill in the linear ion trap and a step size of 0.12 Da. The collision energy (CE) of EPI was set at 35 eV with a CE spread of 15 eV. The collisionally activated dissociation (CAD) was set to high. The IDA criteria included selecting 1–2 of the most intense peaks(s) of the survey scan, for ions that exceeded 1,000 counts per second.
MS Parameters
| Method | Analyte | IS | Retention time (min) | Precursor ion (m/z) | Product ion (m/z) | DP (V) | CE (V) | CXP (V) |
|---|---|---|---|---|---|---|---|---|
| 1 | CBD | CBD-d3 | 5.3 | 315 | 193 | 111 | 29 | 10 |
| 315 | 259 | 111 | 23 | 8 | ||||
| CBN | Δ9-THC-d3 | 6.9 | 311 | 223 | 101 | 27 | 14 | |
| 311 | 178 | 101 | 81 | 14 | ||||
| Δ9-THC | Δ9-THC-d3 | 8.0 | 315 | 193 | 31 | 31 | 10 | |
| 315 | 259 | 21 | 25 | 22 | ||||
| CBD-d3 | − | 5.3 | 318 | 135 | 111 | 27 | 4 | |
| Δ9-THC-d3 | − | 7.9 | 318 | 196 | 31 | 31 | 10 | |
| 2 | Δ9-THCA-A | − | 9.8 | 357 | 313 | −85 | −38 | −19 |
| − | 9.8 | 357 | 245 | −85 | −42 | −11 | ||
| − | 9.8 | 357 | 191 | −85 | −38 | −15 |
Quantifier marked in bold.
Method 2 (detection of Δ9-THCA-A)
For the measurement of Δ9-THCA-A, the LC conditions were applied as described above. The MS instrument was operated in APCI in negative mode. The capillary voltage was set to −4,500 V. Further source parameters were applied as described above. The samples were acquired in the continuous MRM mode using a dwell time of 150 ms and the detection window of 35 s. Identification was achieved using three transitions (Table I).
Method validation (Method 1)
Validation experiments were performed according to the guidelines of Gesellschaft für Toxikologische und Forensische Chemie (GTFCh) (33). The following performance characteristics were evaluated: selectivity, linearity, limit of detection (LOD), limit of quantification (LOQ), precision, accuracy, matrix effects and recovery. For the validation experiments, approximately 20 mg of hair was used. Quality control (QC) samples were prepared by spiking standard solutions into blank hair samples.
Selectivity, linearity, LOD and LOQ
For selectivity, six different blank hair samples of non-users without IS and two blank samples (with IS) were analyzed. Nine calibration levels (20–5,000 pg/mg) were used for Δ9-THC, CBN and CBD. Calibration curves were fitted by least-squares regression procedure. LOD and LOQ were determined by analyzing spiked hair samples in the low concentration range and calculating a theoretical signal-to-noise ratio of 3:1 for LOD and 10:1 for LOQ.
Accuracy, precision, matrix effects and recovery
Accuracy and precision of the method were evaluated by measuring two replicates of a QC sample at three different concentration levels (low, medium and high) on five consecutive days. Matrix effects and recovery were analyzed for five replicates at low and high concentration levels for Δ9-THC, CBN and CBD. The matrix effect was measured by comparing the areas under the peaks from spiked hair after extraction (A) to spiked solvent (methanol/2 mM aqueous ammonium formate = 1/1, v/v) at the same concentration (B) (Matrix effect = [A/B] × 100). Recovery was measured by comparing the areas of the peaks from spiked hair before extraction (C) to spiked hair after extraction (A) (Recovery = [C/A] × 100).
Spiking experiments
First, the pooled THC-positive hair sample ‘Pool 1’ was analyzed according to the herein described protocol. Spiking experiments were performed according to the same protocol with minor modifications as follows: prior to extraction, a 1/1 mixture of Δ9-THC and CBN was added at two different concentrations to approximately 20 mg of ‘Pool 1’. In a second spiking experiment, a solution of Δ9-THCA-A was added at two different concentrations to approximately 20 mg of ‘Pool 1’ prior to extraction.
Results and Discussion
Method development
Methanol was chosen as extraction solvent, which has been shown to be a good compromise for the extraction of all four analytes (Δ9-THC, CBN, CBD and Δ9-THCA-A) (27). Gas chromatography–MS is used in the majority of proposed methods for the determination and quantification of cannabinoids in biological samples; however, diverse LC–MS methods have been introduced in recent years (34). In the present study, APCI was considered as ionization technique in LC–MS as it is particularly suitable for non-polar analytes such as cannabinoids. In fact, preliminary data revealed a higher sensitivity for APCI compared to electrospray ionization (ESI).
Method validation
QC samples at three different concentration levels (25, 1,500, and 4,500 pg/mg) were used in validation experiments as described above. Validation data are summarized in Table II. In selectivity experiments, it was shown that CBD, CBN and Δ9-THC eluted free of interfering peaks. Linearity was evaluated by measuring five replicates for each calibration level (20, 50, 100, 500, 1,000, 2,000, 3,000, 4,000 and 5,000 pg/mg). The regressions were linear (weighting 1/x) within the concentration range of 20–5,000 pg/mg. Two replicates in the low concentration range (5, 10, 15, 20 and 25 pg/mg) were measured to determine the LOD and LOQ that fulfilled the requirement of a signal-to-noise ratio of 3:1 and 10:1, respectively. For all analytes, the LOD and LOQ were 10 and 20 pg/mg, respectively, with the LOQ for Δ9-THC below the suggested cutoff of the Society of Hair Testing (SoHT) guidelines (35). Precision and accuracy were within acceptable range with a maximum deviation of 13% (CBD). The calculated matrix effects were between 107 and 130% (CBD), between 126 and 133% (CBN) and between 116 and 126% (Δ9-THC). These data indicate notable signal enhancements for CBD and CBN with matrix effects slightly above the recommended threshold of 125%. However, all standard deviations were in an acceptable range, illustrating the reproducibility of the measurements. Therefore, these results were considered to be acceptable. Eventually, the recovery was above 50% for all analytes at low and high concentration levels. The robustness was tested on the basis of successfully passed international proficiency tests.
Validation Parameters
| QC sample | Analyte | Target value (pg/mg) | Mean value (pg/mg) | Accuracy (%) | Repeat-ability (%) | Inter-day precision (%) | Recovery % (standard deviation) | Matrix effects % (standard deviation) |
|---|---|---|---|---|---|---|---|---|
| QClow | CBD | 25 | 28 | 13 | 6.2 | 5.9 | 122 (5.4) | 107 (13) |
| CBN | 26 | 5.7 | 7.1 | 8.1 | 126 (4.0) | 133 (15) | ||
| Δ9-THC | 23 | −6.4 | 9.6 | 8.0 | 115 (12) | 116 (23) | ||
| QCmedium | CBD | 1,500 | 1,419 | −5.4 | 5.9 | 4.5 | N/A | N/A |
| CBN | 1,387 | −7.6 | 5.6 | 5.2 | N/A | N/A | ||
| Δ9-THC | 1,461 | −2.6 | 5.3 | 4.8 | N/A | N/A | ||
| QChigh | CBD | 4,500 | 4,541 | 0.9 | 5.2 | 4.0 | 114 (6.5) | 130 (15) |
| CBN | 4,612 | 2.5 | 4.9 | 7.8 | 125 (9.2) | 126 (18) | ||
| Δ9-THC | 4,701 | 4.5 | 5.2 | 6.5 | 123 (13) | 126 (22) |
N/A, not determined.
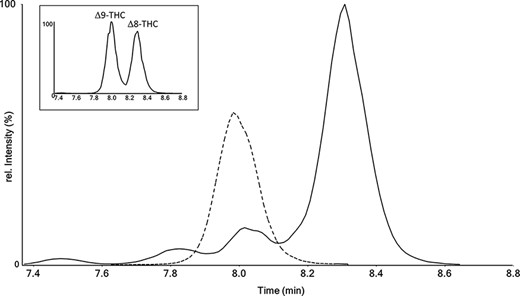
Extracted ion chromatogram for the first transitions of THC (315→193) measured for a ∆9-THC-containing QC sample (dashed line) and for an authentic hair sample from our routine casework (solid line). Subfigure: Extracted ion chromatogram for the first transitions of THC (315→193) measured for a 1/1 mixture of ∆9-THC and ∆8-THC.
Artifacts in authentic hair samples
The total run time of the LC run was 15 min with CBD, CBN and Δ9-THC eluting at 5.3, 6.9 and 8.0 min, respectively. It is noteworthy that, during method development, additional peaks at shifted retention times were detected in several authentic hair samples. For example, one authentic hair sample with a very high CBD content showed a false THC signal eluting 0.3 min after the expected retention time of ∆9-THC (Figure 1). A matrix effect was ruled out because the retention time of the deuterated standard Δ9-THC-d3 was stable over the entire measurement series. The MS-MS spectrum of the 0.3 min-shifted THC signal was identical with Δ9-THC (Figure S1). This is also known to be true for ∆8-THC—a positional isomer of ∆9-THC—that differs only by the position of a double bond (36). The retention time shift of 0.3 min could be confirmed by the measurement of a mixture containing both isomers (Figure 1) and corresponds with previous studies in which ∆8-THC eluted about 0.3 min after ∆9-THC under similar chromatographic conditions (36, 37). Overall, it can be concluded that ∆8-THC was present in the specific hair sample at a concentration of 4,300 pg/mg. Quantification of ∆8-THC was achieved via the calibration curve of Δ9-THC yielding accuracies equal to or better than 90% for QC samples containing 250, 2,500 and 4,500 pg/mg of Δ8-THC. The origin of ∆8-THC in the specific hair sample cannot be fully explained, especially because Δ8-THC is only found in a few strains of Cannabis plants at very low concentrations (37). However, under acidic conditions, CBD is converted to ∆8-THC and ∆9-THC whereas reaction conditions can be adapted to enhance the yield in favor of ∆8-THC (38–40). Therefore, ∆8-THC may be formed after acidic treatment of CBD-rich hemp products. This is in agreement with the high concentration of CBD (2,400 pg/mg) in the respective hair sample and is further supported by confiscation of CBD-hashish containing ∆8-THC in the canton of Zurich (personal communication). ∆8-THC is less psychoactive, possessing about 50% of the potency of Δ9-THC (41). Owing to its relaxing effect without causing anxiety attacks or confusion, the significance of ∆8-THC may further increase in the hemp-product-consuming community.
Eventually, further unexpected signals were observed in THC-positive hair samples in pretests using continuous MRM mode. These additional signals eluted each at 9.8 min, exhibiting the same MRM transitions as CBN and Δ9-THC. This is shown for ‘Pool 1’ in Figure 2. The measured concentrations in “Pool 1” were 270 pg/mg for the signal at 9.8 min with the MRM corresponding to CBN and 450 pg/mg for the signal at 9.8 min with the MRM corresponding to Δ9-THC. Interestingly, when measuring a standard solution of Δ9-THCA-A in the negative mode (Method 2), it could be shown that Δ9-THCA-A elutes at the same retention time (9.8 min) as the observed alleged artifact(s) (Figure 2). A viable hypothesis for these results (same MRM transitions as CBN and THC but at the same retention time as Δ9-THCA-A) could be in-source degradation of Δ9-THCA-A. To prove this hypothesis, different spiking experiments were performed.

Extracted ion chromatogram for the first transitions of (A) CBN (311→223) and (B) Δ9-THC (315→193) measured for a pooled THC-positive hair sample. (C) Extracted ion chromatogram for the first transition of Δ9-THCA-A measured for a standard solution containing Δ9-THCA-A (Method 2).
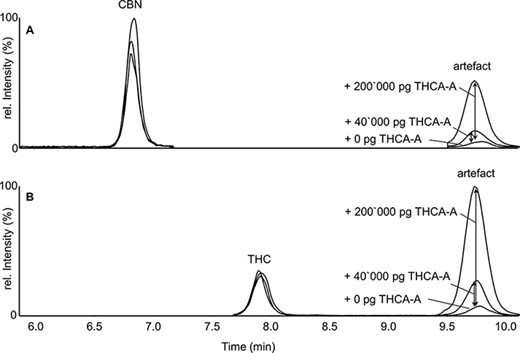
Standard addition of Δ9-THCA-A into ‘Pool 1’. Extracted ion chromatogram for the first transition of (A) CBN and (B) Δ9-THC after spiking 0, 40,000 and 200,000 pg of Δ9-THCA-A.
Spiking experiments for elucidation of additional peaks
In a first experiment, a 1:1 mixture containing (I) 8,000 pg and (II) 16,000 pg of Δ9-THC and CBN was spiked into a pooled THC-positive hair sample (Pool 1) prior to extraction. In the LC–MS-MS chromatogram, only the intensities of the respective analyte signals increased while the peak at 9.8 min remained unchanged (Figure S2). Hair concentrations increased according to the spiked amounts of Δ9-THC and CBN (accuracy 90–108%). In a second experiment, solutions containing (I) 40,000 pg and (II) 200,000 pg of Δ9-THCA-A were spiked into ‘Pool 1’ samples prior to extraction. In the LC–MS-MS chromatogram, the artifacts increased while the peak areas of the genuine analyte signals (Δ9-THC and CBN) remained unchanged within normal variation (Figure 3). Hence, these standard addition experiments clearly show that the intensities of the artifacts were only affected by adding Δ9-THCA-A, but not by adding CBN or Δ9-THC. Eventually, for the identification of the analytes, EPI spectra were monitored. These measurements revealed identical fragment patterns for the artifacts and analyte signals of CBN and Δ9-THC, respectively (Figure S3).
Overall, these data strongly indicate that the artifacts originate from Δ9-THCA-A most probably due to in-source degradation in APCI–MS. It is well known that Δ9-THCA-A is prone to decarboxylation into Δ9-THC during storage, fermentation and/or smoking or heating (42, 43), with the highest decarboxylation rate of 67% observed at temperatures of about 220°C (29). Other side reactions are known, such as the non-enzymatic oxidation of Δ9-THC to CBN (29), which is shown to be significant at temperatures between 85°C and 100°C (44). Taking into consideration the herein described results and the temperature in the ion source (450°C), it can be hypothesized that decarboxylation of Δ9-THCA-A to Δ9-THC occurs in the APCI ion source, and Δ9-THC is further converted to CBN to a low extent (Figure 4). It is noteworthy that decarboxylation of Δ9-THCA-A has also been observed after alkaline hydrolysis for the extraction of cannabinoids from hair (17) or as result of thermal degradation in the ultrasonic bath. Depending on the chromatographic method, this may accordingly result in falsely increased Δ9-THC concentrations in hair (17, 45).
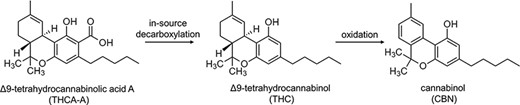
In-source degradation of Δ9-THCA-A.
Artifacts in authentic hair samples
In further experiments, THC-positive hair samples (n = 13) including three pooled hair samples were analyzed using LC–APCI–MS-MS. For all samples, the area ratios of the artifact-to-analyte signals and the concentrations for Δ9-THC and CBN were determined (Table S1). In these samples, the area ratios of the artifact-to-analyte signals varied over a wide range for Δ9-THC (range: 0.15–3.35 and median: 0.84) and CBN (range 0.03–5.51 and median: 0.77), respectively. In five hair samples (Specimens 4–7, 10), the artifact signals were even greater than the respective analyte signals for Δ9-THC and CBN, respectively.
Nine out of 13 hair samples (Specimens 2–10) were additionally measured using the same method except that more gentle ESI was applied. In seven samples (Specimens 4–10), artifact signals at the MRM transitions of Δ9-THC were detected. In these samples, the area ratios of the artifact-to-analyte signals were significantly lower compared to the respective LC–APCI–MS-MS measurements (Table S1). In LC–ESI–MS-MS, artifacts at the MRM transitions of CBN were not detected in any of the samples (Specimens 2–10). APCI is known to be the stronger ionization technique compared to ESI, which is in agreement with our data indicating that in-source degradation in ESI is very low compared to APCI.
Δ9-THCA-A is the non-psychoactive precursor of Δ9-THC and the main cannabinoid in plant material. The detection of Δ9-THCA-A in hair has been suggested as marker for external contamination because Δ9-THCA-A is not incorporated via the bloodstream into the hair after oral uptake (17, 22) but is rather transferred through contaminated fingers (23). Our results suggest that Δ9-THCA-A can be detected indirectly via the herein described artifact signals, which therefore may be used as indirect markers for external contamination. Alternatively, LC–MS methods for the measurement of THC, CBN, CBD and THCA-A using polarity switching could be applied as previously published (27). However, polarity switching is known to be prone to charging effects accompanied by sensitivity loss (46, 47) and was therefore considered as not preferable for routine use.
Conclusion
A robust and sensitive LC–APCI–MS-MS method operating in positive mode was successfully established and fully validated for the quantification of Δ9-THC, CBN and CBD in hair. The origin of artifacts in authentic hair samples that were measured during method development could be elucidated. First, it was shown that an unexpected signal with a slightly shifted retention time of Δ9-THC corresponds to the isomer Δ8-THC, thus enabling the quantification of Δ8-THC in authentic hair samples. Furthermore, the presented data indicate in-source fragmentation of the thermo-labile Δ9-THCA-A to Δ9-THC, which is to some extent further oxidized to CBN. These artifacts were only observed to a minor extent in ESI. Hence, for LC–APCI–MS-MS methods, in-source degradation of Δ9-THCA-A should be taken into account for the analysis of hair samples from cannabis users, which are typically contaminated with Δ9-THCA-A. Data should be interpreted with caution, especially for methods with poor chromatographic separation between Δ9-THCA-A and Δ9-THC (and/or CBN), as in-source degradation of Δ9-THCA-A may lead to falsely increased Δ9-THC and CBN concentrations. Eventually, our data suggest that the artifact-to-analyte ratios may be valuable indirect markers for external contamination; however, this has to be confirmed in further experiments.
Supplementary data
Supplementary data is available at Journal of Analytical Toxicology online.
Acknowledgments
We express our gratitude to Emma Louise Kessler, MD, for her generous legacy donated to the Institute of Forensic Medicine at the University of Zurich, Switzerland, for research purposes.
Data Availability
The data underlying this article are available in the article and in its online supplementary material.
Funding
The authors have no other relevant affiliations or financial involvement with any organization or entity with a financial interest in or financial conflict with the subject matter or material discussed in the manuscript apart from those disclosed.
