


Abstract
Our aim with this study was to evaluate the consumption, performance, quantitative characteristics of carcasses, biochemical profile, plasma levels of ghrelin and leptin, expression of the receptor for ghrelin (GHS-R1a) in the hypothalamus and duodenum, and the number of goblet cells in the duodenum of calves subjected to milk volume restriction and supplemented with 2-hydroxy-4-(methylthio)butanoic acid (HMTBa). We used 21 Holstein mixed-breed calves, aged between 3 and 15 d with an average weight of 36.8 kg, and housed in pens with troughs for hay, concentrate, and water. The study included two consecutive experimental periods (first period [P1] and second period [P2]) of 21 d each, with 7 d of adaptation to the diet and facilities. The calves were distributed in a completely randomized design in three treatments with seven repetitions. 1) Control: 6 liters of milk/d during P1 and 6 liters of milk/day during P2; 2) RES (milk restriction): 3 liters of milk/day during P1 and 6 liters of milk/day during P2; and 3) RES + HMTBa: 3 liters of milk/day during P1 and 6 liters of milk/day during P2 + 3.3 g of HMTBa/day in both periods. HMTBa was supplied in milk, and the amount of concentrated ration and hay provided and leftovers were recorded daily to estimate dry matter (DM) and crude protein consumption. Mean daily weight gain (DWG), final weight (FW), and feed conversion (FC) were obtained at the beginning and at the end of each 21-d period. Plasma concentrations of ghrelin and leptin, triglycerides, total protein, urea, lactate, creatinine, alkaline phosphatase, and cholesterol were measured for P1 and P2 at the end of each 21-d period. At the end of P2, animals were slaughtered; sections of the duodenum were collected to evaluate the expression of GHS-R1a and quantity of goblet cells; hypothalamus was used to evaluate the expression of GHS-R1a; rumen was used to evaluate the thickness of epithelium and keratin and the density, height, and width of ruminal papillae. In P1, total DM consumption, FW, DWG, glucose, and triglycerides were lower in the RES and RES + HMTBa groups (P < 0.001). In P2, there was an improvement in the FC of the RES + HMTBa group (compared with Control and RES groups) and a lower urea concentration in the RES group (compared with Control and RES + HMTBa groups) (P < 0.001). No differences were observed among groups regarding hormonal concentrations, histological parameters, and GHS-R1a expression in the duodenum and hypothalamus. Therefore, milk restriction combined with HMTBa supplementation promoted greater compensatory gain by a mechanism independent of changes in GHS-R1a expression and hormone levels of ghrelin and leptin.
Introduction
To improve calves’ weight gain (WG), several approaches are used such as food supplementation and restriction of milk supply during calf development. Methionine supplementation is an alternative that may have additive effects on protein metabolism, resulting in better growth rates (Silva et al., 2018). However, since the dl-methionine is degraded in rumen, the alternative is to supplement with 2-hydroxy-4-(methylthio)butanoic acid (HMTBa), which is converted to methionine in various tissues (Dibner and Knight, 1984). Moreover, HMTBa has an advantage of being more resistant to ruminal degradation compared with dl-methionine (Lapierre et al., 2011). In dairy cattle, HMTBa is used to increase the production and levels of protein and fat in milk (Baldin et al., 2018). Indeed, dietary supplementation of essential amino acids aims to complete the dietary amino acid profile and to compensate potential amino acid imbalances (Rychen et al., 2018). Similarly, milk restriction during calf development is an approach that has proven effective to stimulate compensatory WG (Alves, 2003; Alves Costa et al., 2019). The compensatory WG results in economic benefits, since the milk saved during the calves feeding period can be used for other economic destinations.
One hypothesis for the compensatory gain mechanism in animals, as also in humans, is the hormonal action, like those involved in the hunger mechanism. In this scenario, gastric release of ghrelin is involved with both food intake (Wertz-Luz et al., 2006) and secretion of growth hormone (GH) (Thidar Myint et al., 2006). Ghrelin, in cattle, is a peptide composed of 27 amino acid residues. Its biological activity occurs through acylation of the third amino acid residue (serine) by addition of an octanoic site (Kojima and Kangawa, 2005). The ghrelin receptor (GHS-R) is a G-protein-coupled receptor and presents two isoforms: GHS-R1a (functional isoform for ghrelin) and GHS-R1b. Studies demonstrated the peripheral expression of GHS-R1a in several organs such as stomach and intestine (Guan et al., 1997; Date et al., 2000). In the central nervous system (CNS), GHS-R1a expression was found in the hypothalamus and anterior pituitary, corroborating its role in GH release. In addition, GHS-R1a was found in the hypothalamus’ arched nucleus, thus elucidating its importance in controlling appetite (Muccioli et al., 1998; Katayama, et al., 2000). Although Alves Costa et al. (2019) reported no statistical differences for GHS-R1a expression in hypothalamic tissues of calves submitted to milk restriction, the expression of the receptor in hypothalamus is of interest due to the fact that GHS-R1a expression is differentially regulated in different regions of the brain during aging (Sun et al., 2007). Other tissues have GHS-R1a receptors, such as pancreas, kidneys, and circulatory system. However, this study did not focus on those sites because they, apparently, have no influence on the digestive tract development and on animal performance.
Leptin is another hormone involved in energy consumption and metabolism regulation, whose actions are antagonistic to ghrelin. Leptin is a 16-kD peptide (Zhang et al., 1994), whose receptors are expressed in the CNS, activating the center of satiety in the hypothalamus (Dias-Salman et al., 2007). According to Hayashi et al. (2020), leptin, secreted by the abomasum, acts on the hypothalamus and causes short-term appetite inhibition. Also, the presence of leptin in the gastric juice increases the peptide transporter 1 and inhibits glucose transportation by the sodium-glucose linked transporter-1 (SGLT-1) in the small intestine (Ducroc et al., 2005). Specifically in suckling calves, it is suggested that leptin produced in the abomasum acts via the endocrine and exocrine systems (Hayashi et al., 2020). Altogether, it is evident that the regulation of ghrelin, leptin, and GH levels is relevant with regard to animal production, because of its impact on WG and body size growth. Therefore, it is important to investigate how HMTBa supplementation and milk restriction influences hormonal profile, especially ghrelin and leptin.
In addition to hormonal profile, integrity of intestinal mucosa is an important factor for verifying livestock performance. Goblet cells of the mucosa produce mucus whose functions include lubrication, digestion, absorption, hosting of intestinal microflora, and protection from toxins and pathogens (Nag and Prasad, 2016).
Moreover, small intestine mucosa has villi and microvilli, which are specialized structures to ameliorate nutrient absorption (Bühler et al., 1998). At the base of the villi are the crypts, which are responsible for the constant cell renewal in the villus. According to Nabuurs (1995), it is desirable that the mucosa has high villi and shallow crypts. Interestingly, the food type can influence intestinal morphology. Other important absorption site is the rumen. Though, at birth, calves do not have the physiological and anatomical characteristics that characterize them as ruminants and milk is their main nutrient source (Jasper and Weary, 2002). The transition to the condition of functional ruminant occurs around 8 wk of age and depends on consumption of solid food, which leads to short-chain fatty acids (SCFA), specially butyric and propionic (Baldwin et al., 2004). The mean length of the calves’ ruminal papillae is about 1.0 mm; however, it can reach 5 to 7.0 mm at the eighth week (Beharka et al., 1998). The papillae increase absorption surface and are responsible for absorption of most of the SCFA (Harrison et al., 1960). Thus, alternatives to fasten papillae development would improve calves’ growth. Therefore, the supplement with HMTb and milk restriction can influence the intestinal and ruminal mucosa, improving the nutrient absorption. However, little is known about the mechanisms of action behind both approaches. In this way, this study aimed to evaluate the effect of milk restriction, with or without supplementation with HMTBa, on food intake, plasma levels of total ghrelin, leptin, GHS-R1a expression in the hypothalamus and duodenum, and also histology of the rumen and duodenum of calves.
Material and Methods
All procedures and protocols used in this experiment were approved by the Animal Ethics and Experimentation Committee of the Federal University of Goias, under protocol number 028/15.
Animals and feeding
The study was conducted in the Experimental Shed at the School of Veterinary Medicine and Animal Science of the Federal University of Goias (UFG), Campus Samambaia, between February and March 2015. We used 21 mixed-breed Holstein × Jersey calves, aged between 3 and 15 d and an average weight of 36.8 kg, identified and housed in individual bays, and provided with milk and water buckets and troughs for hay and concentrate (Table 1). Hay and concentrate were provided ad libitum for all treatments. The animals were donated by dairy farmers from different properties in the region within 50 km of Goiânia. The animals had an adaptation period of 7 d to both the diet and the facilities. Animals were distributed in a completely randomized design with three treatments and seven repetitions. Treatments consisted of 1) Control: 6 liters of milk/day in the first period (P1) and 6 liters of milk/day in the second period (P2); 2) RES (milk restriction): 3 liters in P1 and 6 liters of milk/day in P2; 3) RES + HMTBa: 3 liters in P1 and 6 liters of milk/day in P2 with 3.3 g of HMTBa/day (MintrexZn feed supplement with 83% HMTBa and 2.4% Zinc; Novus International Inc., St. Charles, MO). Milk was provided over 42 d in buckets and divided into the first and second periods of 21 d each. The daily amount of milk and HMTBa supplement treatment was divided into two portions at 8:00 a.m. and 4:00 p.m. In P1, the Control group received two meals of 3 liters of milk, whereas the RES and RES + HMTBa groups received two meals of 1.5 liters each. In P2, the animals of all groups received two meals of 3 liters each. The nutritional composition of milk supplied to calves as a percentage of dry matter (% DM) was as follows: 13.24 DM, 3.67 crude protein (CP), 4.69 lactose, and 4.31 fat. MintrexZn (Novus International Inc., St. Charles, MO) is a compound that has in its chemical structure calcium ionically bound to two molecules of HMTBa calcium bis(2-hydroxy-4-(methylthio)) butyrate and Zn chelated to two molecules of HMTBa (chelated Zn). MintrexZn is a powder with density of 0.65 to 0.75 g/cm3 and is supplied in milk.
Chemical composition, g kg−1 DM, of concentrate and hay used in the experiment
| Nutrient | Concentrate1 | Tifton hay |
|---|---|---|
| DM | 857.0 | 898.0 |
| Crude protein | 186.0 | 92.0 |
| Neutral detergent fiber | 107.3 | 777.4 |
| Acid detergent fiber | 23.7 | 400.4 |
| Ether extract | 31.6 | 13.3 |
| Nutrient | Concentrate1 | Tifton hay |
|---|---|---|
| DM | 857.0 | 898.0 |
| Crude protein | 186.0 | 92.0 |
| Neutral detergent fiber | 107.3 | 777.4 |
| Acid detergent fiber | 23.7 | 400.4 |
| Ether extract | 31.6 | 13.3 |
1Proportion of ingredients in concentrate: ground corn and cornmeal (70.0%), soybean meal (29.0%), and mineral premix without additive (1.0%).
Animal consumption and performance
The estimated consumption of DM and CP of each animal was obtained by daily measurements of the amount provided of concentrated feed and tifton hay and their leftovers (considering 10% of leftovers). DM, CP, ether extract, neutral detergent fiber, and acid detergent fiber (AOAC, 1990) were determined in samples from the concentrate and hay supplied. To obtain the DWG and feed conversion (FC), the calves were weighted at the beginning and at the end of each of the 21-d periods.
Blood collection, biochemical, and hormonal analyses
Blood collection was performed via a venipuncture of jugular vein in vacuum tubes (Vacutainer) containing sodium fluoride with ethylenediaminetetraacetic acid (EDTA) and siliconized without anticoagulants (20 mL, for serum biochemical concentrations) and with anticoagulants (20 mL, for plasma concentrations of ghrelin and leptin hormones) at 6:00 a.m. and at the end of P1 and P2. Soon after collection, blood samples were immediately placed on ice (4 °C), followed by centrifugation (2,000 × g, 15 min, 4 °C). Then transferred by pipette to 2 mL plastic tubes and stored at −20 °C for biochemical analyses and −80 °C for hormonal analyses with subsequent serum and plasma samples frozen (–80 °C). Serum concentrations of glucose, triglycerides, total protein, urea, lactate, creatinine, alkaline phosphatase, and cholesterol were carried out using Labtest Diagnostica SA kits as per manufacturer’s directions and analyzed in an automatic biochemical apparatus LABMAX PLENNO, Labtest Diagnostica SA. The total serum ghrelin and plasma leptin were obtained using the Enyzme Linked Immune Sorbant Assay (ELISA) sandwich technique (Ozturk et al., 2013). In a 96-well polystyrene plate, 100 μL of rat anti-ghrelin antibody (AAU93610 RayBiotech, Norcross, GA, 100 μg/mL) was added per well, and the sealed plate incubated overnight at 4 °C. Rat ghrelin has been used and validated to detect bovine ghrelin in another study (Miura et al., 2014). The plate was washed five times using washing buffer (50 mM Tris-HCl containing Tween-20) and blocked with 1% bovine serum albumin for 1 h. Subsequently, 20 μL of serum samples and standards was added to the wells and the plate was incubated overnight at 4 °C, followed by five washes with washing buffer. Sequentially, 100 μL of detection antibody (0.25 μg/mL; Peprotech) was added to all wells. The plate was then covered and incubated for 4 h at room temperature in a shaker at a moderate speed. After incubation, the plate was washed five times and 100 μL of enzyme solution (streptavidin-poly HRP80 conjugated peroxidase in phosphate-buffered saline [PBS]) was added and incubated for 1 h at room temperature. Finally, the plate was washed five times, and 100 μL/well of substrate solution (3,3′,5,5′-tetramethylbenzidine in PBS with H2O2) was added. After 30 min of development, 100 μL of stop solution (0.3 M HCl) was rapidly added and the plate was read in a Genios plate reader (Phoenix Research Products, Candler, NC) and Multi Skan Go microplate reader (Thermo Scientific, Software 2.4) with an excitation wavelength of 535 nm and an emission filter of 590 nm. For the leptin analyses, the anti-human leptin antibody (500-P86 Peprotech, Rocky Hill) was used, and we followed the same methodology used for ghrelin analyses. Note that leptin human homology with bovine leptin was validated in another study (Miura et al., 2014).
Tissue collection
At the end of P2, animals were transported to a slaughterhouse with a State Inspection Service. After 12 h of fasting, they were slaughtered by cerebral concussion, followed by jugular and carotid venesection, according to the Normative Instruction N°3 of January 13, 2000 (Brazil, 2000). Animals that entered the slaughter line were divided into two half-carcasses that underwent washing, identification, weight measurement, and subsequent cooling in a cold room at 1 °C, for 24 h. After this period, carcasses were weighed again to obtain the cold carcass weight (CCW). Hot carcass yields (HCYs) were obtained by the relationship between hot carcass weight (HCW), CCW, and live body weight multiplied by 100. The left half-carcass was then separated into the following cuts: front portion, needle tip, and special hind portion. Pieces of the dorsal sac of the calves’ rumen were collected for quantifying histological variables of the rumen (papillary density and thickness of epithelium and keratin). These pieces were placed in PBS for papillae count and in fixative solution (10% formaldehyde) for histological analysis. Quantification of ruminal papillae was performed in pieces of 1 cm2 observed using binocular magnifying glasses. Papillae counting per cm2 was carried out by three observers to obtain the average papillae density (papillae/cm2). Samples collected from the intestine were submerged in 10% formaldehyde solution to count goblet cells using periodic acid Schiff (PAS) staining. This also allowed for confirming GHS-R1a expression throughout the intestinal mucosa by immunohistochemistry. Samples from intestine (medial portion of the duodenum) and hypothalamus were collected, immediately frozen in liquid nitrogen, and stored at −80 °C, prior to determining GHS-R1a expression using Western blot technique.
Histological analysis
Rumen and duodenum
After 24 h of fixation, the tissues from the rumen and duodenum were washed in running water and maintained in 70% alcohol until histological processing for inclusion in paraffin. Moreover, 3-mm-thick tissue fragments were dehydrated in increasing concentrations of alcohol (70% to 100%), cleared in xylol, and immediately included in paraffin at 58 to 60 °C. Paraffin blocks were cut by a rotating microtome to obtain 5-µm-thick histological cuts, which were mounted on silanized slides. After dewaxing and hydration, rumen cuts were stained using the Hematoxylin-Eosin (HE) technique (hematoxylin stained for 4 min and followed by eosin staining for 1 min, followed by a dehydration step in increasing series of alcohol and mounted on synthetic resin) to obtain morphometric measurements. Moreover, imaging was performed under the Leica DM 4000B microscope with a 40× objective for morphometric measurements: height and width of papillae and keratin and epithelium thickness. To quantify goblet cells of the duodenal mucosa, cuts were dewaxed and hydrated for further staining using the PAS technique (slides where deparaffinized and hydrated to water, oxidized in periodic acid solution, placed in Schiff reagent, and washed in lukewarm tap water, where the magenta color was highlighted in the positive PAS material) (Prophet et al., 1992). Image capture was performed under the Leica DM 4000B microscope with a 20× objective. For analysis, six fields were randomly selected in two cuts of each animal. The quantification of PAS-positive areas, number of PAS-positive cells, and the relationship of the area with the number of cells were performed using the Image-Pro Plus software.
Immunohistochemistry
Immunohistochemistry for marking of GHS-R1a was performed on duodenum pieces. Cuts on silanized slides were dewaxed and hydrated. After antigenic recovery with a sodium citrate buffer (pH 6.0), slides were incubated with 3% hydrogen peroxide in methanol for 10 min to block endogenous peroxidase activity. The primary antibody (1:500, Antibody/GHS-R1, BIOSS BS-11529R, USA) was incubated overnight at 8 °C. As a secondary antibody, the Max Polimer Detection System (Novo Link Kit, Novocastra, UK) was used. Specimens were then stained against hematoxylin, dehydrated in ethanol, cleared with xylol, and the slides were covered with Entellan and coverslip. Rat pituitary, known to express ghrelin, was used as a positive control, and a specimen that received a buffered solution of PBS rather than the primary antibody was used as a negative control. A positive result was indicated by the brown coloration at the binding site of the antibody throughout the length of the captured image, which represented the intestinal mucosa of the calves. The areas, in pixels, of colored tissue section (brown color) in six fields were randomly selected in two cuts from each animal and quantified with the help of Image-Pro Plus.
Western blot
To confirm the effect of diet on GHS-R1a protein synthesis in the hypothalamus and duodenum, portions of these tissues were analyzed using the Western blot technique, as per the methodology proposed by Macedo et al. (2016). Specific extraction buffers were used to homogenize portions of duodenum (PBS 1X, 1% Nonidet P40, 0.5% sodium deoxycholate, and 0.1% sodium dodecyl sulphate) and hypothalamus (Hepes 50 mm, MgCl2 1 mm, EDTA 10 mm, and 0.5% Triton X-100). After obtaining the protein extract, samples were quantified and 40 µg of proteins per sample was fractionated by polyacrylamide gel electrophoresis. Next, the obtained bands were transferred to nitrocellulose membranes for incubation with primary and secondary antibodies. Membranes were incubated overnight at 4 °C with the primary Ghrelin receptor antibody (1:1,000, BIOSS Antibodies, USA) and with secondary anti-rabbit ImmunoglobulinG (IgG) horseradish peroxidase conjugated antibodies, (1:4,000, GE Healthcare, UK). Immunoreactivity was detected by chemiluminescence using enhanced luminol-based chemiluminescent as a substrate. The protein bands were quantified by densitometry analysis using ImageJ (National Institute of Mental Health, USA) and normalized using glyceraldehyde 3-phosphate dehydrogenase (GAPDH) as an internal control (1:1,000, Santa Cruz Biotechnology, USA).
Statistics
Data on consumption, performance, carcass, biochemical profile, rumen, and intestinal mucosa development were submitted to variance analysis, followed by Duncan’s test with 5% significance using the PROC GLM procedure from the SAS (Statistical Analysis System) program. For analyzing food consumption variables, initial body weights were used as a covariate to obtain the final corrected means. Data on ghrelin and leptin hormones and relative GHS-R1a expression of protein in the duodenum and hypothalamus were submitted to one-way analysis of variance (ANOVA), with post test Tukey using GraphPad Prism.6.1. The Spearman correlation coefficient, which measures the degree of association of variables with 5% significance, was used for correlation analysis, utilizing SAS.
Results
Milk-restricted calves, whether supplemented with HMTBa or not, did not influence the DM consumption (DMC) of solid foods expressed kg · d−1 in both periods (Table 2). In P1, consumptions of total DM (concentrate + bulk feed + milk) and total CP of animals in the groups RES and RES + HMTBa were lower compared with animals in the Control. In P1, regardless of HMTBa addition, animals under milk restriction had lower average daily weight gain (DWG) and final weight (FW; Table 3). In P2, the evaluated groups presented statistical difference in FC (P < 0.001), with the RES + HMTBa group presenting the best FC compared with the other groups. HCWs and CCWs and their yields (Table 4) were not influenced by milk restriction and/or supplementation with HMTBa. The primary cuts (front portion, special hind portion, and needle tip) and their yields were similar (P > 0.05) for the three groups. In P1, concentrations of glucose (P = 0.0365) and triglycerides (P = 0.0006) were lower in the animals of RES and RES + HMTBa groups (Table 5). In P2, urea concentration was lower for the RES group (P = 0.047). In both periods (P1 and P2), the concentrations of cholesterol, total protein, alkaline phosphatase, creatinine, and lactate did not differ (P > 0.05) among groups. There was no difference for the hormonal concentrations of total ghrelin and leptin (Figure 1) between the evaluated groups. Moreover, there was no correlation between the serum levels of ghrelin and leptin and the variables of production and biochemical profile (Table 6) between the groups. There were no differences (P > 0.05) regarding the thicknesses of the epithelium and keratin nor regarding the density of papillae of the dorsal portion of the rumen among the evaluated groups (Table 7). The average density of papillae did not show differences among the evaluated groups. Milk restriction did not influence the height (P = 0.214) and width (P = 0.409) of ruminal papillae (Figure 2). No significant differences (P > 0.05) for area and numbers of PAS-positive cells in the duodenum were seen among the groups (Table 8 and Figure 3). In the duodenum, mucosal cells were reported to be distributed in the epithelium of crypts and villi. Immunopositive areas for GHS-R1a in villi and crypts (Figure 4) of the duodenum mucosa were observed in the three groups without significant differences. No significant changes in the GHS-R1a expression in the duodenum and hypothalamus were observed (Figure 5).
Consumption of DM and CP of calves subject to milk restriction with or without supplementation of HMTBa
| Variable | Control | RES | RES + HMTBa | SEM | P-value |
|---|---|---|---|---|---|
| DMC1, kg d−1 P1 | 0.171 | 0.223 | 0.171 | 0.284 | 0.891 |
| tDMC2, kg d−1 P1 | 0.956a | 0.637b | 0.596b | 0.038 | <0.001 |
| CPC3, kg d−1 P1 | 0.031 | 0.040 | 0.030 | 0.006 | 0.5272 |
| tCPC4, kg−1 P1 | 0.057a | 0.055b | 0.045b | 0.006 | <0.001 |
| DMC, kg d−1 P2 | 0.497 | 0.488 | 0.364 | 0.111 | 0.6414 |
| tDMC, kg d−1 P2 | 1.318 | 1.308 | 1.184 | 0.111 | 0.6414 |
| CPC, kg d−1 P2 | 0.089 | 0.087 | 0.064 | 0.646 | 0.5272 |
| tCPC, kg−1 P2 | 0.119 | 0.117 | 0.094 | 0.006 | 0.6465 |
1DMC (Conc. + Hay).
2Total DMC (Concentrate + hay + milk).
3CP consumption (Conc. + Hay).
4Total CP consumption (Concentrate + hay+ milk).
a,bMeans followed with the same superscript letter within a row do not differ from each other by Duncan test (P > 0.05).
Performance variables, quantitative characteristics, and primary carcass cuts of calves subject to milk restriction with or without supplementation of HMTBa
| Variable | Control | RES | RES + HMTBa | SEM | P-value |
|---|---|---|---|---|---|
| tDMC, kg d−1P1 | 0.956a | 0.637b | 0.596b | 0.038 | <0.001 |
| IW1, kg P1 | 37.70 | 34.20 | 38.50 | — | — |
| FW, kg P1 | 53.64ª | 46.78b | 45.53b | 2.108 | 0.005 |
| DAWG2, kg d−1 P1 | 0.82a | 0.50b | 0.40b | 0.100 | 0.002 |
| TFC3 kg MS/kg P1 | 1.36 | 1.59 | 1.32 | 0.286 | 0.825 |
| tDMC, kg d−1P2 | 1.318 | 1.308 | 1.184 | 0.111 | 0.6414 |
| IW1, kg P2 | 53.64 | 46.78 | 45.53 | — | — |
| FW, kg P2 | 68.76 | 64.55 | 64.42 | 3.058 | 0.340 |
| TFC3, kg MS/ kg P2 | 1.74b | 1.65b | 1.28a | 0.062 | 0.001 |
| DAWG2, kg d−1 P2 | 0.755 | 0.802 | 0.925 | 0.061 | 0.113 |
| TWG4 | 31.828 | 27.428 | 26.782 | 3.091 | 0.679 |
| TADG5 | 0.758 | 0.653 | 0.637 | 0.451 | 0.679 |
| FC6 kg MS/kg | 3.089 | 2.807 | 2.927 | 0.141 | 0.512 |
1Starting weight.
2Daily average weight gain.
3Total food conversion.
4Total weight gain.
5Total average daily gain.
6FC of total experimental period (42 d).
a,bMeans followed with the same superscript letter within a row do not differ from each other by Duncan test (P > 0.05).
Quantitative characteristics and primary carcass cuts of calves subject to milk restriction with or without supplementation of HMTBa
| Variable | Control. | RES | RES + HMTBa | SEM | P-value |
|---|---|---|---|---|---|
| HCW, kg | 39.00 | 33.42 | 37.00 | 1.875 | 0.137 |
| HCY1, % | 55.45 | 54.56 | 55.95 | 1.047 | 0.434 |
| CCW, kg | 37.25 | 32.02 | 33.48 | 1.415 | 0.393 |
| CCY2, % | 54.37 | 52.18 | 51.92 | 2.260 | 0.482 |
| Front portion, kg | 15.20 | 12.82 | 14.05 | 1.111 | 0.807 |
| Special hind portion, kg | 19.31 | 16.75 | 17.01 | 0.842 | 0.155 |
| Needle tip, kg | 2.74 | 2.41 | 2.68 | 3.684 | 0.346 |
| Front portion3, % | 40.06 | 40.06 | 41.78 | 1.974 | 0.806 |
| Special hind portion3, % | 51.93 | 52.33 | 50.43 | 2.037 | 0.712 |
| Needle tip3, % | 7.52 | 7.603 | 7.77 | 0.410 | 0.909 |
1Hot carcass yield in kg 100 kg−1 LW.
2Cold carcass yield in kg 100 kg−1 LW.
3kg 100 kg−1 cold carcass.
Biochemical profile of mixed-breed calves submitted to milk restriction with or without supplementation with HMTBa in different periods
| Variable | Control | RES | RES + HMTBa | SEM | P-value |
|---|---|---|---|---|---|
| Glucose P1, mg/mL | 102.14a | 84.93b | 88.42b | 4.589 | 0.036 |
| Glucose P2, mg/mL | 126.00 | 124.52 | 127.16 | 5.132 | 0.932 |
| Cholesterol P1, mg/dL | 115.34 | 128.09 | 102.84 | 9.456 | 0.170 |
| Cholesterol P2, mg/dL | 104.16 | 117.86 | 100.15 | 9.235 | 0.310 |
| Triglyceride P1, mg/dL | 30.64a | 17.5b | 15.50b | 2.544 | <0.001 |
| Triglycerides P2, mg/dL | 28.11 | 26.04 | 28.42 | 2.431 | 0.455 |
| Total protein P1, g/dL | 6.13 | 6.21 | 6.62 | 0.335 | 0.728 |
| Total protein P2, g/dL | 6.31 | 6.15 | 6.56 | 0.327 | 0.745 |
| Alkaline phosphatase P1, mg/dL | 279.49 | 256.9 | 287.71 | 42.208 | 0.644 |
| Alkaline phosphatase P2, mg/dL | 376.50 | 396.25 | 439.17 | 45.889 | 0.135 |
| Creatinine P1, mg/dL | 0.79 | 0.88 | 0.83 | 0.055 | 0.546 |
| Creatinine P2, mg/dL | 0.79 | 0.70 | 0.71 | 0.056 | 0.266 |
| Urea P1, mg/dL | 25.29 | 19.86 | 21.39 | 2.236 | 0.097 |
| Urea P2, mg/dL | 21.95a | 17.25b | 18.78a | 1.243 | 0.047 |
| Lactate P1, mg/dL | 22.35 | 26.37 | 21.66 | 2.460 | 0.413 |
| Lactate P2, mg/dl | 18.41 | 15.46 | 18.33 | 1.265 | 0.106 |
a,bMeans followed with the same superscript letter within a row do not differ from each other by Duncan test (P > 0.05).
Spearman correlations between serum ghrelin and leptin levels and productive variables and biochemical profile
| Ghrelin | Leptin | |||
|---|---|---|---|---|
| Variable | ρ | P-value | ρ | P-value |
| tDMC, kg−1 d P1 | 0.115 | 0.618 | −0.002 | 0.999 |
| DAWG1, kg−1 d P1 | 0.044 | 0.846 | 0.156 | 0.499 |
| TFC2 kg MS/kg GP P1 | −0.068 | 0.766 | −0.055 | 0.810 |
| Glucose P1 | 0.227 | 0.321 | 0.327 | 0.147 |
| Total protein P1 | 0.263 | 0.248 | 0.054 | 0.814 |
| Cholesterol P1 | 0.161 | 0.485 | 0.250 | 0.273 |
| Triglycerides P1 | 0.371 | 0.097 | 0.244 | 0.284 |
| tDMC, kg−1 d P2 | 0.245 | 0.283 | 0.109 | 0.637 |
| DWG3, kg−1 d P2 | 0.381 | 0.087 | 0.330 | 0.143 |
| TFC kg MS/kg GP P2 | −0.238 | 0.296 | −0.150 | 0.617 |
| Glucose P2 | −0.092 | 0.690 | 0.087 | 0.706 |
| Total protein P2 | 0.045 | 0.844 | 0.024 | 0.915 |
| Cholesterol P2 | −0.073 | 0.750 | 0.037 | 0.871 |
| Triglycerides P2 | −0.221 | 0.334 | 0.026 | 0.908 |
1Daily average weight gain.
2Total food conversion.
3Correlation coefficient.
Variables of rumen of calves subject to milk restriction with or without supplementation with HMTBa
| Variable | Control (n = 7) | RES (n = 7) | RES + HMTBa (n = 7) | SEM | P-value |
|---|---|---|---|---|---|
| Epithelium, µm | 24.37 | 27.87 | 27.62 | 11.42 | 0.110 |
| Keratin, µm | 12.81 | 14.00 | 13.21 | 0.932 | 0.480 |
| Epithelium + Keratin, µm | 36.87 | 40.73 | 39.90 | 1.363 | 0.132 |
| Density, papillae/cm2 | 196.7 | 184.33 | 197.00 | 19.87 | 0.913 |
| HRP1, mm | 2.041 | 2.367 | 2.497 | 0.351 | 0.214 |
| WRP2, mm | 0.827 | 0.859 | 0.798 | 0.094 | 0.409 |
1Height of rumen papilla.
2Width of rumen papilla.
Area, cell numbers, and area PAS-positive cell ratio in the duodenum of calves subject to milk restriction with or without supplementation with HMTBa
| Variable | Control (n = 7) | RES (n = 7) | RES + HMTBa (n = 7) | SEM | P-value |
|---|---|---|---|---|---|
| PAS-positive area1 | 12.44 | 34.97 | 37.51 | 9,399 | 0.273 |
| No. of PAS-positive cells | 27.43 | 34.16 | 37.64 | 3,429 | 0.200 |
| Area/PAS-positive cells, mm2 | 0.45 | 1.02 | 0.99 | 0.244 | 0.250 |
1mm2.
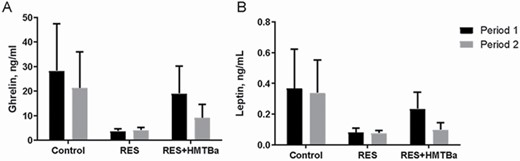
Plasma concentrations of total ghrelin (A) and leptin (B) of calves in the Control, RES, and RES + HMTBa groups. Mean ± SEM, N = 21.
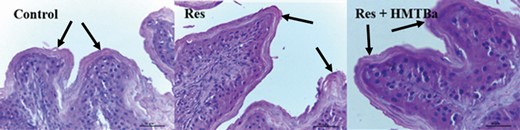
Photomicrography of ruminal papillae (point of the arrows) of calves in the Control, RES, and RES + HMTBa groups. Scale bar = 50 µm.
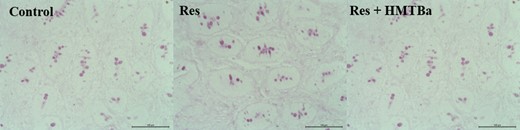
Photomicrography of PAS-positive cells in the duodenum of calves in the Control, RES, and RES + HMTBa groups. Scale bar = 100 µm.
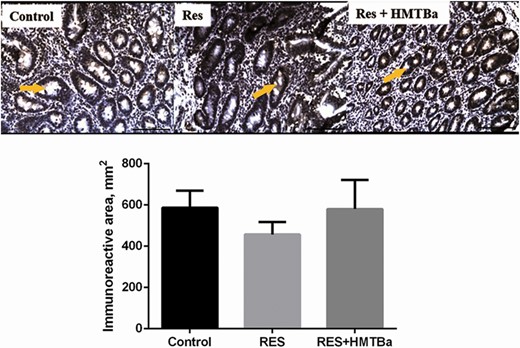
Photomicrography and quantification of immunoreactive area for GHS-R1a (arrows) in the duodenum (simple columnar epithelium) of calves in the Control, RES, and RES + HMTBa groups. Mean ± SEM. Scale bar = 100 µm.
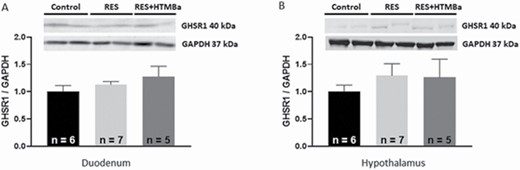
Expression of GHS-R1a in the duodenum (A) and in the hypothalamus (B) of calves in the Control, RES, and RES + HMTBa groups. Mean ± SEM.
Discussion
We aimed to evaluate the effect of milk restriction with or without supplementation with HMTBa on food intake as well as plasma levels of total ghrelin, leptin, and GHS-R1a expression in the hypothalamus of calves.
The minimum milk supply recommended for calves is 6 liters per day (Azevedo et al., 2016; Leão et al., 2018), distributed in two meals. This methodology was adopted in the present study for the Control group. Based on previous studies, milk volume was restricted to observe the occurrence of compensatory gain. Compensatory gain is represented by a rapid increase in animal performance after a period of low performance. This compensatory gain effect is signaled when, in the second experimental period, animals that have undergone food restriction accelerate DWG without increasing the consumption of DM (Table 3). We observed that glucose and triglycerides were significantly lower in the first experimental period in food-restricted animals (Table 5). This is another parameter confirming the effect of food restriction as a suitable methodology for inducing compensatory gain. The DMC of solid foods was similar among the evaluated groups, not being influenced by milk restriction or HMTBa supplementation. This consumption may have been reflected in ruminal development as the consumption of solid foods interferes with the development of ruminal papillae (Khan et al., 2011). This fact justifies the similar values observed among the groups in regard to measured rumen variables. The mean values found were as follows: epithelium thickness (26.62 µm), keratin thickness (13.34 µm), papillary density (192.33 papillae cm2), height (2.30 mm), and width of the ruminal papillae (0.82 mm). These values are in accordance with results obtained by other researchers (Maciel et al., 2016). Total DMC (tDMC), kg · d−1, was lower in calves submitted to milk restriction: 0.607 vs 0.966 kg. This is because of milk restriction, which is consistent with previous results with calves receiving smaller amounts of milk/or milk substitutes (Ozkaya and Toker, 2012; Silva et al., 2015; Schäff et al., 2016). The total protein consumption tCPC, kg d−1, is a reflection of tDMC and so it was smaller in animals under milk restriction in P1. Evaluation of calves’ performance is relevant, and according to Restle et al. (2005), heavier males at weaning have a reduction in the slaughter age and heavier females have a reduction in the age at puberty. The age reduction at puberty indicates a reduction in the age of first parturition, thus indicating an anticipation of the productive life of the animal. In the first period, the lowest tDMC of animals subjected to milk restriction (RES and RES + HMTBa) is reflected in the daily mean weight gain (0.400 and 0.500 kg) when compared with the unrestricted group (0.820 kg). Previous research has shown that 4 liters of milk per day provide nutrients only for maintenance and WG of 200 to 300 g/d under thermal conditions (15 to 25 °C; Drackley, 2008). In this study, 450 g/d gain was observed in calves receiving 3 liters of milk daily. This difference of 250 and 150 g/d higher than the aforementioned study is possibly attributed to the consumption of concentrate and bulk foods. This demonstrates the importance of providing a solid diet for calves during this initial phase. According to Ozkaya and Toker (2012), the lower WG obtained by calves receiving lower amounts of milk resulted from a reduction in digestion capacity and absorption of nutrients, which are reflected in animal growth. Thus, the supply of concentrated and bulk foods possibly influenced digestion capacity and absorption of nutrients. In the first period, supplementation with HMTBa did not show efficacy on performance, since there was no difference in WG between RES and RES + HMTBa groups. This indicates that methionine was not a limiting nutrient in our research. In fact, Molano et al. (2020) evaluated several methionine sources, HMTBa included, and found no difference from the Control group in the WG from birth to weaning. No improvement in calves’ performance was reported by Silva et al. (2018) when supplementing calves with methionine (5.3 g), lysine (17 g), glutamate (0.67 g), and glutamine (0.67) in calf milk substitutes. In P2, animals that were submitted to milk restriction in P1 but were supplemented with HMTBa obtained better FC, indicating greater efficiency of transforming nutrients into WG suggesting the occurrence of compensatory gain. The HMTBa is absorbed from the digestive tract and partially converts to methionine in the liver (Baldin et al., 2018). Data observed here may indicate a better hepatic activity caused by this mechanism, favoring the expression of mRNA for synthesizing muscle mass. These metabolic activities may express a mechanism related to the compensatory gain effect. The compensatory gain was evident when, in the second experimental period, the animals that were submitted to food restriction accelerated the DWG without increasing the DMC (Table 3).
Quantitative characteristics of bovine carcasses are primarily affected by the slaughter weight of animals (Vaz et al., 2008). The mean values of HCW (36.47) and CCW (34.31) and HCY (55.32) and cold (52.82) carcass yield (CCY) are in accordance with values reported by another study when evaluating calf carcass in this phase (Maciel et al., 2016). These results indicate similar development among calves, despite milk restriction, and contradict the idea that compensatory gain would only be the result of greater growth in the viscera.
As per the biochemical profile of calves, the restriction in milk volume, regardless of the supply of HMTBa, altered the concentrations of glucose and triglycerides, being lower in these restricted animals compared with the animals in the Control group, which has also been observed in another study (Khan et al., 2011). Calves submitted to milk restriction showed lower glucose and triglycerides concentrations compared with animals fed ad libitum (Schäff et al., 2016). The mean value of triglycerides of 16.5 mg/dL for animals subjected to milk restriction is within the normal range (16.3 to 34.8 mg/dL; Pogliani and Junior, 2007). Lower glucose and triglycerides concentrations were observed in milk-restricted calves (Alves Costa et al., 2019). As per these researchers, low triglycerides concentrations resulted from the use of triglycerides as an energy source (Alves Costa et al., 2019). Mean glucose concentrations of 86.67 mg/dL observed in animals subjected to milk restriction are within the reference range for newborn calves (62.6 to 88.3 mg/dL; Pogliani and Junior, 2007). Serum urea concentrations of milk-restricted calves supplemented with HMTBa were similar to the Control group, with mean values of 20.36 mg/dL, which are within the normal range of 20 to 30 mg/dL (Kaneco et al., 2008). This indicates similarity in protein metabolism between Control group and milk-restricted animals with and without HMTBa supplementation. Alkaline phosphatase, an important indicator of bone tissue formation or body construction (Hill et al., 2007), presented similar concentrations between groups, indicating milk restriction with or without HMTBa supplementation did not interfere in bone growth. Moreover, it was observed that serum alkaline phosphatase concentrations were not influenced by amino acid supplementation to milk replacer (Silva et al., 2018). The remaining serum parameters were within the normal range for calves 1 to 8 wk of age (Klinkon and Ježek, 2012), demonstrating that animals were in nutritional balance.
The duodenum is the site of various signs that regulate hunger, food intake, and action-mediated satiety of ghrelin and its GHS-R1a receptor (Hayashida et al., 2001; Lely, 2004; Alam et al., 2012). In this study, some atrophy in the duodenum was expected due to the results presented by Steinhoff-Wagner et al. (2015); however, this was not observed. The increase in milk supply quickly restores the morphology and function of the intestine (repair of intestinal atrophy and normalization of intestinal permeability) (Steinhoff-Wagner et al., 2015).
In addition to generating knowledge about duodenal ghrelin receptor expression, it is important to investigate the mucous layer. This layer coats the inner surface of the duodenum and is designed for maximum absorption because it is covered with villi protruding into the lumen resulting in increased surface area. It is known that maintaining the integrity of the duodenum’s mucosa is essential for calf development because digestive processes and absorption of nutrients are linked to productive performance of animals. Of the duodenum’s mucosa, the crypt layer is an area of continuous cell renewal and proliferation. Cells that move from crypts to villi transform into enterocytes, goblet cells, Paneth cells, or enteroendocrine cells (Collins and Badireddy, 2018) as ghrelin-producing cells. With regard to goblet cells, they protect the intestinal epithelium from the action of digestive enzymes and abrasive effects of digestion (Robertis and Hib, 2001). These cells, located in the intestinal crypts along the mucous surface, synthesize and secrete mucus, which contains “mucin,” that is, a substance composed of neutral and acidic mucopolysaccharides. Neutral mucin has a positive reaction by the periodic acid staining method of Schiff (PAS). In this study, the goblet PAS-positive cells were identified in the duodenum in similar numbers in the mucosa of calves among the evaluated groups. This result indicates that milk restriction and HMTBa supplementation did not alter neutral mucin production. The treatments tested in this study did not alter the expression of GHS-R1a in the hypothalamus. Other researchers reported no statistical differences for GHS-R1a expression in hypothalamic tissues of calves submitted to milk restriction (Alves Costa et al., 2019). Leptin concentrations were similar among the calves, with mean leptin values in calves were 0.22 ng/mL in P1 and 0.16 ng/mL in P2. This indicates that food restriction was not sufficient to alter the concentration of this hormone. Leptin concentrations in plasma remain ~2.3 ng/mL through 1 yr of age, indicating that leptin is regulated by postnatal nutrition (Block et al., 2003).
Milk restriction did not change plasma ghrelin concentrations with mean values of 17.17 ng/mL for P1 and 11.51 ng/mL for P2. Increased plasma ghrelin concentration in cattle has been observed with food deprivation (Wertz-Lutz et al., 2008). The blood collection methodology did not favor the observation of the ghrelin release pattern with greater accuracy. Other factors reported to alter ghrelin concentrations include body size, body composition, feeding frequency, diet composition, or feed quantity offered (Wertz-Lutz et al., 2006). Sugino et al. (2002) reported low plasma ghrelin concentrations in cattle with ad libitum feed and higher concentrations when intake was fractional. In the current study, in addition to milk restriction, milk was supplied across two meals daily, which could have favored increases of ghrelin concentrations. The free access to concentrate and hay probably influenced secretion of ghrelin, causing the observed variation in the results. Another important point that may have influenced ghrelin concentrations is the presence of solid foods in the gastrointestinal tract as the production of this hormone is inversely proportional to the amount of feed consumed (Heredia et al., 2015). Spearman correlations between serum ghrelin and leptin levels and the productive variables and the biochemical profile did not link these parameters to serum hormone levels under the conditions of the present study.
Conclusion
This study demonstrated that milk restriction along with HMTBa supplementation induced compensatory gain although the mechanism by which this occurred was not elucidated by the study.
Abbreviations
- CCW
cold carcass weight
- CCY
cold carcass yield
- CNS
central nervous system
- Control
6 liters of milk/day during P1 and 6 liters of milk/day during P2
- CP
crude protein
- DAWG
daily average weight gain
- DM
dry matter
- DMC
DM consumption
- DWG
daily weight gain
- EDTA
ethylenediaminetetraacetic acid
- FC
feed conversion
- FW
final weight
- GH
growth hormone
- GHS-R
ghrelin receptor
- HCW
hot carcass weight
- HCY
hot carcass yield
- HMTBa
2-hydroxy-4-(methylthio)butanoic acid
- HRP
height of rumen papilla
- P1
first period
- P2
second period
- PAS
periodic acid Schiff
- PBS
phosphate-buffered saline
- RES
3 liters of milk/day during P1 and 6 liters of milk/day during P2 (milk restriction)
- RES + HMTBa
3 liters of milk/day during P1 and 6 liters of milk/day during P2 + 3.3 g of HMTBa/day in both periods
- SCFA
short-chain fatty acids
- TADG
total average daily gain
- tDMC
total DMC
- TFC
total feed conversion
- TWG
total weight gain
- WRP
width of rumen papilla
Acknowledgments
We express our gratitude to Marcus Ferreira Junior for his assistance regarding imaging and the Foundation for Research Support (FUNAPE) – UFG for the financial support.
Conflict of interest statement
The authors declare no real or perceived conflicts of interest.
Literature Cited
Rychen, G., G. Aquilina, G. Azimonti, V. Bampidis, M. L. Bastos, G. Bories, A. Chesson, P. S. Cocconcelli, G. Flachowsky, J. Gropp, et al.
Sugino, T., J. Yamaura, M. Yamagishi, A. Ogura, R. Hayash, Y. Kurose, M. Kojima, K. Kangawa, Y. Hasegawa, and Y. Terashima.
