


ABSTRACT
In this study, 15 polymorphic microsatellite markers were used to analyze the genetic structure and phylogenetic relationships of 6 dairy goat breeds in China, including 4 native developed breeds and 2 introduced breeds. The results showed that a total of 172 alleles were detected in 347 samples of the dairy goat breeds included in this study. The mean number of effective alleles per locus was 4.92. Except for BMS0812, all of the remaining microsatellite loci were highly polymorphic (polymorphism information content [PIC] > 0.5). The analysis of genetic diversity parameters, including the number of effective alleles, PIC, and heterozygosity, revealed that the native developed dairy goat breeds in China harbored a rich genetic diversity. However, these breeds showed a low breeding degree and a high population intermix degree, with a certain degree of inbreeding and within-subpopulation inbreeding coefficient (FIS > 0). The analysis of population genetic differentiation and phylogenetic tree topologies showed a moderate state of genetic differentiation among subpopulations of native developed breed dairy goats in China (0.05 < gene fixation coefficient [FST] < 0.15). The native developed breeds shared a common ancestor, namely, the Saanen dairy goat, originating from Europe. The results showed that there was a close genetic relationship between Wendeng and Laoshan dairy goats while the Guanzhong dairy goat and the Xinong Saanen dairy goat were also found to have a close genetic relationship, which were both in agreement with the formation history and geographical distribution of the breeds. This study revealed that adopting genetic management strategies, such as expanding pedigree source and strengthening multi-trait selection, is useful in maintaining the genetic diversity of native developed breeds and improving the population uniformity of dairy goats.
INTRODUCTION
China has a long history of using goat milk, dating back to 206 BCE. The total number of dairy goats raised in China is currently more than 12 million. According to textual research, the history of the formation of modern-day Chinese dairy goat breeds originated from the end of the 19th century. Numerous hybrid populations containing Saanen blood were formed after long-term crossbreeding to improve local goat breeds. From the 1960s, the Chinese government repeatedly introduced dairy goat breeds from the United States and Canada to meet the dairy demand using the genetic resources of dairy goats (Qi et al., 2004). Genetically stable breeds of modern dairy goats in China were gradually cultivated through ecological adaptation and systematic selection (CNCAGR, 2011). Among various breeds, Laoshan dairy goats (LSG), Xinong Saanen dairy goats (XSG), Guanzhong dairy goats (GZG), and Wendeng dairy goats (WDG) were listed in the national goat breed directory (Qi et al., 2004; CNCAGR, 2011).
To date, there have been few studies on the genetic diversity of dairy goat breeds in China (Wang et al., 2015). Other studies mainly focused on the polymorphism of a particular candidate gene and its linkage effect with production traits (Deng et al., 2010; Deng and Liu, 2010; Ma et al., 2010; Yue et al., 2011; Wang et al., 2013) or assessed the genetic diversity of various goat breeds in a particular geographical area based on the molecular polymorphisms of enzymes and microsatellite markers (Wang and Yue, 2008; Qi et al., 2009; Petlane et al., 2012; Zhao et al., 2014).
In this study, we systematically investigated the genetic diversity of dairy goat breeds in China using 15 polymorphic microsatellite markers to further understand the population genetic structure and phylogenetic relationships of these breeds. This study provides a reference for scientifically developing genetic management strategies and new breeds of dairy goat in China.
MATERIALS AND METHODS
Collection of Blood Samples
All animal experiments were approved by the Shandong Agricultural University Animal Care and Use Ethics Committee (Permit Number: SDAUA-2014-016) and were performed in accordance with the “Guidelines for Experimental Animals” of the Ministry of Science and Technology (Beijing, China). All surgery was performed according to recommendations proposed by the European Commission (1997), and all efforts were made to minimize suffering.
Six dairy goat breeds were studied, including 4 breeds cultivated in China and 2 breeds introduced from other countries (Table 1). The LSG, GZG, and WDG breeds were raised by farmers on dispersed farms in small populations. The LSG, GZG, and WDG breeds were sampled from 29, 20, and 31 farms, respectively. Xinong Saanen dairy goats, Saanen dairy goats (SNG), and Nubian dairy goats (NBG) were raised by large-scale farming on breeding farms.
Name, sample size, and sampling location of dairy goat breeds included in the study
| Breed1 | Abbreviation | Sample size | Sampling location |
|---|---|---|---|
| *Wendeng dairy goat | WDG | 93 | Wendeng City, Shandong Province |
| *Laoshan dairy goat | LSG | 85 | Qingdao City, Shandong Province |
| *Guanzhong dairy goat | GZG | 46 | Fuping County, Shaanxi Province |
| *Xinong Saanen dairy goat | XSG | 40 | Yangling County, Shaanxi Province |
| **Saanen dairy goat | SNG | 42 | Kunming City, Yunan Province |
| **Nubian dairy goat | NBG | 41 | Kunming City, Yunan Province |
| Total | 347 |
1One asterisk (*) indicates native dairy breeds (which were widely used in China and developed from mating imported SNG bucks with indigenous does [Wang et al.,2015]), and two asterisks (**) indicate introduced dairy breeds.
At least 40 goats, comprising 95% ewes and 5% rams, were randomly selected from each breed for a total sample size of 347 individuals. None of the sampled goats had common ancestors within 3 generations according to the records of their pedigree. Venous blood specimens were collected and anticoagulated with acid citrate dextrose. The specimens were kept in an incubator at −20°C and transported to the laboratory stored in a −20°C refrigerator (Wang and Yue, 2008; Wang et al., 2015).
Extraction of DNA and Sequencing of PCR Products
Total DNA used in PCR amplification was extracted from blood specimens using a freeze–thaw method with the TIANamp blood DNA kit (from Tiangen Biotech [Beijing], Co., Ltd., Beijing, P. R. China). The quality and quantity of DNA extracts were determined using 0.8% agarose gel electrophoresis and a UV spectrophotometer. No smearing was observed, and both the concentration and the purity of extracted DNA were in full compliance with the requirements of PCR amplification.
Fifteen pairs of microsatellite primers (Table 2) were selected from the goat microsatellite loci recommended by the Food and Agriculture Organization—International Society for Animal Genetics (FAO, 1998). Polymorphisms in the dairy goat populations were verified by the Animal Conservation Biology Laboratory, Shandong Agricultural University (Tai'an, P. R. China; Sun et al., 2006; Wang and Yue, 2008). All primers were synthesized by the Shanghai Biological Engineering Company (Fedbio, Shanghai, P. R. China) with the 5′ end labeled with blue fluorescent dye. Polymerase chain reaction amplification was performed by referring to the amplification conditions of the original primers with minor modifications.
Microsatellite loci, primer sequences, and annealing temperatures used in the study
| Microsatellite locus | Primer sequence (5′→3′)1 | Annealing temperature, °C |
|---|---|---|
| BM302 | F: GAATTCCCATCACTCTCTCAGC | 57 |
| R: GTTCTCCATTGAACCAACTTCA | ||
| BMS0812 | F: TGGACAGGACTGAGTATGCA | 57 |
| R: AGGTATCCACTAACACAGCCA | ||
| INRA023 | F: GAGTAGAGCTACAAGATAAACTTC | 53 |
| R: TAACTACAGGGTGTTAGATGAACTCA | ||
| OarFCB20 | F: GGAAAACCCCCATATATACCTATAC | 58 |
| R: AAATGTGTTTAAGATTCCATACATGTG | ||
| MAF070 | F: CACGGAGTCACAAAGAGTCAGACC | 63 |
| R: GCAGGACTCTACGGGGCCTTTGC | ||
| CSSM66 | F: ACACAAATCCTTTCTGCCAGCTGA | 63 |
| R: AATTTAATGCACTGAGGAGCTTGG | ||
| BMS1248 | F: GTAATGTAGCCTTTTGTGCCG | 61 |
| R: TCACCAACATGAGATAGTGTGC | ||
| BM2830 | F: AATGGGCGTATAAACACAGATG | 59 |
| R: TGAGTCCTGTCACCATCAGC | ||
| BM1329 | F: AACACCGCAGCTTCATCC | 56 |
| R: TTGTTTAGGCAAGTCCAAAGTC | ||
| BM143 | F: CTGCAGGCAGATTCTTTATCG | 60 |
| R: ACCTGGGAAGCCTCCATATC | ||
| INRA011 | F: CGAGTTTCTTTCCTCGTGGTAGGC | 62 |
| R: GCTCGGGCACATCTTCCTTAGCAAC | ||
| BM3413 | F: TCCCTGGTAACCAATGAATTC | 56 |
| R: CAATGGATTTGACCCTCCC | ||
| INRA063 | F: GACCACAAAGGGATTTGCACAAGC | 61 |
| R: AAACCACAGAAATGCTTGGAAG | ||
| BM415 | F: GCTACAGCCCTTCTGGTTTG | 58 |
| R: GAGCTAATCACCAACAGCAAG | ||
| BM6526 | F: CATGCCAAACAATATCCAGC | 62 |
| R: TGAAGGTAGAGAGCAAGCAGC |
1F = forward; R = reverse. Fifteen pairs of microsatellite primers were selected from the goat microsatellite loci recommended by the Food and Agriculture Organization—International Society for Animal Genetics (FAO, 1998). Polymorphisms in the dairy goat populations were verified by the Animal Conservation Biology Laboratory, Shandong Agricultural University (Tai'an, P. R. China; Sun et al., 2006; Wang and Yue, 2008). All primers were synthesized by the Shanghai Biological Engineering Company (Fedbio, Shanghai, P. R. China) with the 5′ end labeled with blue fluorescent dye.
The PCR amplification system for microsatellite DNA molecules contained (25 μL each) 1.5 mmol/L Mg2+, 2.5 μL of 10× PCR buffer, 2.0 μL of 2.0 mmol/L deoxyribonucleotide triphosphates, 0.4 μL of each upstream and downstream primer (50 μmol/L), 0.2 μL of 5 units Taq polymerase, and 0.8 μL of DNA template; triple-distilled water was added to bring the final volume to 25 μL. The PCR program was as follows: predenaturation at 95°C for 10 min; denaturation at 94°C for 30 s, annealing at 53 to 63°C for 30 s, and extension at 72°C for 30 s, repeated for 34 to 36 cycles; final extension at 72°C for 10 min; and then a hold at 4°C.
The PCR products were checked using 1.5% agarose gel electrophoresis. The qualified amplicons were sent to the China National Human Genome Center (Shanghai, P. R. China) and sequenced through the ABI3730 Genetic Analyzer (Applied Biosystems, Foster City, CA). The sequencing results were analyzed for genotyping using Genemarker v1.51, a software tool provided with the ABI3730 Genetic Analyzer. The criteria for microsatellite genotyping were as follows: red peaks are molecular internal standards, and the value corresponding to blue peaks indicates the length of microsatellite loci; when the gene of interest is homozygous, the major peak in the genotyping diagram is unimodal; and when the gene of interest is heterozygous, the major peak in the genotyping diagram is bimodal, with the small peak presenting as a shadow zone in front of the major peak.
Genetic Diversity Data Analysis
The neutral test and Hardy–Weinberg equilibrium test were conducted for every locus in each breed, and the Shannon index and gene flow were calculated using POPGENE 1.32 (Yeh and Booyle, 1997). Allele frequency, heterozygosity (H), polymorphism information content (PIC), and various genetic distances were calculated using Molkin 3.0 (Gutiérrez and Goyache, 2004). The parameters of F-statistics and the coefficient of gene differentiation (GST) were calculated using FSTAT 2.9.3.2 (Goudet et al., 2002). A phylogenetic tree was constructed using the unweighted pair group with arithmetic mean (UPGMA) method using MEGA 5.0 (Kumar et al., 2008) based on Nei's minimum genetic distance (DM) and molecular coancestry information (fij). Population structure analysis was performed in Structure software v.2.3 (Pritchard et al., 2003). Principal component analysis (PCA) based on allele frequencies was conducted using SPSS 23 (George and Mallery, 2016).The genetic divergence time among subpopulations was estimated using the formula D = 2ɑT (Buchanan et al., 1994; Pérez et al., 2002), in which ɑ is the per-generation mutation rate of microsatellite DNA (1.1 × 10⁻⁴ for both sheep and goats; Crawford and Cuthbertson, 1996) and T is the reproductive isolation time of species, namely the differentiation time/generation interval time, which is 4 yr for sheep or goats (Wang and Yue, 2008).
RESULTS
Hardy–Weinberg Equilibrium Test and Neutral Test
The microsatellite loci MAF70, BMS1248, BM2830, BM1329, and INRA063 were in Hardy–Weinberg equilibrium in all of the 6 breeds, whereas the 10 remaining microsatellite loci showed disequilibrium (P < 0.01) in at least 1 breed. Among the 6 breeds, the number of microsatellite loci in the unbalanced state ranged from 2 to 5, which indicates that at least two-thirds of microsatellite loci in each breed were in Hardy–Weinberg equilibrium. Interestingly, microsatellite loci CSSM66 showed disequilibrium in all 6 breeds.
In the repeated simulation run for 1,000 replications, 10 microsatellite loci were found to be neutral at the 95% confidence interval (66.67%). This indicates that the selected microsatellite markers are suitable for investigating the genetic relationship of dairy goat populations. Although the microsatellite markers are neutral, a particular locus being located beyond the confidence interval is not necessarily a non-neutral locus. This is because during population evolution, selective breeding of heterozygotes may result in a consistent gene frequency of the locus and, thus, cause a reduction in the F value; in contrast, intentional selection of homozygotes will cause an increase in the F value.
Gene Abundance of Microsatellite Loci
A total of 172 alleles were detected at the studied microsatellite loci. The mean number of alleles (Na) per locus was 12.27, and the number of effective alleles (Ne) was 4.92. Except for BMS0812, the Na, Ne, PIC, and H values of the remaining loci ranged from 7 to 18, from 2.5175 to 9.4839, from 0.5818 to 0.8850, and from 0.4784 to 0.8946, respectively (Table 3). These results indicate that the selected microsatellite markers have a relatively high degree of polymorphism (PIC > 0.5), which is suitable for subsequent analysis of population genetic diversity.
The number of alleles (Na), number of effective alleles (Ne), polymorphism information content (PIC), and heterozygosity (H) of loci used in the study
| Locus | Na | Ne | PIC | H |
|---|---|---|---|---|
| BM302 | 9 | 4.0902 | 0.7242 | 0.7556 |
| BMS0812 | 3 | 1.9173 | 0.3963 | 0.4784 |
| INRA023 | 12 | 2.5175 | 0.5818 | 0.6028 |
| OarFCB20 | 10 | 3.2740 | 0.6605 | 0.6946 |
| MAF70 | 11 | 5.9789 | 0.8116 | 0.8327 |
| CSSM66 | 33 | 8.1982 | 0.8663 | 0.8780 |
| BMS1248 | 14 | 5.5118 | 0.7936 | 0.8186 |
| BM2830 | 15 | 3.8853 | 0.7108 | 0.7426 |
| BM1329 | 7 | 3.6062 | 0.6849 | 0.7227 |
| BM143 | 15 | 5.8865 | 0.8093 | 0.8301 |
| INRA011 | 18 | 9.4839 | 0.8850 | 0.8946 |
| BM3413 | 7 | 3.2175 | 0.6569 | 0.6892 |
| INRA063 | 7 | 3.1604 | 0.6344 | 0.6836 |
| BM415 | 11 | 6.0893 | 0.8147 | 0.8358 |
| BM6525 | 12 | 7.0333 | 0.8415 | 0.8578 |
Comparison of Genetic Diversity Among Different Breeds
For the studied dairy goat breeds, the mean Na was 8.0667, the Ne was 4.8117 (i.e., 59.64%), and the PIC was greater than 0.6 (Table 4). The mean observed heterozygosity (Ho) was 0.7013, which was lower than the expected heterozygosity (He) of 0.7545. The within-subpopulation inbreeding coefficient (FIS) was 0.012. These results show that the dairy goat breeds have a high degree of gene polymorphism (PIC > 0.5) and an extensive genetic basis; however, there exists a certain degree of inbreeding within subpopulations (FIS > 0).
The number of alleles (Na), number of effective alleles (Ne), observed heterozygosity (Ho), expected heterozygosity (He), polymorphism information content (PIC), and within-subpopulation inbreeding coefficient (FIS) of dairy goat breeds in China
| Breed1 | Na | Ne | Ho | He | PIC | Shannon index | FIS |
|---|---|---|---|---|---|---|---|
| WDG | 8.0667 | 4.1938 | 0.7064 | 0.7298 | 0.5812 | 1.5806 | 0.0363 |
| LSG | 8.1333 | 3.8207 | 0.6480 | 0.7056 | 0.5298 | 1.5158 | 0.0898 |
| GZG | 12.2667 | 4.4933 | 0.7791 | 0.7410 | 0.5649 | 1.6095 | −0.0333 |
| XSG | 7.7333 | 4.1354 | 0.8177 | 0.7198 | 0.5510 | 1.5389 | −0.0108 |
| SNG | 6.4467 | 3.4430 | 0.6546 | 0.6389 | 0.4712 | 1.3426 | −0.0151 |
| NBG | 6.6600 | 3.1377 | 0.6668 | 0.6443 | 0.4497 | 1.3029 | −0.0803 |
| Total | 8.0667 | 4.8117 | 0.7013 | 0.7545 | 0.7163 | n/a | 0.0120 |
1WDG = Wendeng dairy goat; LSG = Laoshan dairy goat; GZG = Guanzhong dairy goat; XSG = Xinong Saanen dairy goat; SNG = Saanen dairy goat; NBG = Nubian dairy goat.
Compared with the introduced dairy goat breeds, the 4 native cultivated dairy goat breeds exhibited a richer genetic diversity. Specifically, GZG had a higher PIC (0.5649) and Shannon index (1.6095) than the other breeds. This indicates that the GZG breed is rich in gene polymorphisms and has a high degree of population disorder, perhaps due to the significant combined effects of selection, mutation, and genetic drift.
Overall Genetic Parameters of the Dairy Goat Populations
The 6 dairy goat breeds had a self-coancestry of 0.6436 and a mean coancestry within subpopulations of 0.2859 (Table 5). The parameter analysis of F-statistics (Nei, 1978; Weir et al., 1996; Balloux and Lugon-Moulin, 2002) revealed a loss of H in the populations of dairy goat breeds in China (FIS > 0). Additionally, there was a certain degree of inbreeding, with an inbreeding coefficient of 0.2872 and a kinship distance (DK) of 0.3578. The level of genetic differentiation among subpopulations, namely, the gene fixation coefficient (FST), was moderate (0.05 < FST < 0.15). The total-population inbreeding coefficient (FIT) was 0.0744. The DM and Nei's minimum standard distance (DS) were 0.0560 and 0.2175, respectively.
Genetic parameters of the overall dataset for the 6 dairy goat breeds in China
| Before adjustment | After adjustment1 | |||
|---|---|---|---|---|
| Parameter | Value | SD | W_Value2 | SD |
| Mean coancestry within subpopulations | 0.3028 | 0.0019 | 0.2859 | 0.0020 |
| Self-coancestry | 0.6510 | 0.0029 | 0.6436 | 0.0030 |
| Inbreeding coefficient | 0.3021 | 0.0059 | 0.2872 | 0.0061 |
| Mean coancestry in the metapopulation | 0.2487 | 0.0020 | 0.2299 | 0.0018 |
| Nei's minimum genetic distance (DM) | 0.0541 | 0.0023 | 0.0560 | 0.0024 |
| Nei's minimum standard distance (DS) | 0.1956 | 0.0079 | 0.2175 | 0.0087 |
| Reynolds' genetic distant (DR) | 0. 0434 | 0.0019 | 0.0438 | 0.0020 |
| Mean kinship distance (DK) | 0.3482 | 0.0025 | 0.3578 | 0.0030 |
| Shared allele distance (DAS) | 0.6569 | 0.0023 | ||
| Wright's F-statistics | ||||
| Within-subpopulation inbreeding coefficient (FIS) | −0.0109 | 0.0073 | 0.0018 | 0.0080 |
| Gene fixation coefficient (FST) | 0.0770 | 0.0029 | 0.0727 | 0.0030 |
| Total-population inbreeding coefficient (FIT) | 0.0922 | 0.0068 | 0.0744 | 0.0075 |
1The values after adjustment by polymorphic information content of each locus.
2W_Value = the corrected value obtained after Weitzman weighting (Weitzman, 1993) according to the polymorphism information content value.
Genetic Differentiation of Microsatellite Loci Within Subpopulations
The selected microsatellite loci had a mean total-population heterozygosity (HT) of 0.757 and a mean subpopulation heterozygosity (HS) of 0.703 (Table 6); the GST was 0.071, indicating that 92.90% of the genetic variation was attributable to within-subpopulation genetic diversity and the remaining 7.10% was due to among-subpopulation genetic diversity. In particular, the GST was relatively high at loci BMS0812, INRA011, and BM3413.
Total-population heterozygosity (HT), subpopulation heterozygosity (HS), coefficient of gene differentiation (GST), F-statistics (within-subpopulation inbreeding coefficient [FIS], among-subpopulation differentiation coefficient—gene fixation coefficient [FST], and total-population inbreeding coefficient [FIT]), and gene flow (Nm) for the microsatellite loci used in this study
| Locus | HT | HS | GST | FIS | FST | FIT | Nm |
|---|---|---|---|---|---|---|---|
| BM302 | 0.769 | 0.742 | 0.035 | −0.095 | 0.036 | −0.056 | 5.610 |
| BMS0812 | 0.470 | 0.423 | 0.100 | 0.143 | 0.121 | 0.248 | 2.051 |
| INRA023 | 0.602 | 0.578 | 0.040 | −0.079 | 0.040 | −0.037 | 5.036 |
| OarFCB20 | 0.701 | 0.657 | 0.063 | −0.063 | 0.059 | 0.000 | 3.274 |
| MAF70 | 0.844 | 0.772 | 0.086 | −0.072 | 0.073 | 0.006 | 2.438 |
| CSSM66 | 0.888 | 0.825 | 0.070 | 0.267 | 0.067 | 0.315 | 2.841 |
| BMS1248 | 0.818 | 0.800 | 0.022 | −0.001 | 0.022 | 0.020 | 8.113 |
| BM2830 | 0.743 | 0.712 | 0.041 | 0.000 | 0.036 | 0.036 | 4.706 |
| BM1329 | 0.720 | 0.651 | 0.095 | −0.064 | 0.082 | 0.023 | 2.203 |
| BM143 | 0.835 | 0.767 | 0.081 | 0.034 | 0.084 | 0.116 | 2.565 |
| INRA011 | 0.896 | 0.807 | 0.100 | 0.047 | 0.099 | 0.142 | 2.071 |
| BM3413 | 0.687 | 0.618 | 0.101 | 0.103 | 0.075 | 0.171 | 2.027 |
| INRA063 | 0.694 | 0.653 | 0.060 | −0.098 | 0.065 | −0.027 | 3.517 |
| BM415 | 0.828 | 0.749 | 0.095 | 0.003 | 0.090 | 0.093 | 2.197 |
| BM6525 | 0.866 | 0.797 | 0.080 | 0.091 | 0.104 | 0.174 | 2.584 |
| Mean | 0.757 | 0.703 | 0.071 | 0.012 | 0.075 | 0.086 | 2.899 |
The mean FIS of the microsatellite loci was 0.0120. Seven loci (BM302, INRA023, OarFCB20, MAF70, BMS1248, BM1329, and INRA063) produced negative FIS values, indicating that inbreeding existed in 46.6% of the markers. The mean genetic differentiation coefficient among subpopulations (FST) was 0.0750. Both the FIS and FIT values were negative for the loci BM302, INRA023, and INRA063, indicating low levels of genetic differentiation with unapparent differentiation of genes and genotypes at particular loci.
Genetic Distances Among Breeds
Four genetic distances are presented in Table 7 to demonstrate the genetic differentiation among dairy goat breeds from different perspectives.
Genetic distances (Nei's minimum genetic distance [DN], Reynolds' genetic distance [DR], kinship distance [DK], and molecular coancestry distance [fij]) among dairy goat breeds based on 15 microsatellite loci1
| Type of genetic distance | Breed2 | WDG | LSG | XSG | GZG | SNG | NBG |
|---|---|---|---|---|---|---|---|
| DN\DR | WDG | 0.0000 | 0.0207 | 0.0190 | 0.0197 | 0.0485 | 0.0600 |
| LSG | 0.0309 | 0.0000 | 0.0351 | 0.0345 | 0.0624 | 0.0751 | |
| XSG | 0.0336 | 0.0594 | 0.0000 | 0.0222 | 0.0639 | 0.0982 | |
| GZG | 0.0335 | 0.0564 | 0.0331 | 0.0000 | 0.0570 | 0.0758 | |
| SNG | 0.0827 | 0.1012 | 0.0898 | 0.0817 | 0.0000 | 0.1009 | |
| NBG | 0.1041 | 0.1240 | 0.1408 | 0.1102 | 0.1364 | 0.0000 | |
| DK\fij | WDG | 0.3747 | 0.2339 | 0.2328 | 0.2212 | 0.2237 | 0.2004 |
| LSG | 0.4116 | 0.3875 | 0.2181 | 0.2093 | 0.2162 | 0.1916 | |
| XSG | 0.3729 | 0.4019 | 0.3026 | 0.2344 | 0.2294 | 0.1765 | |
| GZG | 0.3872 | 0.4149 | 0.3521 | 0.3382 | 0.2258 | 0.1954 | |
| SNG | 0.4163 | 0.4483 | 0.3946 | 0.3996 | 0.3073 | 0.2209 | |
| NBG | 0.4309 | 0.4587 | 0.4342 | 0.4202 | 0.4265 | 0.3045 |
1The Nei's minimum genetic distance and kinship distance are presented below the diagonal; the Reynolds' genetic distance and molecular coancestry distance are shown above the diagonal.
2WDG = Wendeng dairy goat; LSG = Laoshan dairy goat; XSG = Xinong Saanen dairy goat; GZG = Guanzhong dairy goat; SNG = Saanen dairy goat; NBG = Nubian dairy goat.
The traditional genetic distances, including Nei's genetic distance (DN), Reynolds' genetic distance (DR), and DK, depend mainly on the observed allele frequency and jointly reflect the short-term evolutionary processes (such as genetic drift and so on) among subpopulations. All of these genetic distances revealed a large genetic distance and a distant relationship between NBG and XSG as well as between SNG and the 4 dairy breeds cultivated in China. A moderate genetic distance and a relatively close relationship were obtained between SNG and XSG as well as between SNG and the 4 native developed dairy breeds. Among the 4 breeds, the smallest genetic distance and relationship were detected in 2 groups of breeds with a geographically close origin, that is, WDG vs. LSG and GZG vs. XSG.
The fij matrix is a new genetic distance algorithm reflecting the allele frequency in the founder population (Eding and Meuwissen, 2001; Eding et al., 2002). The fij results were markedly different from those obtained using the traditional genetic distances. Specifically, NBG showed the smallest genetic distance with XSG (0.1984) and the second smallest with LSG (0.2149). The largest genetic distance was found between GZG and XSG (0.2516), followed by WDG and LSG (0.2514).
Clustering by Structure Analysis and Principal Component Analysis
We analyzed the population structures of the 6 dairy goat groups using the Structure software (Pritchard et al., 2003). The result is shown in Fig. 1. At K (the number of populations) = 2, GZG, XSG, and SNG were clustered into the red group, while NBG was constituted almost entirely by the green. At the same time, LSG and WDG showed a mixed constitution of both green and red components. At K > 2, NBG was clustered separately, while GZG, XSG, and SNG were kept in the same group until the K value rose to 5. Under the condition of K = 2 to 7, SNG and NBG always kept a low level of color mixing. Conversely, LSG and WDG kept showing highly mixed colors. Showing close genetic relationships, GZG and XSG were clustered into the same group in all conditions, which is inconsistent with their breeding history records (Luo, 2009; CNCAGR, 2011).
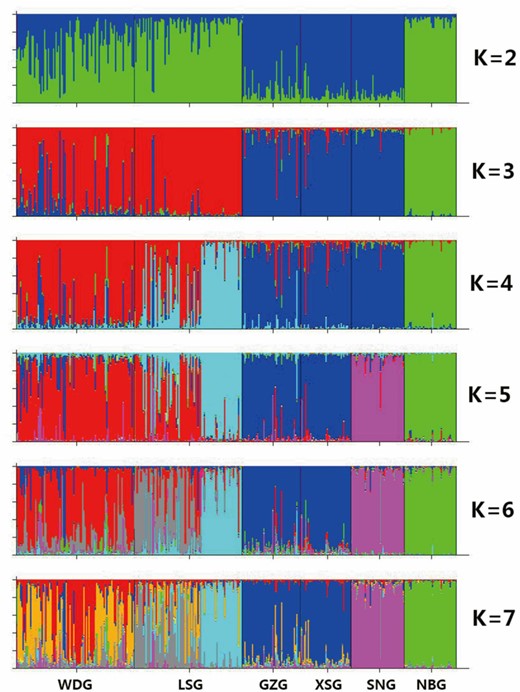
Clustering analysis by structure for the full-loci dataset assuming K = 2 to 7. Breed name abbreviations are labeled below the structure result. WDG, Wendeng dairy goat; LSG, Laoshan dairy goat; GZG, Guanzhong dairy goat; XSG, Xinong Saanen dairy goat; SNG, Saanen dairy goat; NBG, Nubian dairy goat.
Principal component analysis was performed among the studied 6 breeds on the 15 microsatellite loci. The first 2 principal components defined 87.46% of the total variance, with the first and second component accounting for 74.58 and 12.88%, respectively. As shown in Fig. 2A, the 6 breeds were divided into 2 groups, among which NBG was individually grouped. Wendeng dairy goats, LSG, GZG, XSG, and SNG were clustered in the right side group, close to each other, indicating the close genetic relationships among them. Of the 5 breeds, 3 small groups were constructed according to their geographical distribution (Shandong province: WDG, LSG; Shaanxi province: GZG, XSG; introduced breed: SNG). To verify the accuracy of the cluster results, another PCA has been made by using a frequency dataset of 172 alleles, while 84.59% of the total variance could be defined by the top 2 principal components (74.41 and 10.18%, respectively). As shown in Fig. 2B, the 6 breeds were divided into 2 groups, and NBG was individually grouped, which is similar to Fig. 2A. Among the 5 right side grouped breeds, native developed breeds were clustered as a small group, among which GZG, WDG, and LSG were tightly clustered.
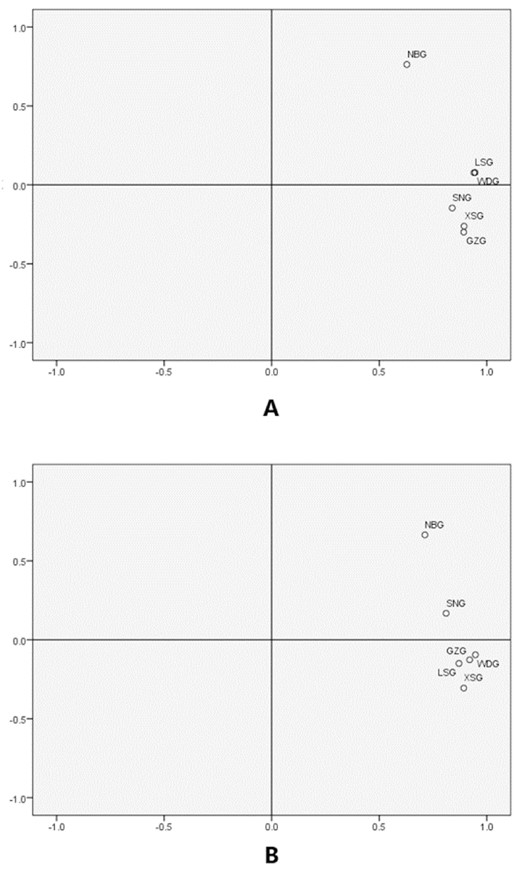
Principal component analysis (PCA) of all 6 breeds. (A) PCA based on microsatellite frequency. (B) PCA based on allele frequency. WDG, Wendeng dairy goat; LSG, Laoshan dairy goat; GZG, Guanzhong dairy goat; XSG, Xinong Saanen dairy goat; SNG, Saanen dairy goat; NBG, Nubian dairy goat.
Genetic Divergence Time and Phylogenetic Relationships Among Breeds
The genetic divergence time among dairy goat breeds estimated using DN ranged from 554 to 2,376 yr (Table 8). Specifically, the divergence time between WDG and LSG was 554 yr and that between XSG and GZG was 576 yr. Xinong Saanen dairy goats showed a divergence time of more than 2,000 yr with NBG and SNG. These are consistent with the phylogenetic dendrograms of dairy goat breeds constructed using the UPGMA method (Fig. 3) and are also in agreement with the historical records of locally developed dairy goat breeds regarding the parental origin, breeding process, and geographical distribution (Qi et al., 2004; CNCAGR, 2011).
Genetic divergence time (yr) among dairy goat breeds based on Nei's minimum genetic distance and molecular coancestry distance1
| Breed2 | WDG | LSG | GZG | XSG | SNG | NBG |
|---|---|---|---|---|---|---|
| WDG | 0 | 4,571 | 4,413 | 4,531 | 4,513 | 4,145 |
| LSG | 554 | 0 | 4,178 | 4,273 | 4,200 | 3,907 |
| GZG | 560 | 947 | 0 | 4,575 | 4,484 | 4,005 |
| XSG | 622 | 1,033 | 576 | 0 | 4,433 | 3,607 |
| SNG | 1,369 | 1,835 | 1,396 | 1,629 | 0 | 4,520 |
| NBG | 1,660 | 2,051 | 1,798 | 2,376 | 2,193 | 0 |
1Genetic divergence time estimated based on Nei's minimum genetic distance among breeds is shown below the diagonal, and the genetic divergence time estimated based on molecular coancestry distance among breeds is shown above the diagonal.
2WDG = Wendeng dairy goat; LSG = Laoshan dairy goat; GZG = Guanzhong dairy goat; XSG = Xinong Saanen dairy goat; SNG = Saanen dairy goat; NBG = Nubian dairy goat.
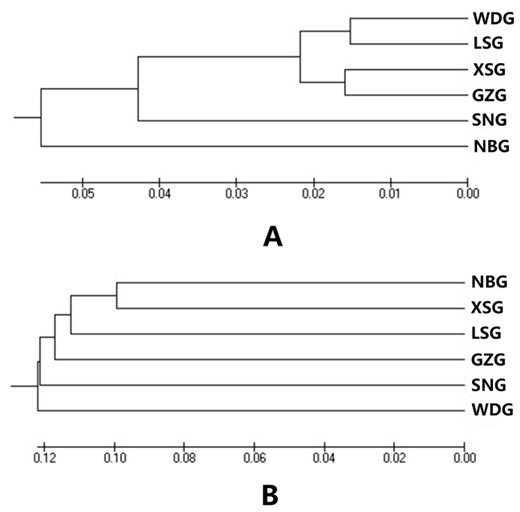
Unweighted pair group method with arithmetic mean dendrograms of 6 dairy goat breeds constructed based on Nei's minimum genetic distance (A) and molecular coancestry distance (B). WDG, Wendeng dairy goat; LSG, Laoshan dairy goat; GZG, Guanzhong dairy goat; XSG, Xinong Saanen dairy goat; SNG, Saanen dairy goat; NBG, Nubian dairy goat.
The genetic divergence time among all breeds estimated using the fij distance ranged from 3,907 to 4,575 yr. A combination with the phylogenetic dendrograms showed that the fij distance was lowest between XSG and NBG (0.1984), was 0.2514 between WDG and LSG, and was highest between XSG and GZG (0.2516).
DISCUSSION
Breeding History of Four Native Developed Dairy Goat Breeds in China
Xinong Saanen dairy goat breeding began in the 1930s in Shaanxi province (China). A group of SNG imported from the United States in 1936 was used for localized domestication. Systematic selection of this breed was started in 1944 by Northwest Agricultural College (currently Northwest A&F University). After several decades of continuous improvement, the breed was officially recognized in 1981 (Luo, 2009).
Under breeding in the central region of Shaanxi province, GZG was crossbred with XSG and local white goats since 1970; this breed was officially approved in 1990. Thus, the genetic background of GZG and XSG are quite similar (CNCAGR, 2011).
The breeding history of LSG and WDG can be traced back to 1898, when 2 groups of SNG were brought into Qingdao and Wendeng (both in Shandong province, China), respectively. For the population in Qingdao, more SNG were imported for further grading up with native goat breeds since 1927 and a novel dairy goat breed with the same appearance and high milk yield was gradually formed through hybridization. This breed was named the LSG in 1980 and formally recognized in 1989 (CNCAGR, 2011). For the population in Wendeng, 5 batches of XSG have been imported to improve the production capacity of this breed since 1979. After decades of systematic selection, this breed was formally recognized as the WDG in 2009 (CNCAGR, 2011).
Genetic Variability of Dairy Goat Breeds in China
Genetic diversity parameters, mainly including the Ne, PIC, and Shannon information index, are estimates based on allele frequency and are used to describe population genetic variability. In the present study, we demonstrated that the native developed dairy goat breeds in China had a rich genetic diversity, with higher values in genetic parameters, such as Ne and PIC than the introduced breeds (i.e., NBG and SNG). The low genetic diversity of the introduced breeds (PIC < 0.5) is perhaps due to the small population sizes when they were introduced into China and the long-term state of pure breeding, which caused the genetic drift of genes within breeds and a reduction in the Ne. The high genetic diversity of the 4 native developed breeds (PIC > 0.5) can be attributed mainly to the following factors. First, local goat breeds, which generally have greater genetic variation, are often used as the female parent in crossbreeding (Wang and Yue, 2008). Second, the breeding history of existing Chinese dairy goats is relatively short. In particular, planned selective breeding has been used for no more than 40 yr, resulting in a low level of selective breeding, a high Shannon index of greater than 1.0, and a high level of population intermix degree. For example, the WDG breed, which has a short breeding history, had the highest PIC value (0.5812) and a relatively high Shannon index value (1.5806), whereas the LSG breed, originating from a geographically close site with a long history of breeding, had relatively low PIC and Shannon index values (0.5298 and 1.5158, respectively). The above results suggest that to increase the population genetic diversity, we should increase the population genetic variation of introduced dairy goat breeds by increasing germplasm exchange with indigenous breeds as well as maintaining the genetic diversity and improving the population uniformity of native developed dairy goat breeds by expanding the pedigree/origin and strengthening multitrait selection.
Mating System of Dairy Goat Breeds in China
The FIS parameter describes the degree of loss of H within subpopulations or the degree of subpopulation deviation from Hardy–Weinberg equilibrium. When combined with other parameters, such as H and coefficient of kinship, FIS allows for the determination of the degree of inbreeding among individuals within a population (Weir et al., 1996). The present study demonstrated that there was inbreeding within the dairy goat populations in China (Ho < He; FIS > 0); however, the mating system showed different characteristics among breeds. We found that among the dairy goat breeds GZG, XSG, SNG, and NBG, the Ho was higher than the He and the FIS was negative. This indicates that these 4 populations have a relatively high proportion of heterozygotes and belong to outbreeding systems. Regarding the remaining breeds WDG and LSG, the Ho was lower than the He and the FIS was positive. This indicates that these 2 populations have a relatively high proportion of homozygotes and belong to inbreeding systems. Wang and Yue (2008) noted that different mating systems can cause variations in the population genetic structure. This is because in outbreeding systems, gene exchange or gene introgression often occurs, which increases the population heterogeneity and disorder; in inbreeding systems, the selective isolation effects related to small-population breeding and a limited pedigree/origin of rams are enhanced, which increase the population genetic homogeneity and gene homozygosity.
Genetic Differentiation of Dairy Goat Populations in China
The genetic differentiation of microsatellite markers forms a basis for population genetic differentiation. Our results revealed that there was a moderate level of genetic differentiation among subpopulations of dairy goats in China (0.05 < FST < 0.15). Specifically, 73% of the microsatellite loci were moderately differentiated. The among-breed genetic divergence time and phylogenetic dendrogram based on the DM showed that the SNG breed, which originated in Europe, is the common ancestor of the native developed dairy goat breeds in China. This is in agreement with the results obtained using mitochondrial DNA nucleotide polymorphism (Wang et al., 2015) and is also consistent with the known history of dairy goat breed cultivation in China (Qi et al., 2004; CNCAGR, 2011). However, the minimum genetic divergence time among the 4 breeds in our study was estimated to be 550 yr, and the estimated value does not match the historical record in which the SNG breed was introduced into China in the early 20th century (approximately 110 yr ago to the present). This discrepancy may have occured due to the following 2 reasons. First, the results calculated based on fij suggest that the founder effect (i.e., parental genetic information) has a significant influence on the short-term evolutionary process of breeds (Eding and Meuwissen, 2001; Eding et al., 2002). Second, the calculation method of genetic divergence time based on microsatellite mutation rate considers that genetic mutation or drift were independent evolutionary forces and ignores the potential effects of artificial selection on the short-term evolution of domesticated breeds. Therefore, it is necessary to take into consideration multiple factors including the type and mutation pattern of genetic markers, as well as the size, migration rate, and selection coefficient of populations of interest, to accurately describe the genetic divergence time between 2 populations.
In general, the 15 microsatellite loci used in this study were highly polymorphic and may be used as an effective genetic marker for genetic diversity analysis and phylogenetic analysis. The phylogenetic tree based on microsatellite markers showed that the genetic evolution and genetic relationship of dairy goat breeds were clear and that the genetic distance was consistent with the geographic distance, which reflected the ecological role in the formation and evolution of the breeds.
LITERATURE CITED
Footnotes
This work was financially supported by Key R & D projects in Shandong Province (no. 2015GNC110003), Shandong Provincial Modern Agriculture Industry Technology System (number SDAIT-10–01), Shandong Province Natural Science Foundation (number ZR2014CM029), and Shandong Province Higher Educational Science and Technology Programme (number J14LF07). The funders had no role in the study design, data collection and analysis, decision to publish, or preparation of the manuscript.
We would like to thank the Qingdao Animal Husbandry and Veterinary Research Institute, the Wendeng Animal Husbandry and Veterinary Technical Service Center, the Yunnan Academy of Animal Science, the Northwest AF University Saanen Goats Stock Field, and the Fuping county Animal Husbandry and Veterinary Bureau for providing the experimental goats and assisting in the sample collection.
